

Glycosylation of Immunoglobulin G Associates With Clinical Features of Inflammatory Bowel Diseases
- PMID: 29309774
- PMCID: PMC5880750
- DOI: 10.1053/j.gastro.2018.01.002
Glycosylation of Immunoglobulin G Associates With Clinical Features of Inflammatory Bowel Diseases
Abstract
Background and aims: Causes of inflammatory bowel diseases are not well understood and the most prominent forms, Crohn's disease (CD) and ulcerative colitis (UC), are sometimes hard to distinguish. Glycosylation of IgG has been associated with CD and UC. IgG Fc-glycosylation affects IgG effector functions. We evaluated changes in IgG Fc-glycosylation associated with UC and CD, as well as with disease characteristics in different patient groups.
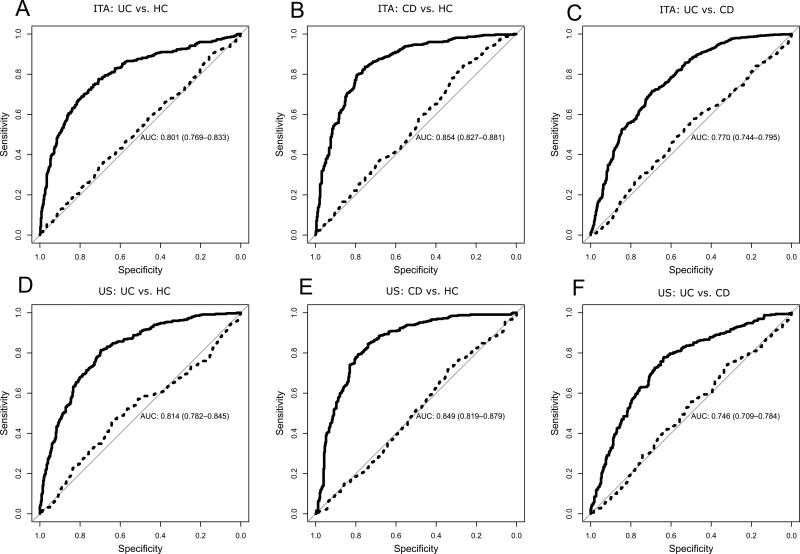
Methods: We analyzed 3441 plasma samples obtained from 2 independent cohorts of patients with CD (874 patients from Italy and 391 from the United States) or UC (1056 from Italy and 253 from the US and healthy individuals [controls]; 427 in Italy and 440 from the United States). IgG Fc-glycosylation (tryptic glycopeptides) was analyzed by liquid chromatography coupled to mass spectrometry. We analyzed associations between disease status (UC vs controls, CD vs controls, and UC vs CD) and glycopeptide traits, and associations between clinical characteristics and glycopeptide traits, using a logistic regression model with age and sex included as covariates.
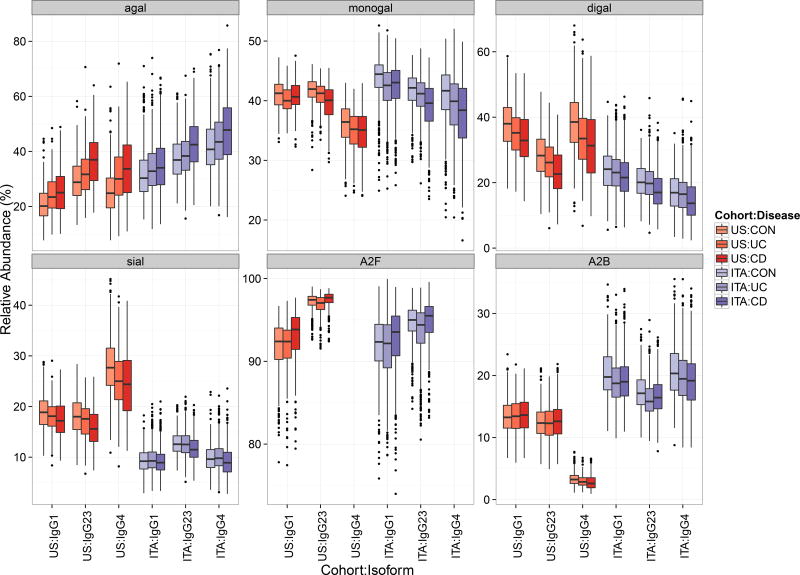
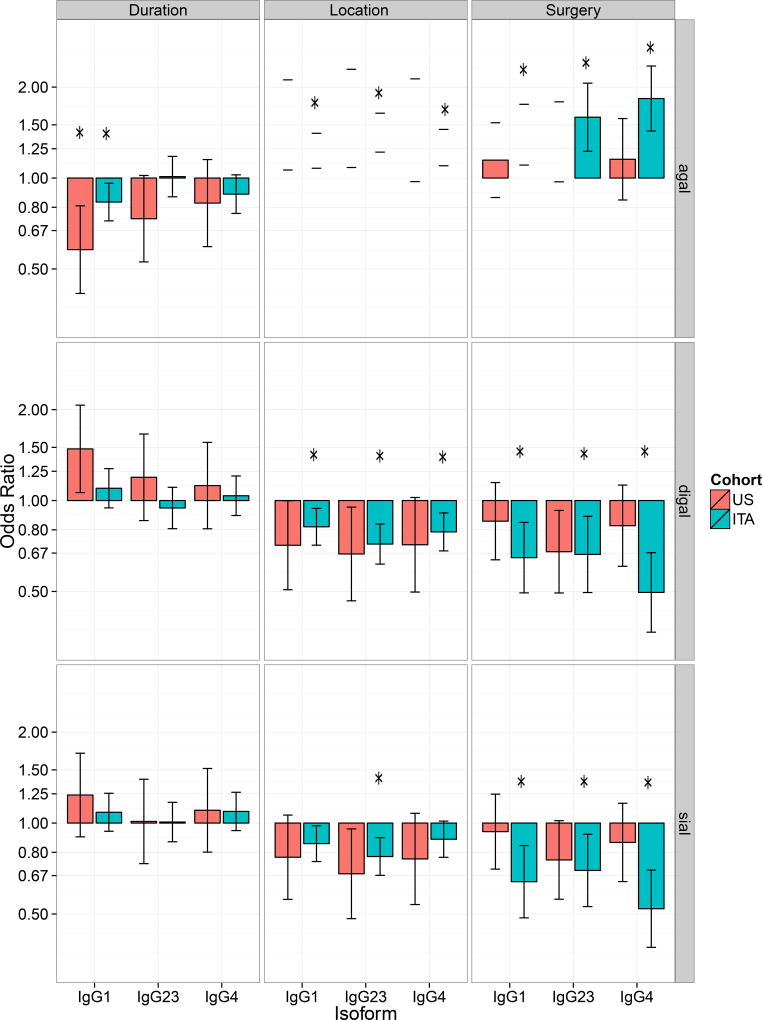
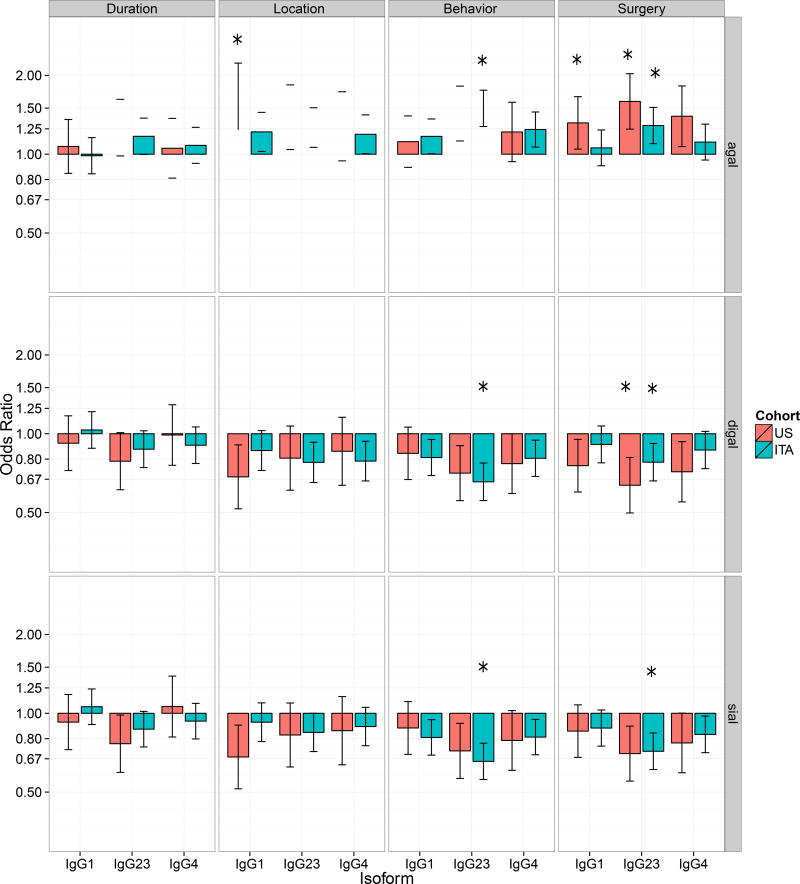
Results: Patients with CD or UC had lower levels of IgG galactosylation than controls. For example, the odds ratio (OR) for IgG1 galactosylation in patients with CD was 0.59 (95% confidence interval [CI], 0.51-0.69) and for patients with UC was 0.81 (95% CI, 0.71-0.92). Fucosylation of IgG was increased in patients with CD vs controls (for IgG1: OR, 1.27; 95% CI, 1.12-1.44), but decreased in patients with UC vs controls (for IgG23: OR, 0.72; 95% CI, 0.63-0.82). Decreased galactosylation associated with more severe CD or UC, including the need for surgery in patients with UC vs controls (for IgG1: OR, 0.69; 95% CI, 0.54-0.89) and in patients with CD vs controls (for IgG23: OR, 0.78; 95% CI, 0.66-0.91).
Conclusions: In a retrospective analysis of plasma samples from patients with CD or UC, we associated levels of IgG Fc-glycosylation with disease (compared to controls) and its clinical features. These findings could increase our understanding of mechanisms of CD and UC pathogenesis and be used to develop diagnostics or guide treatment.
Keywords: Biomarker; Glycans; Glycopeptides; IBD.
Copyright © 2018 AGA Institute. Published by Elsevier Inc. All rights reserved.
Conflict of interest statement
GL is founder and owner of Genos LTD, company that specializes in high-throughput glycomics and has several patents in this field. FV, JS, ITA and GR are employees of Genos. GL is also founder and shareholder of GlycanAge LTD, company that markets GlycanAge test as a biomarker of healthy ageing. DPBM has consulted for Janssen, Cidara, Q Biologics, and Pfizer. Other authors have no conflict of interest to declare.
Figures
References
-
- Burisch J, Pedersen N, Čuković-Čavka S, et al. East-West gradient in the incidence of inflammatory bowel disease in Europe: the ECCO-EpiCom inception cohort. Gut. 2014;63:588–597. - PubMed
-
- Molodecky NA, Soon IS, Rabi DM, et al. Increasing incidence and prevalence of the inflammatory bowel diseases with time, based on systematic review. Gastroenterology. 2012;142:46–54. e42; quiz e30. - PubMed
-
- Burisch J, Jess T, Martinato M, et al. The burden of inflammatory bowel disease in Europe. J Crohns Colitis. 2013;7:322–37. - PubMed
-
- Burisch J, Munkholm P. Inflammatory bowel disease epidemiology. Curr Opin Gastroenterol. 2013;29:357–62. - PubMed
-
- Crohn’s and Colitis Foundation of America. The Facts about Inflammatory Bowel Diseases. Available at: http://www.crohnscolitisfoundation.org/assets/pdfs/updatedibdfactbook.pdf.
Publication types
MeSH terms
Substances
Grants and funding
- MC_UU_00007/1/MRC_/Medical Research Council/United Kingdom
- 12076/CRUK_/Cancer Research UK/United Kingdom
- G0701898/MRC_/Medical Research Council/United Kingdom
- R01 HS021747/HS/AHRQ HHS/United States
- MC_U127527198/MRC_/Medical Research Council/United Kingdom
- 18927/CRUK_/Cancer Research UK/United Kingdom
- G0600329/MRC_/Medical Research Council/United Kingdom
- U01 DK062413/DK/NIDDK NIH HHS/United States
- MC_PC_U127527198/MRC_/Medical Research Council/United Kingdom
- U01 AI067068/AI/NIAID NIH HHS/United States
- P01 DK046763/DK/NIDDK NIH HHS/United States
- R56 DK095820/DK/NIDDK NIH HHS/United States
- G0600237/MRC_/Medical Research Council/United Kingdom
LinkOut - more resources
Full Text Sources
Other Literature Sources
Medical
