. 2018 Mar:67:23-36.
doi: 10.1016/j.alcohol.2017.08.008. Epub 2017 Aug 19.

Alcohol operant self-administration: Investigating how alcohol-seeking behaviors predict drinking in mice using two operant approaches

Affiliations

Alcohol operant self-administration: Investigating how alcohol-seeking behaviors predict drinking in mice using two operant approaches

Mariah B Blegen et al. Alcohol. 2018 Mar.

Abstract

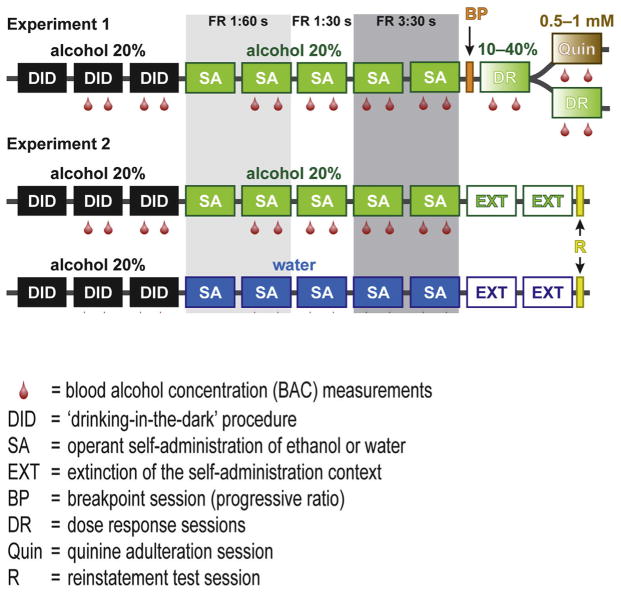
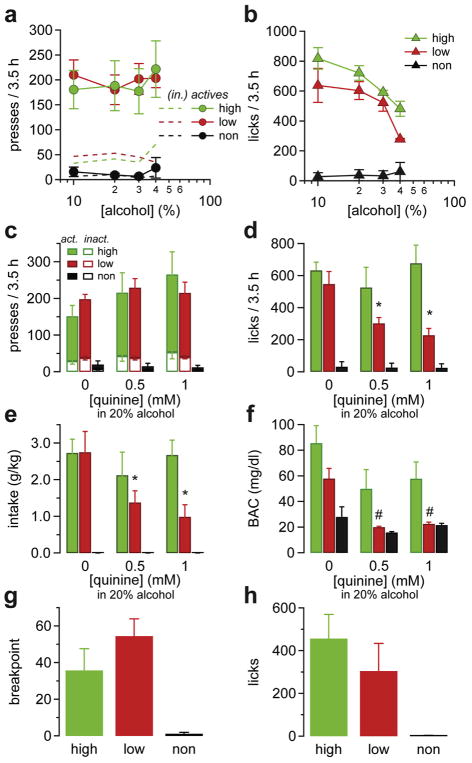
Alcohol operant self-administration paradigms are critical tools for studying the neural circuits implicated in both alcohol-seeking and consummatory behaviors and for understanding the neural basis underlying alcohol-use disorders. In this study, we investigate the predictive value of two operant models of oral alcohol self-administration in mice, one in which alcohol is delivered into a cup following nose-poke responses with no accurate measurement of consumed alcohol solution, and another paradigm that provides access to alcohol via a sipper tube following lever presses and where lick rate and consumed alcohol volume can be measured. The goal was to identify a paradigm where operant behaviors such as lever presses and nose pokes, as well as other tracked behavior such as licks and head entries, can be used to reliably predict blood alcohol concentration (BAC). All mice were first exposed to alcohol in the home cage using the "drinking in the dark" (DID) procedure for 3 weeks and then were trained in alcohol self-administration using either of the operant paradigms for several weeks. Even without sucrose fading or food pre-training, mice acquired alcohol self-administration with both paradigms. However, neither lever press nor nose-poke rates were good predictors of alcohol intake or BAC. Only the lick rate and consumed alcohol were consistently and significantly correlated with BAC. Using this paradigm that accurately measures alcohol intake, unsupervised cluster analysis revealed three groups of mice: high-drinking (43%), low-drinking (37%), and non-drinking mice (20%). High-drinking mice showed faster acquisition of operant responding and achieved higher BACs than low-drinking mice. Lick rate and volume consumed varied with the alcohol concentration made available only for high- and low-drinking mice, but not for non-drinking mice. In addition, high- and low-drinking mice showed similar patterns during extinction and significant cue-induced reinstatement of seeking. Only high-drinking mice showed insensitivity to quinine adulteration, indicating a willingness to drink alcohol despite pairing with aversive stimuli. Thus, this study shows that relying on active presses is not an accurate determination of drinking behavior in mice. Only paradigms that allow for accurate measurements of consumed alcohol and/or lick rate are valid models of operant alcohol self-administration, where compulsive-like drinking could be accurately determined based on changes in alcohol intake when paired with bitter-tasting stimuli.

Keywords: Alcohol drinking; Blood alcohol concentration; Breakpoints; Ethanol; Quinine adulteration.


Conflict of interest statement

Conflicts of interest

The authors declare no conflicts of interest.

Figures

Fig. 1
Fig. 1. Experimental outline
Each box represents a week of treatment/testing and the red drop drawings represent the blood samples extracted for BAC measurements. Shaded areas defined the different schedules and access times provided. Abbreviations: DID: ‘drinking-in-the-dark’ procedure; SA: operant self-administration of alcohol or water; EXT: extinction of the self-administration context; BP: breakpoint session (progressive ratio); DR: dose response sessions; Quin: quinine adulteration session; R: reinstatement test session.
Fig. 2
Fig. 2. Similar rates of operant responding for alcohol oral self-administration in mice under the CUP and SIPPER paradigm
(a, b) Schematic representation of the operant panel showing (a) two nose poke holes (active and inactive) with corresponding cue lights flanking a magazine with a cup in which the alcohol solution is delivered (CUP paradigm) and (b) two levers (active and inactive) with corresponding cue lights and sipper tube in the middle panel from where alcohol solution can be consumed while licks are recorded (SIPPER paradigm). (c, d) Rate of operant responding in the active (filled) and inactive (open) poke hole/2 h and lever presses/3.5 h during the first 10–15 sessions. (d, f, h) Shaded areas mark self-administration sessions with FR1 and 60-s access time/active press. Access time was reduced to 30 s/active press after that. (e, f) Rate of seeking responses measured as head entries in the food magazine (e, CUP) or licks to the sipper (f, SIPPER) over sessions. (g, h) Estimated (g, CUP) and measured (h, SIPPER) alcohol intake in g/kg body weight of mice over the weeks of operant self-administration. (i) Overall average blood alcohol concentrations (BAC) achieved at the end of the session for mice under the CUP (black) and SIPPER (blue) paradigm. (j) Weekly average blood alcohol concentrations (BAC) achieved at the end of the session for mice under the CUP (black) and SIPPER (blue) paradigm. All data are mean ± SEM (For interpretation of the references to color/colour in this figure legend, the reader is referred to the Web version of this article).
Fig. 3
Fig. 3. Licks and responding are better predictors of intake and BAC in the SIPPER paradigm
(a, b) Correlations between BAC achieved after the session and the rate of responses in the active manipulanda are significant in the SIPPER paradigm but not the CUP paradigm. (c, d) Total dispensed volume correlates with licks in the SIPPER (blue) but not with head entries in the cup magazine under the CUP (black). (e, f) Correlation between BACs and alcohol intake for individual mice and session under the CUP (e) and SIPPER (f) paradigm. Each symbol represents data from individual sessions from individual mice. *p < 0.05; (n.s.), non-significant (For interpretation of the references to color/colour in this figure legend, the reader is referred to the Web version of this article).
Fig. 4
Fig. 4. Mice with low and high alcohol intake differ in BAC and responding rates in SIPPER paradigm
(a) Frequency histogram of the overall mean alcohol intake for individual mice reveals three groups: non-responders (black), low- (red) and high- (green) drinking mice. (b) Overall BAC as a function of overall mean intake for all mice showing three groups color-coded. Inset: Pie chart shows the frequency distribution of non-, low-, and high-drinking mice. (c, e, f) Alcohol intake per session (c) and rate of active (e) and inactive (f) lever presses per 3.5-h self-administration session for non-, low-, and high-drinking mice (black, red, and green, respectively). Light-shaded areas mark self-administration sessions with FR1 schedule and 60-s access time/active press. Access time was then reduced to 30 s/active press (white area) and schedule changed to FR3 during sessions marked in dark gray (access time kept at 30 s/earned reward). (d) Weekly BAC achieved for mice in each group during the DID phase and the operant self-administration phase. All data are mean ± SEM. *p < 0.05 in 2WRM-ANOVA comparison between Low vs. High drinking mice (For interpretation of the references to color/colour in this figure legend, the reader is referred to the Web version of this article).
Fig. 5
Fig. 5. Pattern of alcohol drinking under the operant SIPPER paradigm
(a) Example raster plots of the operant responding for two mice belonging to (top) the high and (bottom) the low drinking group through two consecutive sessions (sessions 4 and 5). Black ticks denote active presses, purple is the earned access time and a recorded lick to the sipper is red. (b) Total access time earned per session for non-responders (black), low (red), and high (green) drinking mice. (c) Lick rate per session for each group. Light shaded areas mark self-administration sessions with FR1 schedule and 60-s access time/active press. Access time was then reduced to 30 s/active press (white area) and schedule changed to FR3 during sessions marked in dark gray (access time kept at 30 s/press). All data are mean ± SEM. *p < 0.05 in 2WRM-ANOVA comparison between Low vs. High drinking mice (For interpretation of the references to color/colour in this figure legend, the reader is referred to the Web version of this article).
Fig. 6
Fig. 6. High- and low-drinking mice have different sensitivity to alcohol dose and quinine adulteration
(a, b) Dose-response curve showing (a) rate of active presses and (b) rate of licks as a function of the alcohol concentrations in the delivered solution for each group. (cf) Effect of quinine adulteration on (c) the rate of lever presses, (d) the rate of licks, (e) the mean intake per session, and (f) the BAC after the session for each group of mice. Note that alcohol seeking (licks) and intake, but not active presses, are decreased in low-drinking mice when alcohol is mixed with 0.5–1 mM quinine but remain constant in high-alcohol drinking mice. (g) Breakpoints and (h) licks performed by mice in the low-, high-, and non-drinking groups during a progressive responding session. All data are mean ± SEM. *p < 0.05 in 2WRM-ANOVA in dose comparison within groups, #p < 0.05 in 2WRM-ANOVA comparison between Low vs. Higher drinking mice.
Fig. 7
Fig. 7. Operant responding and lick rates for high-alcohol drinking and water-drinking mice
(ac) Rate of (a) active presses, (b) inactive presses, and (c) licks for high-alcohol drinking (green) and water-drinking (blue) mice. (d) Total access time earned per session for high-alcohol drinking (green) and water-drinking (blue) mice. The light gray area shows the FR1 schedule and 60-s access/press. Later, access time to alcohol was reduced to 30 s/press (white area) and schedule changed to FR3 during the dark gray area sessions (30 s/access time). (e) Rate of responding during extinction sessions (no solution delivered) for high- (green) and low- (red) alcohol drinking and also water-drinking (blue) mice. (f) Seeking behavior measured as rate of operant responding in the active lever pressing during a single cue-induced reinstatement session (hatched bars) compared to baseline after extinction (filled bars) for mice in the high- (green) and low- (red) alcohol drinking group, alcohol-reinforced group, and also for water-drinking mice (blue). Alcohol-reinforced group showed a trend. All data are mean ± SEM. Data from the alcohol-reinforced group corresponds to the low- and high-drinking mice data (same as Figs. 4 and 5) combined as one different group. Data from the high-drinking mice shown in A–D are the same as data from high-drinking mice shown in Figs. 4 and 5 (For interpretation of the references to color/colour in this figure legend, the reader is referred to the Web version of this article).

Similar articles

Cited by

References

    1. Augier E, Dulman RS, Singley E, Heilig M. A method for evaluating the reinforcing properties of ethanol in rats without water deprivation, saccharin fading or extended access training. Journal of Visualized Experiments. 2017;119 https://doi.org/10.3791/53305. - DOI - PMC - PubMed
    1. Augier E, Flanigan M, Dulman RS, Pincus A, Schank JR, Rice KC, et al. Wistar rats acquire and maintain self-administration of 20% ethanol without water deprivation, saccharin/sucrose fading, or extended access training. Psychopharmacology (Berl) 2014;231:4561–4568. https://doi.org/10.1007/s00213-014-3605-3. - DOI - PMC - PubMed
    1. Barak S, Liu F, Ben Hamida S, Yowell QV, Neasta J, Kharazia V, et al. Disruption of alcohol-related memories by mTORC1 inhibition prevents relapse. Nature Neuroscience. 2013;16:1111–1117. https://doi.org/10.1038/nn.3439. - DOI - PMC - PubMed
    1. Barkley-Levenson AM, Cunningham CL, Smitasin PJ, Crabbe JC. Rewarding and aversive effects of ethanol in High Drinking in the Dark selectively bred mice. Addiction Biology. 2015;20:80–90. https://doi.org/10.1111/adb.12079. - DOI - PMC - PubMed
    1. Bertholomey ML, Verplaetse TL, Czachowski CL. Alterations in ethanol seeking and self-administration following yohimbine in selectively bred alcohol-preferring (P) and high alcohol drinking (HAD-2) rats. Behavioural Brain Research. 2013;238:252–258. https://doi.org/10.1016/j.bbr.2012.10.030. - DOI - PMC - PubMed

Publication types