. 2018 Jan 9;19(1):2.
doi: 10.1186/s13059-017-1374-0.

Epigenetic supersimilarity of monozygotic twin pairs

Affiliations

Epigenetic supersimilarity of monozygotic twin pairs

Timothy E Van Baak et al. Genome Biol. .

Abstract

Background: Monozygotic twins have long been studied to estimate heritability and explore epigenetic influences on phenotypic variation. The phenotypic and epigenetic similarities of monozygotic twins have been assumed to be largely due to their genetic identity.

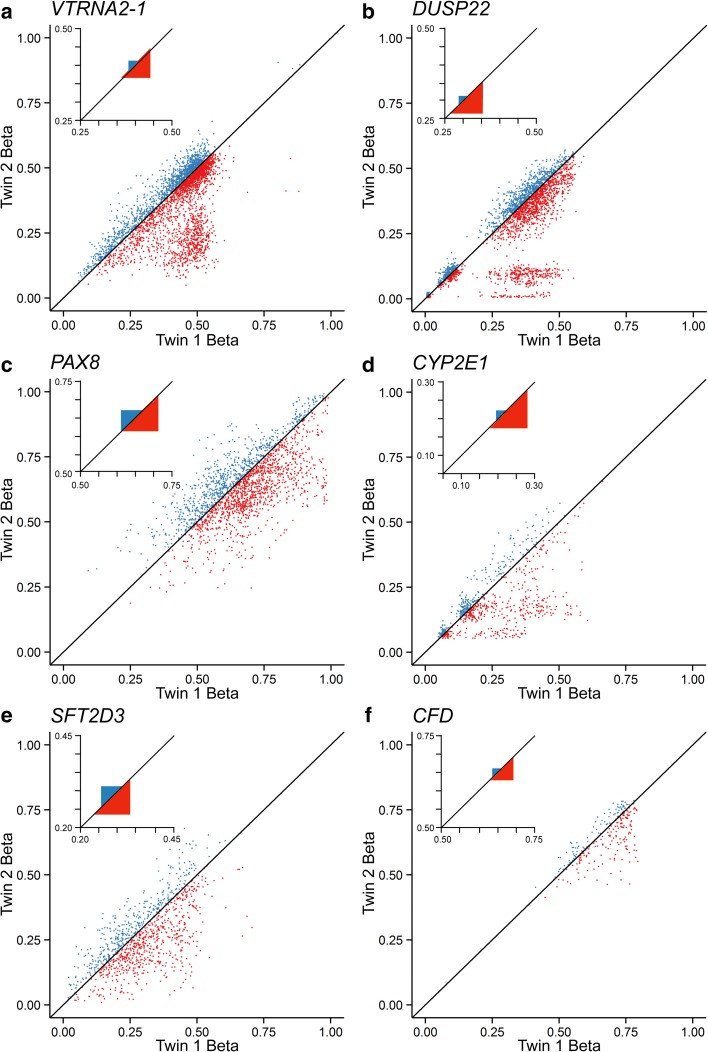
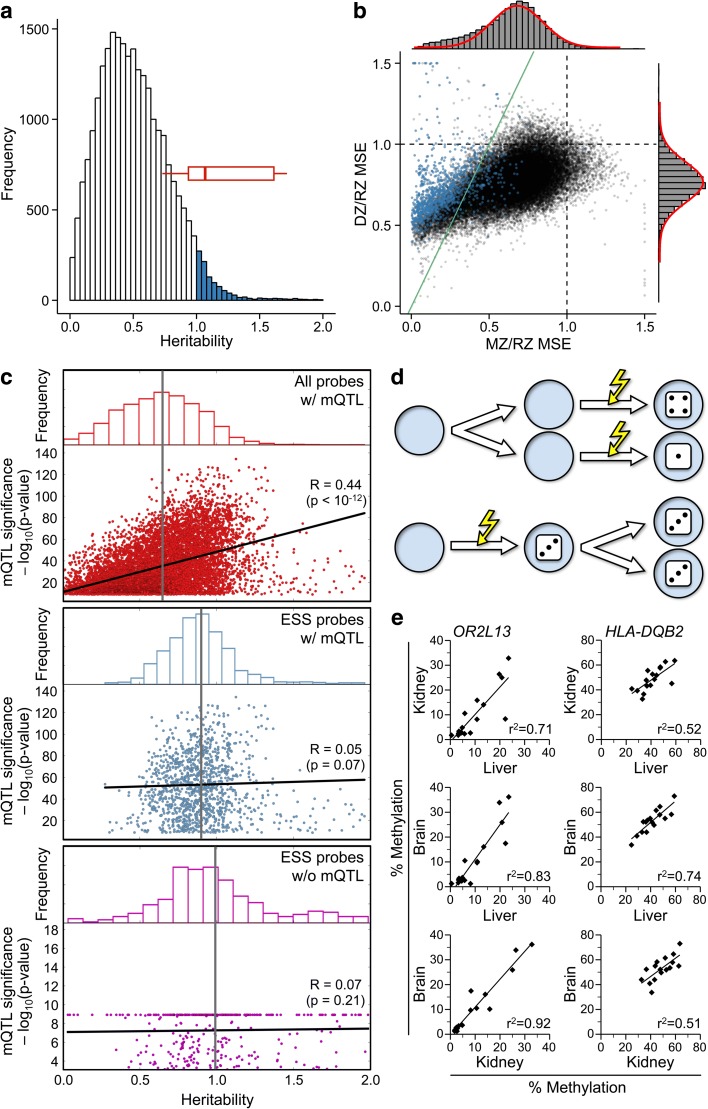
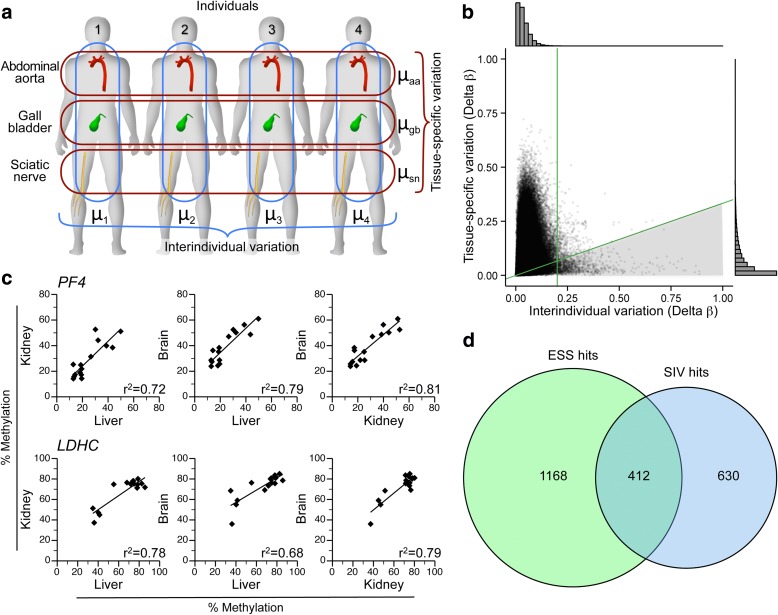
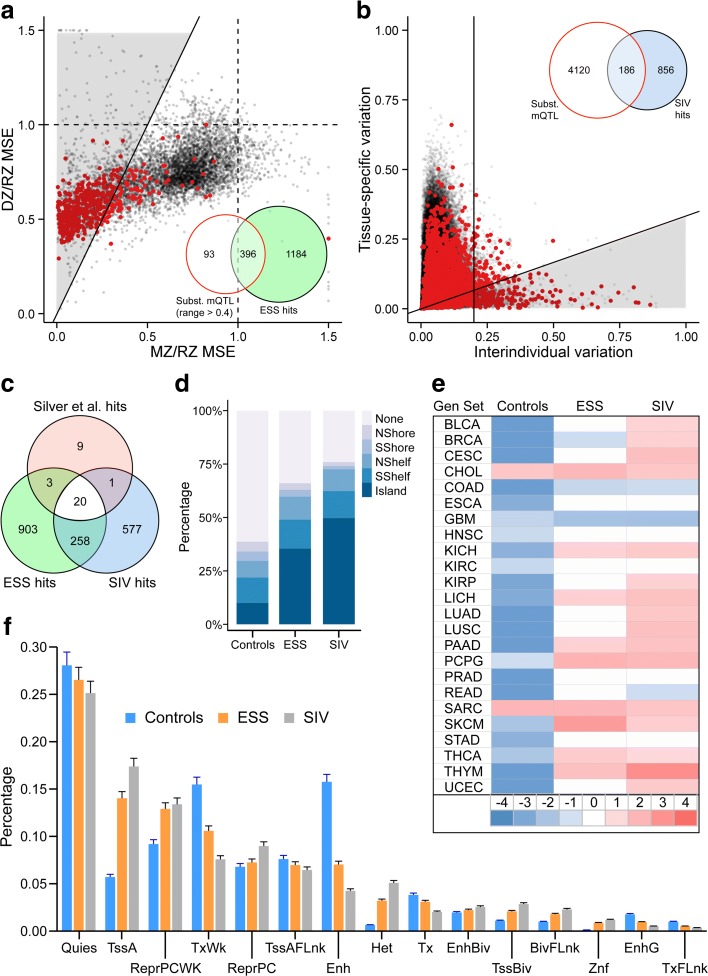
Results: Here, by analyzing data from a genome-scale study of DNA methylation in monozygotic and dizygotic twins, we identified genomic regions at which the epigenetic similarity of monozygotic twins is substantially greater than can be explained by their genetic identity. This "epigenetic supersimilarity" apparently results from locus-specific establishment of epigenotype prior to embryo cleavage during twinning. Epigenetically supersimilar loci exhibit systemic interindividual epigenetic variation and plasticity to periconceptional environment and are enriched in sub-telomeric regions. In case-control studies nested in a prospective cohort, blood DNA methylation at these loci years before diagnosis is associated with risk of developing several types of cancer.

Conclusions: These results establish a link between early embryonic epigenetic development and adult disease. More broadly, epigenetic supersimilarity is a previously unrecognized phenomenon that may contribute to the phenotypic similarity of monozygotic twins.

Keywords: Cancer; DOHaD; Developmental programming; Dizygotic; Epigenetics; Metastable epialleles; Monozygotic; Twins.


Conflict of interest statement

Consent for publication

Not applicable.

Competing interests

The authors declare that they have no competing interests.

Publisher’s Note

Springer Nature remains neutral with regard to jurisdictional claims in published maps and institutional affiliations.

Figures

Fig. 1
Fig. 1
Methylation in MZ twin pairs is highly concordant at candidate metastable epialleles (MEs). Each plot shows probe-specific β values for 97 MZ (blue, twin 2 > twin 1) and 162 DZ (red, twin 2 < twin 1) twin pairs, at loci previously identified as bona fide or candidate MEs [13, 14]. Insets show locus-average mean square errors (MSE) across all the MZ and DZ twins. MSE is much lower in MZ compared to DZ twins. a VTRNA2-1, 15 probes, 10.6-fold lower MSE (in MZ vs. DZ). b DUSP22, 11 probes, 16.5-fold lower. c PAX8, eight probes, 2.5-fold lower. d CYP2E1, three probes, 10.8-fold lower. e SFT2D3, four probes, 3.1-fold lower. f CFD, one probe, 6.6-fold lower
Fig. 2
Fig. 2
Some HM450 probes exhibit epigenetic supersimilarity (ESS). a Distribution of probe-specific narrow-sense heritability (h2) estimates from [9]. (Shown are data on 24,839 probes; 9566 probes with h2 < 0.001 were excluded for clarity.) Of the probes, 1058 show h2 > 1, including most of the probes illustrated in Fig. 1 (red box plot). b Normalized DZ MSE vs. MZ MSE for the 34,405 probes (top 10%) from Grundberg et al. [9]. Histograms (right and top) show distribution; red curves show best normal fit. Normalized DZ MSE (mean ± standard deviation = 0.76 ± 0.13) is normally distributed, but normalized MZ MSE (0.63 ± 0.23) is skewed left (P = 7.0 × 10–66). Probes with h2 > 1 are shown in blue. Probes to the left of the green line (y = 2x) are classified as ESS. c Associations between probe-level mQTL and heritability estimates (both from Grundberg et al. [9]). Among the 9708 probes that are both in the top 10% of interindividual variance and positive for mQTL (top panel) mean heritability is 0.64 (gray vertical line) and positively associated with the strength of mQTL. Among ESS probes positive for mQTL (middle panel), mean heritability is 0.90 and not associated with mQTL. Mean heritability of ESS probes negative for mQTL (0.99, bottom panel) is similar to that of mQTL-positive ESS probes. d Model to explain ESS in MZ twins. Numbers on the dice represent different methylation states at a specific locus. If de novo methylation occurs after embryo cleavage (top), each MZ embryo undergoes independent establishment. If de novo methylation occurs prior to embryo cleavage (bottom), both MZ embryos inherit the same methylation state. e Consistent with this model, bisulfite pyrosequencing in three tissues of 17 cadavers indicates that ESS probes also show systemic interindividual variation. Two examples are shown, OR2L13 and HLA-DQB2
Fig. 3
Fig. 3
Epigenetically supersimilar (ESS) probes are enriched for systemic interindividual variation (SIV). a Analytical strategy applied to data of Lokk et al. [20] on abdominal aorta, gall bladder, and sciatic nerve from each of four individuals. Interindividual and tissue-specific variation were quantified as the range of the individuals’ mean beta values (μ1, μ2, μ3, μ4) and the tissues’ mean beta values (μaa, μgb, μsn), respectively. b Tissue-specific vs. interindividual variation for 344,151 probes. Histograms (top and side) indicate the density distribution. Green lines illustrate cutoffs used to identify 1042 SIV probes (shaded region, interindividual > 0.2 and tissue-specific < 1/3 of interindividual variation). c Examples of bisulfite pyrosequencing data confirming systemic interindividual variation in selected loci: PF4 and LDHC. d The 1580 probes with evidence of ESS are 6.3-fold enriched for SIV (P < 10–10, chi-squared test)
Fig. 4
Fig. 4
Regions of epigenetic supersimilarity (ESS) and systemic interindividual variation (SIV) share genomic and epigenomic features. a Normalized DZ MSE vs. MZ MSE for the 6968 probes with range > 0.4, of which 489 (red) show substantial mQTL. Inset: ESS probes are 15-fold enriched for substantial mQTL (P < 10–10, chi-squared test). b Tissue-specific vs. interindividual variation at 344,151 probes, of which 2702 (red) are substantial mQTL. Inset: SIV probes are 24-fold enriched for substantial mQTL (P < 10–10, chi-squared test). c After filtering out substantial mQTL, ESS and SIV hits overlap more than two-thirds of probes at previously identified MEs [13]. d Relative to all probes in the top 10% of interindividual variance, ESS and SIV probe sets are enriched for CpG islands (both comparisons P < 10–10, chi-squared test). e Gene set enrichment analysis shows that both ESS and SIV probes are enriched for genes expressed in cancer (P = 4.7 × 10–8 and 4.8 × 10–9, respectively). Each row represents a different type of cancer in The Cancer Genome Atlas [24] (key to abbreviations in Additional file 2: Table S5). f Association of probe sets with epigenomic feature annotations derived from 111 reference epigenomes [25]. ESS and SIV probes are enriched for active promoters (TssA) and underrepresented at enhancers (Enh) (all four comparisons P < 10–10)
Fig. 5
Fig. 5
Interactions between DNA methylation and local sequence context at some top ESS regions. ad Average methylation vs. SNP genotype at ESS regions within CYP2E1, DUSP22, SPATC1L, and ZFP57. In each panel, gene diagram (top) shows location of ESS region where methylation analysis was performed (asterisk) relative to that of a SNP that was genotyped in 64 Gambian children. Grid summarizes normalized linkage disequilibrium (D’) across these ~3-kb regions in a Gambian population in Western Gambia (GWD, 1000 Genomes Project [80]). With the exception of G/G individuals at rs3129057 (ZFP57), there is substantial interindividual variation in average methylation within each genotype class. At CYP2E1 (a), average methylation is not associated with SNP genotype (P = 0.31). At DUSP22, SPATC1L, and ZFP57 (bd) average methylation is associated with genotype (P = 0.002, 0.02, and 0.0001, respectively). At these same loci, interindividual variance differs between the two homozygous genotypes; i.e., C/C vs. T/T at DUSP22 (P = 0.02), G/G vs. A/A at SPATC1L (P = 0.04), and G/G vs. A/A at ZFP57 (P = 1.9 × 10–6). e, f Clonal bisulfite sequencing data at two homozygous individuals at each of SPATC1L and ZFP57, respectively, confirm dramatic interindividual variation in DNA methylation in the absence of local sequence variation. Black, empty, and gray circles represent methylated, unmethylated, and indeterminate CpG sites, respectively. Vertical red line indicates the position of the SNP
Fig. 6
Fig. 6
Sites of epigenetic supersimilarity (ESS) and systemic interindividual variation (SIV) are enriched for effects of periconceptional environment on DNA methylation. a Relative to all probes on the HM450 array, mQTL-filtered ESS and SIV probes (but not negative control probes) are highly enriched for significant (FDR < 10%) associations with season of conception in rural Gambia. b Heat map of average effect of season of conception at loci that show a significant seasonal difference in methylation (FDR < 10%). At both ESS and SIV probes, as in previous studies of MEs in independent cohorts [13, 14], children conceived in the rainy season have higher methylation
Fig. 7
Fig. 7
At clusters of probes showing epigenetic supersimilarity (ESS), peripheral blood methylation at baseline is associated with risk of later cancer. Manhattan plots illustrating results of conditional logistic regression analyses of the association between baseline probe-specific methylation (HM450) and risk of later a breast cancer, b colorectal cancer, c kidney cancer, d lung cancer, e mature B-cell neoplasm, f prostate cancer, and g urothelial cell carcinoma. Only probes within clusters of ≥ 2 probes are shown. Probes plotted with positive values (red) have positive coefficients (i.e., more methylation in cases than controls) and probes plotted with negative values (green) have negative coefficients (delta beta value scale indicated). The dotted lines indicate P = 0.05. Among the ten most CpG-rich ESS clusters, colored boxes indicate seven at which methylation is significantly associated with later cancer: ZFP57 (colorectal cancer, P = 0.008), SPATC1L (colorectal cancer, P = 0.009, and prostate cancer, P = 0.01), OR2L13 (lung cancer, P = 0.010), VTRNA2-1 (lung cancer, P = 0.025, and MBCN, P = 0.009), DUSP22 (MBCN, P = 0.001, and UCC, P = 0.001), HCG4B (prostate cancer, P = 0.007), and PF4 (UCC, P = 0.013)

References

    1. Jaenisch R, Bird A. Epigenetic regulation of gene expression: how the genome integrates intrinsic and environmental signals. Nat Genet. 2003;33(Suppl):245–54. doi: 10.1038/ng1089. - DOI - PubMed
    1. Holliday R. The inheritance of epigenetic defects. Science. 1987;238:163–70. doi: 10.1126/science.3310230. - DOI - PubMed
    1. Baylin SB, Jones PA. A decade of exploring the cancer epigenome—biological and translational implications. Nat Rev Cancer. 2011;11:726–34. doi: 10.1038/nrc3130. - DOI - PMC - PubMed
    1. Birney E, Smith GD, Greally JM. Epigenome-wide association studies and the interpretation of disease -omics. PLoS Genet. 2016;12:e1006105. doi: 10.1371/journal.pgen.1006105. - DOI - PMC - PubMed
    1. Rakyan VK, Down TA, Balding DJ, Beck S. Epigenome-wide association studies for common human diseases. Nat Rev Genet. 2011;12:529–41. doi: 10.1038/nrg3000. - DOI - PMC - PubMed

Publication types