. 2018 May;125(5):735-746.
doi: 10.1016/j.ophtha.2017.11.020. Epub 2018 Jan 6.

Early Patterns of Macular Degeneration in ABCA4-Associated Retinopathy

Affiliations

Early Patterns of Macular Degeneration in ABCA4-Associated Retinopathy

Kamron N Khan et al. Ophthalmology. 2018 May.

Abstract

Purpose: To describe the earliest features of ABCA4-associated retinopathy.

Design: Case series.

Participants: Children with a clinical and molecular diagnosis of ABCA4-associated retinopathy without evidence of macular atrophy.

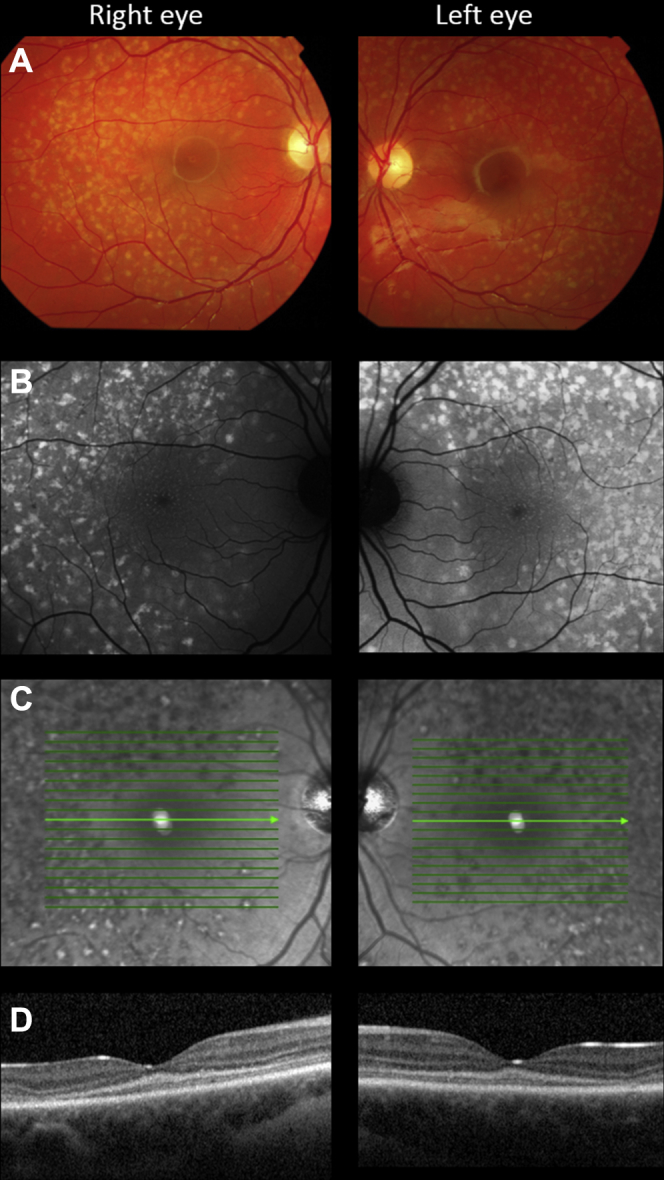
Methods: The retinal phenotype was characterized by color fundus photography, OCT, fundus autofluorescence (FAF) imaging, electroretinography, and in 2 patients, adaptive optics scanning laser ophthalmoscopy (AOSLO). Sequencing of the ABCA4 gene was performed in all patients.

Main outcome measures: Visual acuity, OCT, FAF, electroretinography, and AOSLO results.

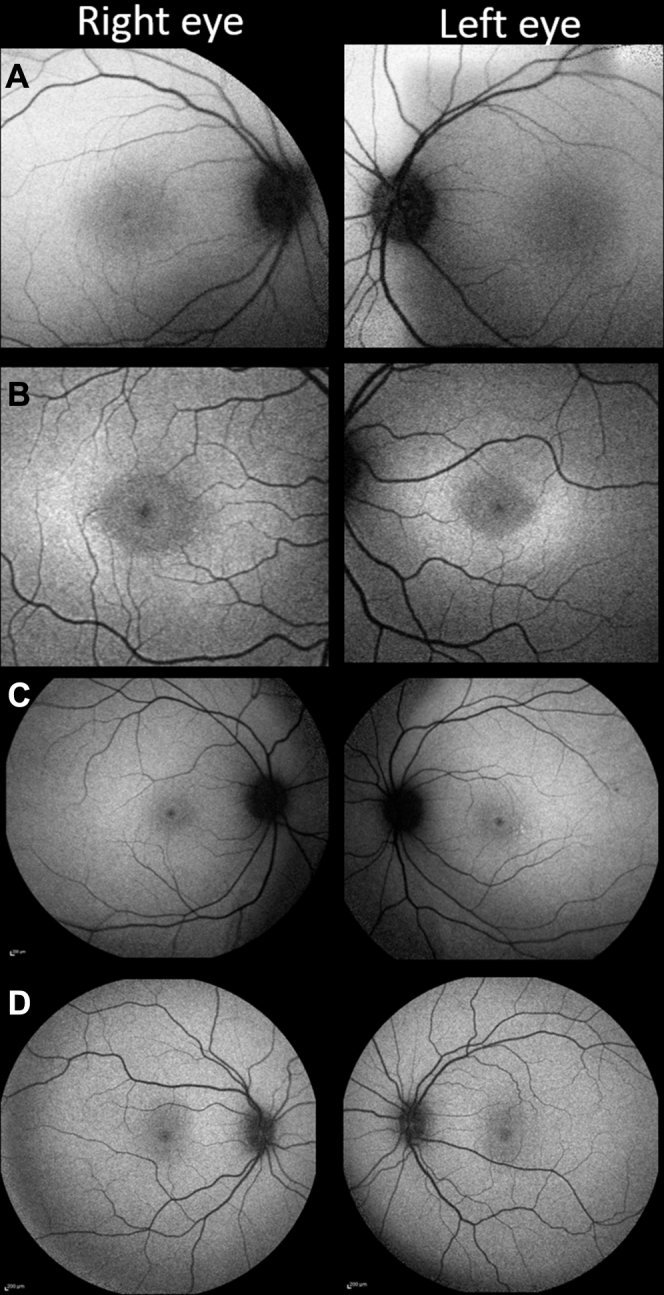
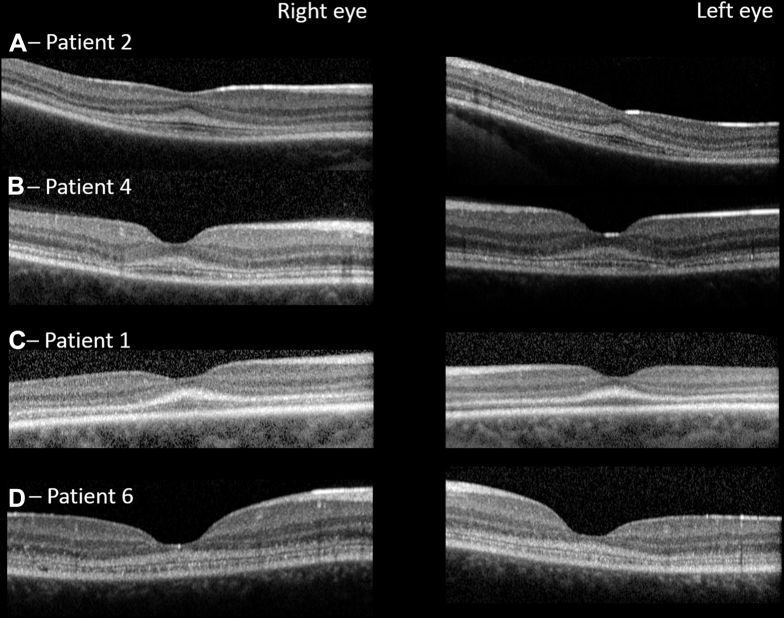
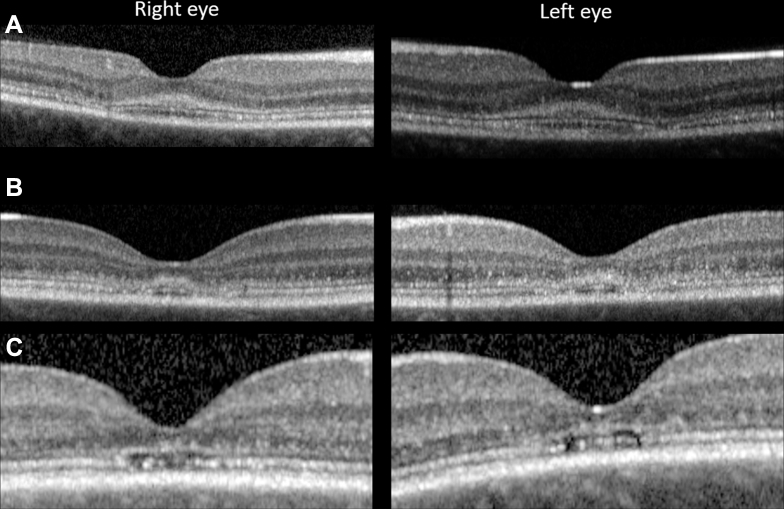
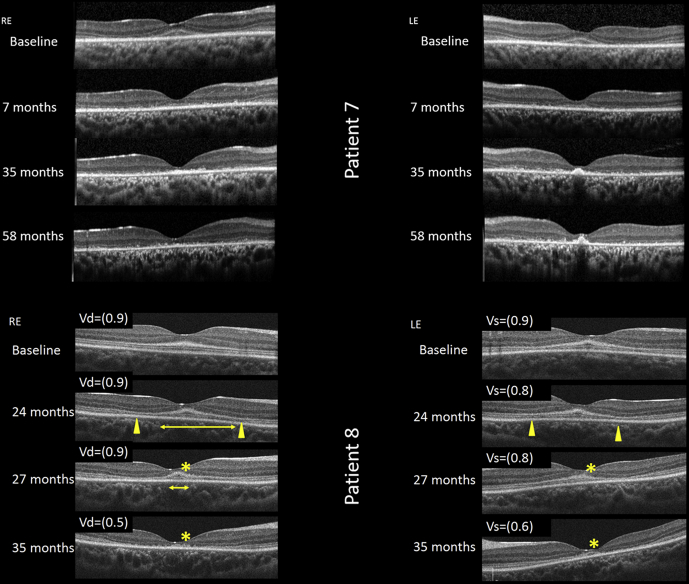
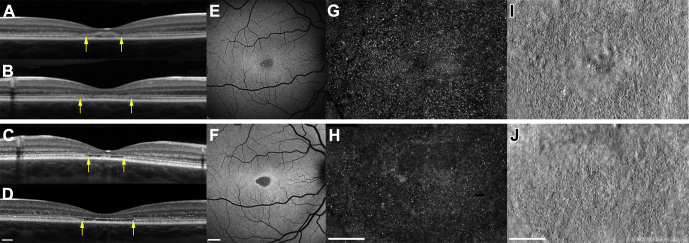
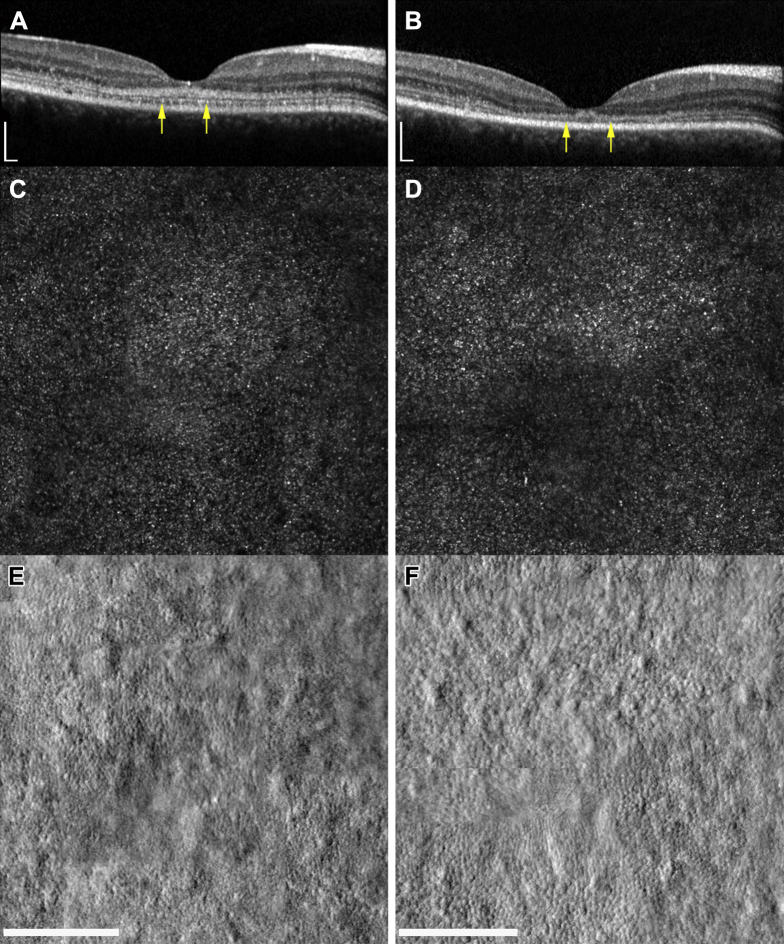
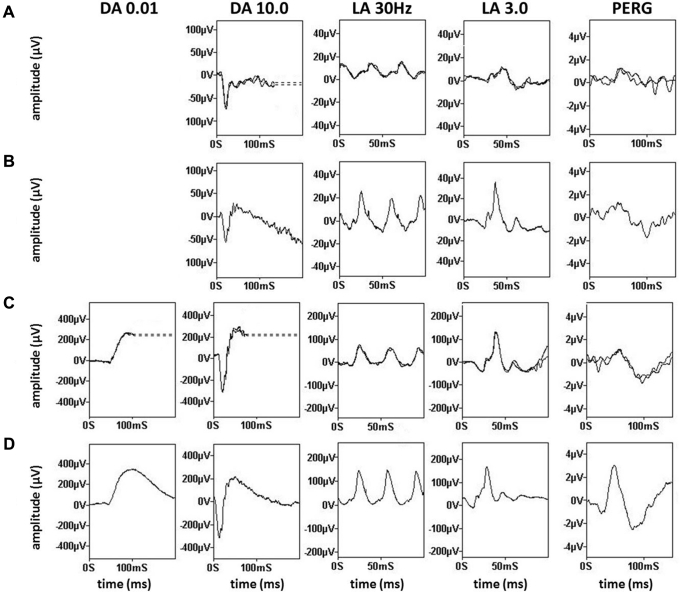
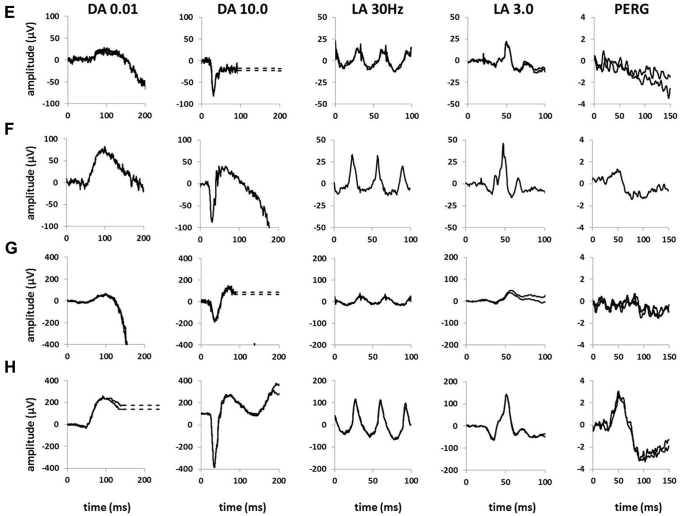
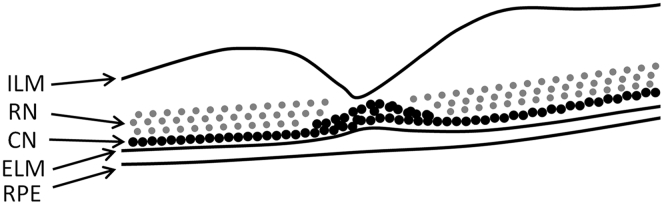
Results: Eight children with ABCA4-associated retinopathy without macular atrophy were identified. Biallelic variants in ABCA4 were identified in all patients. Four children were asymptomatic, and 4 reported loss of VA. Patients were young (median age, 8.5 years; interquartile range, 6.8 years) with good visual acuity (median, 0.155 logarithm of the minimum angle of resolution [logMAR]; interquartile range, 0.29 logMAR). At presentation, the macula appeared normal (n = 3), had a subtly altered foveal reflex (n = 4), or demonstrated manifest fine yellow dots (n = 1). Fundus autofluorescence identified hyperautofluorescent dots in the central macula in 3 patients, 2 of whom showed a normal fundus appearance. Only 1 child had widespread hyperautofluorescent retinal flecks at presentation. OCT imaging identified hyperreflectivity at the base of the outer nuclear layer in all 8 patients. Where loss of outer nuclear volume was evident, this appeared to occur preferentially at a perifoveal locus. Longitudinal split-detector AOSLO imaging in 2 individuals confirmed that the greatest change in cone spacing occurred in the perifoveal, and not foveolar, photoreceptors. Electroretinography showed a reduced B-wave-to-A-wave ratio in 3 of 5 patients tested; in 2 children, recordings clearly showed electronegative results.

Conclusions: In childhood-onset ABCA4-associated retinopathy, the earliest stages of macular atrophy involve the parafovea and spare the foveola. In some cases, these changes are predated by tiny, foveal, yellow, hyperautofluorescent dots. Hyperreflectivity at the base of the outer nuclear layer, previously described as thickening of the external limiting membrane, is likely to represent a structural change at the level of the foveal cone nuclei. Electroretinography suggests that the initial site of retinal dysfunction may occur after phototransduction.


Figures

Figure 1
Figure 1
Fundus autofluorescence (FAF) changes in childhood-onset ABCA4-associated retinopathy. A, Patient 2 has a subtle increase in foveal FAF, while maintaining a small central zone of physiological hypoautofluorescence. B, In addition to the changes present in (A), a rhomboid zone of hyperautofluorescence is visible in patient 4. C, Peripheral macula imaging from patient 1 revealing a more extensive, diffuse hyperautofluorescent signal. D, A normal pattern of childhood autofluorescence shown for comparison.
Figure 2
Figure 2
Multimodal imaging in patient 3. A, Color fundus photograph identifying multiple yellow flecks distributed throughout the posterior pole of both eyes, sparing the peripapillary retina. B, A 488-nm autofluorescence image revealing that the flecks are highly autofluorescent. In addition, numerous discrete autofluorescent dots are visible at the fovea, a feature of disease that usually is not observed. C, The flecks are predominantly hyporeflective, viewed using near infra-red light, but some appear to have a highly reflective center. D, OCT image (horizontal line scan through the foveola) demonstrating hyperreflectivity at the base of the outer nuclear layer and mild outer retinal degeneration in the temporal macula.
Figure 3
Figure 3
OCT images from 4 patients. Representative horizontal line scans through the foveola are shown for all patients. In all cases, there is a well-defined region of hyperreflectivity extending superiorly from the first highly reflective OCT line, the optical correlate of the external limiting membrane. It is maximally thick at the foveola, and reduces exponentially with increasing retinal eccentricity. In AD the ellipsoid zone (second highly reflective outer retinal line) also is readily visible.
Figure 4
Figure 4
OCT images highlighting patterns of early foveal degeneration. Horizontal line scans through the foveola. A, Patient 4 with early temporal collapse bilaterally. The integrity of ellipsoid zone has been breached just temporal to the foveola. B, C, Imaging in patient 5 demonstrating the same changes nasally and temporally (B) at baseline and (C) 19 months later.
Figure 5
Figure 5
The evolution of macular atrophy in childhood-onset ABCA4-associated retinopathy. Sequential OCT (horizontal line scans through the foveola) in (upper) patient 7 and (lower, with decimalized visual acuity) patient 8. The earliest structural change appears to be hyperreflectivity at the base of the outer nuclear layer (patient 8, baseline), associated with near normal vision. Over the next 2 years, parafoveal outer retinal atrophy developed (yellow arrowheads), whereas the foveola is relatively spared of these changes (yellow horizontal line baseline images from patients 8 and 7). By month 35, the ellipsoid zone at the foveola clearly is degenerating, associated with a drop in acuity (asterisk, patient 8). LE = left eye; RE = right eye; Vd = visual acuity dexter; Vs = visual acuity sinister.
Figure 6
Figure 6
Spectrum of foveal structure shown with (AD) OCT (scale bar, 200 μm), (E, F) fundus autofluorescence (scale bar, 1000 μm), and (GJ) adaptive optics scanning laser ophthalmoscopy (AOSLO; scale bar, 200 μm) at baseline (upper panel) and 19 months later (lower panel) for patient 5. Arrows denote outer edges of the region imaged on AOSLO. Vertical scan (A) and horizontal scan (B) demonstrating initial hyperreflectivity at the base of the outer nuclear layer and parafoveal outer retinal degeneration. Vertical scan (C) and horizontal scan (D) detail the evolution of outer retinal atrophy and parafoveal cavitation. E, F, Fundus autofluorescence over the same period. Adaptive optics scanning laser ophthalmoscopy imaging of the foveal cones at baseline (G, confocal; I, split-detector) and 19 months later (H, confocal; J, split-detector). G, H, Confocal imaging revealing areas of nonwaveguiding cones evident from both time points, predominantly in a parafoveal location, suggesting cell loss from baseline visit. H, However this is more apparent at the 19-month follow-up visit. Split-detector images show the diameter increase of inner segments and the increase in cell spacing over this period, again in a parafoveal location.
Figure 7
Figure 7
Foveal structure shown with (A, B) OCT and (C, D) adaptive optics scanning laser ophthalmoscopy at baseline (left hand column) and 13 months later (right hand column) for patient 6. Scale bars, 200 μm. Arrows denote outer edges of the region imaged on adaptive optics scanning laser ophthalmoscopy (AOSLO). Both (C, D) confocal and (E, F) split-detector imaging are presented. Confocal imaging reveals only subtle changes over this period, manifested by an increase in dark areas of nonwaveguiding cones. Split-detector imaging shows a more evident change in parafoveal cone structure over 13 months, with a marked increase in the diameter of cone inner segments.
Figure 8
Figure 8
Full-field electroretinography and pattern electroretinography in children with early-stage ABCA4-associated retinopathy. Recordings obtained with lower eyelid skin electrodes are shown for (A) patient 1 and (E) patient 2 and are compared with representative normal traces obtained with the same recording system (B and F, respectively). Recordings obtained with gold-foil corneal electrodes are shown for (C) patient 5 and (G) patient 7 and are compared with representative normal traces obtained with the same type of recording system (D and H, respectively). Dark-adapted (DA) responses are shown for flash strengths of 0.01 and 10.0 cd.s.m–2 (DA, 0.01; DA, 10.0) and for light-adapted (LA) electroretinography results for flash strength of 3.0 cd.s.m−2 (LA 3.0; 30 Hz and 2 Hz). Pattern electroretinography (PERG) is recorded to an alternating checkerboard. There is a reduced B-to-A ratio (electronegative results) in recordings from (A) patient 1 and (E) patient 2 consistent with dysfunction that occurs after phototransduction involving the (A) rod and cone or (E) rod system. Full-field electroretinography results (C) are normal for patient 5 and (G) show evidence of a cone–rod dystrophy in patient 7. Pattern electroretinography P50 reduction indicates macular dysfunction for patients 2, 5, and 7. All recordings showed a high degree of interocular symmetry and are illustrated for 1 eye only. Note the prestimulus delay in all single flash recordings with the exception of (H). For clarity, broken lines replace blink artefacts.
Figure 8
Figure 8
Full-field electroretinography and pattern electroretinography in children with early-stage ABCA4-associated retinopathy. Recordings obtained with lower eyelid skin electrodes are shown for (A) patient 1 and (E) patient 2 and are compared with representative normal traces obtained with the same recording system (B and F, respectively). Recordings obtained with gold-foil corneal electrodes are shown for (C) patient 5 and (G) patient 7 and are compared with representative normal traces obtained with the same type of recording system (D and H, respectively). Dark-adapted (DA) responses are shown for flash strengths of 0.01 and 10.0 cd.s.m–2 (DA, 0.01; DA, 10.0) and for light-adapted (LA) electroretinography results for flash strength of 3.0 cd.s.m−2 (LA 3.0; 30 Hz and 2 Hz). Pattern electroretinography (PERG) is recorded to an alternating checkerboard. There is a reduced B-to-A ratio (electronegative results) in recordings from (A) patient 1 and (E) patient 2 consistent with dysfunction that occurs after phototransduction involving the (A) rod and cone or (E) rod system. Full-field electroretinography results (C) are normal for patient 5 and (G) show evidence of a cone–rod dystrophy in patient 7. Pattern electroretinography P50 reduction indicates macular dysfunction for patients 2, 5, and 7. All recordings showed a high degree of interocular symmetry and are illustrated for 1 eye only. Note the prestimulus delay in all single flash recordings with the exception of (H). For clarity, broken lines replace blink artefacts.
Figure 9
Figure 9
Schematic retinal tomograph highlighting the location of photoreceptor nuclei. Cone nuclei lie within the basal outer nuclear layer (ONL), closely opposed to the external limiting membrane (ELM), except at the foveola, where they are most numerous. Rod nuclei (RN) are less spatially restricted, distributed throughout the entire ONL. The hyperreflectivity visible using OCT seems to correlate directly with the location of cone nuclei (CN). ILM = internal limiting membrane; RPE = retinal pigment epithelium.

References

    1. Lois N., Holder G.E., Bunce C. Phenotypic subtypes of Stargardt macular dystrophy-fundus flavimaculatus. Arch Ophthalmol. 2001;119:359–369. - PubMed
    1. van Huet R.A., Bax N.M., Westeneng-Van Haaften S.C. Foveal sparing in Stargardt disease. Invest Ophthalmol Vis Sci. 2014;55:7467–7478. - PubMed
    1. Crone J., Pfaffle R., Stobbe H. Familial combined pituitary hormone deficiency caused by PROP-1 gene mutation. Growth patterns and MRI studies in untreated subjects. Horm Res. 2002;57:120–126. - PubMed
    1. Dubra A., Sulai Y., Norris J.L. Noninvasive imaging of the human rod photoreceptor mosaic using a confocal adaptive optics scanning ophthalmoscope. Biomed Opt Express. 2011;2:1864–1876. - PMC - PubMed
    1. Scoles D., Sulai Y.N., Dubra A. In vivo dark-field imaging of the retinal pigment epithelium cell mosaic. Biomed Opt Express. 2013;4:1710–1723. - PMC - PubMed

Publication types

MeSH terms

Substances