. 2018 Feb 7;38(6):1493-1510.
doi: 10.1523/JNEUROSCI.1548-17.2017. Epub 2018 Jan 8.

Differentiation and Characterization of Excitatory and Inhibitory Synapses by Cryo-electron Tomography and Correlative Microscopy

Affiliations

Differentiation and Characterization of Excitatory and Inhibitory Synapses by Cryo-electron Tomography and Correlative Microscopy

Chang-Lu Tao et al. J Neurosci. .

Abstract

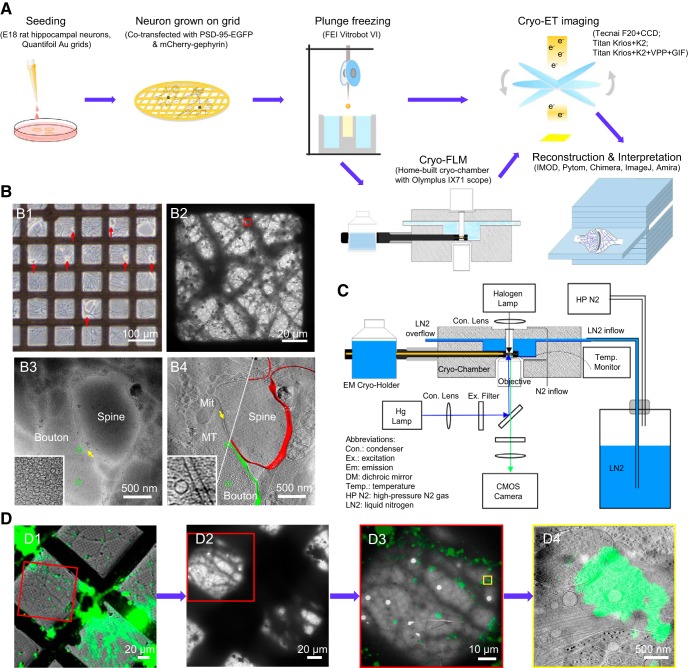
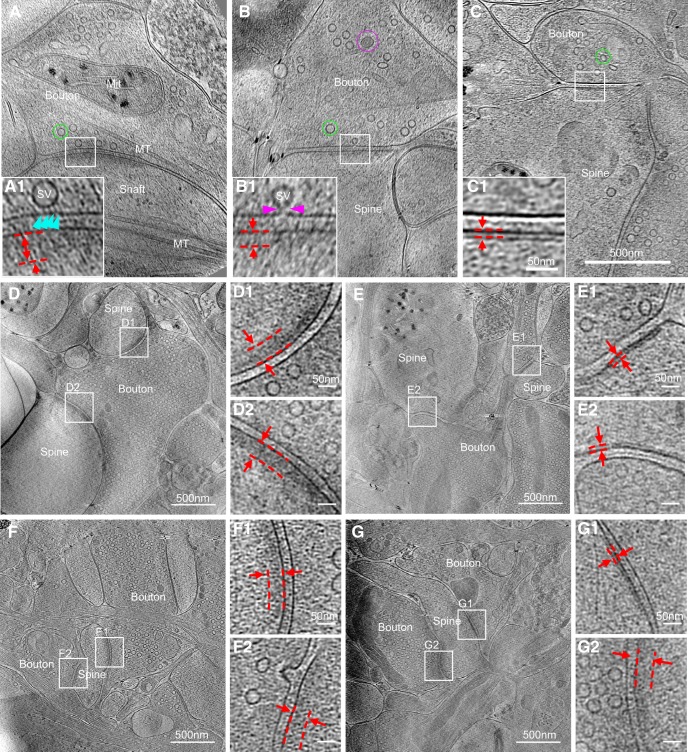
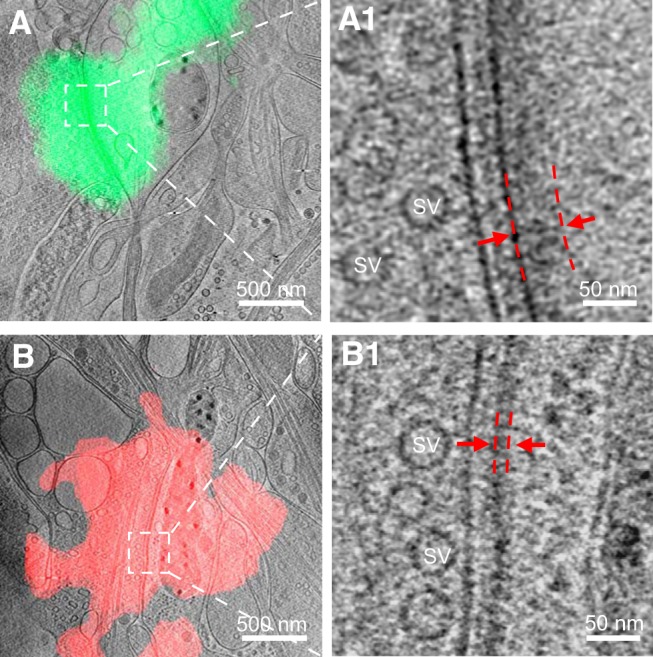
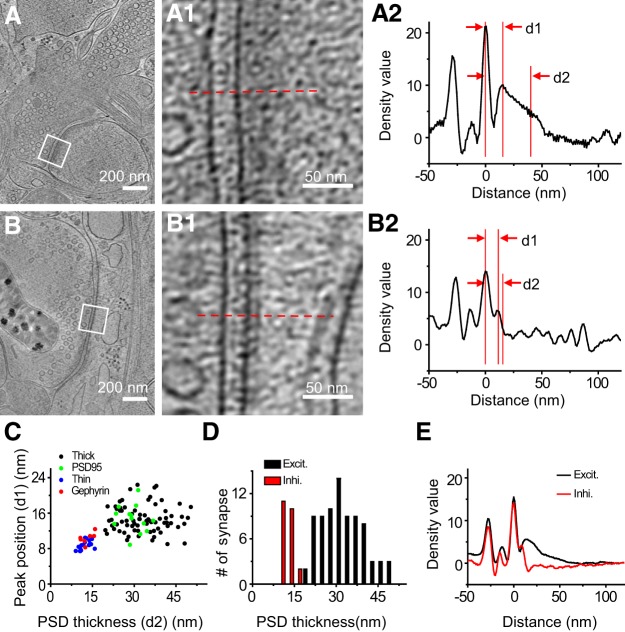
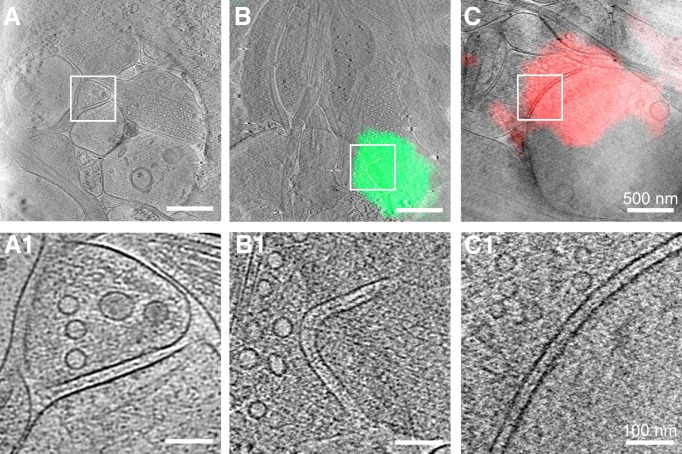
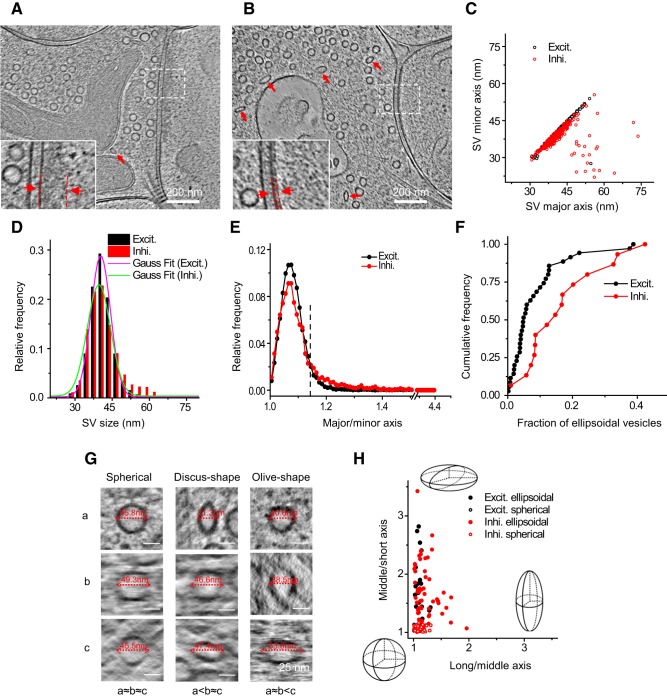
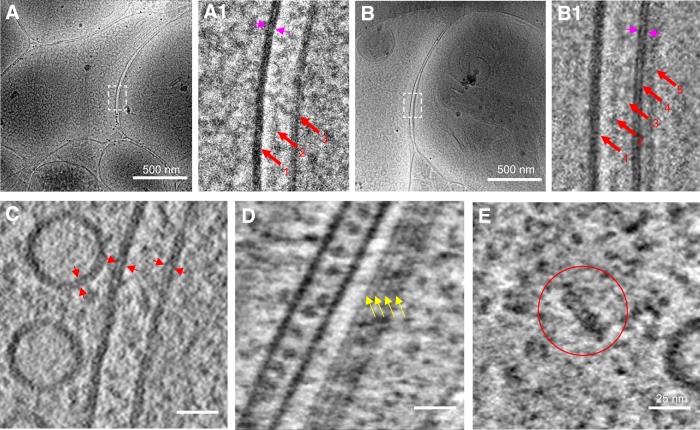
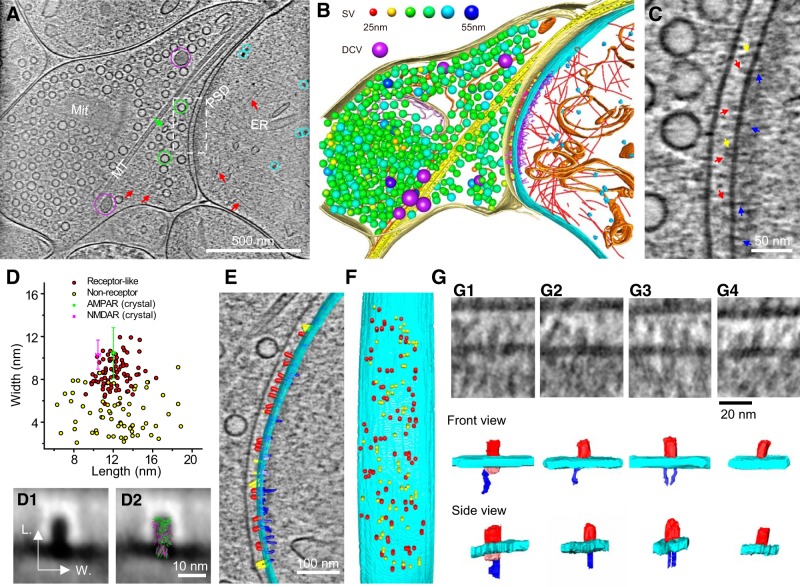
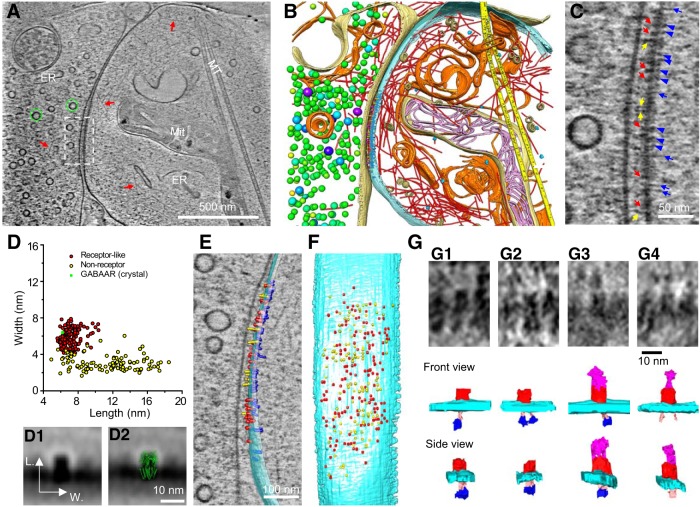
As key functional units in neural circuits, different types of neuronal synapses play distinct roles in brain information processing, learning, and memory. Synaptic abnormalities are believed to underlie various neurological and psychiatric disorders. Here, by combining cryo-electron tomography and cryo-correlative light and electron microscopy, we distinguished intact excitatory and inhibitory synapses of cultured hippocampal neurons, and visualized the in situ 3D organization of synaptic organelles and macromolecules in their native state. Quantitative analyses of >100 synaptic tomograms reveal that excitatory synapses contain a mesh-like postsynaptic density (PSD) with thickness ranging from 20 to 50 nm. In contrast, the PSD in inhibitory synapses assumes a thin sheet-like structure ∼12 nm from the postsynaptic membrane. On the presynaptic side, spherical synaptic vesicles (SVs) of 25-60 nm diameter and discus-shaped ellipsoidal SVs of various sizes coexist in both synaptic types, with more ellipsoidal ones in inhibitory synapses. High-resolution tomograms obtained using a Volta phase plate and electron filtering and counting reveal glutamate receptor-like and GABAA receptor-like structures that interact with putative scaffolding and adhesion molecules, reflecting details of receptor anchoring and PSD organization. These results provide an updated view of the ultrastructure of excitatory and inhibitory synapses, and demonstrate the potential of our approach to gain insight into the organizational principles of cellular architecture underlying distinct synaptic functions.SIGNIFICANCE STATEMENT To understand functional properties of neuronal synapses, it is desirable to analyze their structure at molecular resolution. We have developed an integrative approach combining cryo-electron tomography and correlative fluorescence microscopy to visualize 3D ultrastructural features of intact excitatory and inhibitory synapses in their native state. Our approach shows that inhibitory synapses contain uniform thin sheet-like postsynaptic densities (PSDs), while excitatory synapses contain previously known mesh-like PSDs. We discovered "discus-shaped" ellipsoidal synaptic vesicles, and their distributions along with regular spherical vesicles in synaptic types are characterized. High-resolution tomograms further allowed identification of putative neurotransmitter receptors and their heterogeneous interaction with synaptic scaffolding proteins. The specificity and resolution of our approach enables precise in situ analysis of ultrastructural organization underlying distinct synaptic functions.

Keywords: correlative light and electron microscopy; cryo-electron tomography; neurotransmitter receptor; postsynaptic density; synaptic ultrastructure; synaptic vesicle.


Figures

Figure 1.
Figure 1.
Imaging primary rat hippocampal neurons with cryo-ET/cryo-CLEM. A, Illustration of the workflow of cryo-ET/cryo-CLEM imaging of neurons grown on gold EM grids. B, Representative results from different stages of the workflow. B1, LM image of cultured neurons (red arrows indicate cell bodies). B2, Cryo-EM image of neuronal processes in one grid square. B3, A single cryo-EM projection image of the boxed area in B2 showing a synapse-like structure with a presynaptic bouton (Bouton) containing a dense population of SVs (green circles), a postsynaptic spine (Spine), and a relatively uniform cleft (yellow arrow). Inset shows a zoomed-in view of the synaptic bouton area with a dense population of SVs. B4, A tomographic slice showing fine structure of the same synapse in B3, which was identified as a spine synapse by following through the tomogram in 3D, with mitochondrion (Mit), microtubules (MT), and SVs (green circles) and superposed with segmented presynaptic membrane (green) and postsynaptic membrane (red). Inset shows a zoomed-in view of the synaptic cleft area with transcleft structures. C, Schematics depicting main components of cryo-fluorescence light microscope with an EM cryo-holder. D, Pipeline of imaging synapse with cryo-CLEM. D1, Merged cryo-fluorescence and cryo-bright-field light images. D2, Low-magnification cryo-EM image including the same grid square. D3, Merged images of boxed area in D1 and D2 after fine alignment. D4, Tomographic slice of the boxed area in D3 superimposed with aligned fluorescence image showing the structure of a synapse with a green fluorescent punctum.
Figure 2.
Figure 2.
Synapses of various sizes, shapes, and ultrastructural details imaged with cryo-ET. A–C, Three tomographic slices showing structures of different synapses. In the synapses, structures, such as SVs and dense core vesicle in presynaptic boutons (Bouton), microtubules (MT) in boutons and dendritic shaft (Shaft), mitochondria (Mit) in presynaptic bouton and postsynaptic spine (Spine), are clearly visible. A1–C1, Zoomed-in views of corresponding boxed areas from A–C showing thick (A1, B1, dashed parallel lines) and thin (C1, dashed parallel lines) PSDs, as well as SVs attached (A1, cyan arrowhead) or fused (B1, pink arrowheads) to the presynaptic membrane. D, E, Two synapses sharing the same presynaptic axon (determined by following through their tomograms in 3D), both with thick PSDs (D1 and D2) or both with thin PSDs (E1 and E2), respectively. F, G, Two synapses sharing the same postsynaptic spine, both with thick PSDs (F1 and F2), or one with thin PSD (G1) and the other with thick PSD (G2).
Figure 3.
Figure 3.
Identification of excitatory and inhibitory synapses with cryo-CLEM. A, B, Tomographic slices of an excitatory (A) and inhibitory (B) synapse colocalized with PSD-95-EGFP and mCherry-gephyrin puncta, respectively. A1, B1, Zoomed-in views of the boxed area in A and B showing the synapse with thick and thin PSD, respectively. Red dashed lines indicate the range of the PSD.
Figure 4.
Figure 4.
Quantitative and statistical characterization of excitatory and inhibitory PSDs. A, B, Tomographic slices of two synapses with thick and thin PSD respectively. A1, B1, Zoomed-in views of the marked areas in A and B. A2, B2, Normalized density profiles of the two synapses in A and B respectively with cross-sectional mean density plotted against distance to postsynaptic membrane (see Materials and Methods). On the x-axis of this plot, 0 was set to be the position of the postsynaptic membrane, and positive values are on the postsynaptic side. The density profiles were normalized against the density values at distances ranging from 100 to 200 nm such that the average density value in this range is zero and their SD is unity. d1, PSD peak position; d2 is the sum of d1 and the length constant obtained from the exponential fit of the profile from d1 to the flattened background, to provide a measure of the thickness of the PSD (see Materials and Methods). C, Scatter plot of PSD peak position and PSD thickness of all synapses show two well defined clusters. D, Histogram shows the PSD thickness distribution of all excitatory and inhibitory synapses respectively. E, Averaged density curve of all excitatory synapses and all inhibitory synapses respectively.
Figure 5.
Figure 5.
Synapses without visible PSDs. A, A 15-nm-thick tomographic slice of an unidentified synapse imaged by cryo-ET only. B, C, A 15-nm-thick tomographic slice of an excitatory (B) and an inhibitory (C) synapse identified by cryo-CLEM superposed with the fluorescence image of colocalized PSD-95-EGFP and mCherry-gephyrin, respectively. A1–C1, Zoomed-in views of the boxed area in A–C respectively showing that no PSD structures are visible in these synapses.
Figure 6.
Figure 6.
Heterogeneity of synaptic vesicles in excitatory and inhibitory synapses. A, B, Tomographic slices of an excitatory and an inhibitory synapse respectively. Insets are zoomed-in views showing thick and thin PSDs from A and B respectively. C, Scatter plot showing the major and minor axes of SVs in the two synapses in A and B measured by 2D fitting. D, Distribution of vesicle sizes in excitatory and inhibitory synapses (16,476 vesicles in 35 excitatory synapses and 4766 vesicles in 15 inhibitory synapses). E, Distribution of ellipticity of SVs (major to minor axis ratio) in excitatory and inhibitory synapses. A threshold (dashed line) was set at major/minor = 1.14, which is approximately twice the peak position (major/minor = 1.07) from perfect circle (major/minor = 1) to separate ellipsoidal from spherical vesicles. Coincidentally, this threshold is also close to the cross point of the two distribution curves. F, Cumulative frequency of the fraction of ellipsoidal vesicles in excitatory and inhibitory synapses. G, Tomographic slices of spherical (left column), discus-shaped (i.e., oblate spheroid, middle column), and olive-shaped (i.e., prolate spheroid, right column) SVs viewed in three orthogonal planes rotated so that each of the three principle axes (a–c) of the vesicles can be measured horizontally in the corresponding plane. For the spherical vesicles, a≈b≈c; for discus-shaped ones, a<b≈c; for olive-shaped ones, a≈b<c. H, Long to middle axis ratio versus middle to short axis ratio of 70 ellipsoidal SVs and 70 adjacent spherical SVs in five excitatory and five inhibitory synapses. Schemes depict the shapes at the given positions in the plot.
Figure 7.
Figure 7.
High-resolution cryo-ET of synapses obtained using VPP, electron energy filter, and direct electron detection. A, B, Single-projection cryo-EM images of an excitatory and inhibitory synapse respectively. A1, Zoomed-in view of the white boxed area in A showing three bands of increased density (red arrows) at the junctional area: presynaptic membrane, intercleft band, and postsynaptic membrane. The two leaflets of membrane bilayer can be distinguished (paired magenta arrows). B1, Zoomed-in view of the white boxed area in B showing five density bands (red arrows) at the junction: presynaptic membrane, two intercleft bands, postsynaptic membrane, and postsynaptic density. Two leaflets of membrane bilayer can also be distinguished (paired magenta arrows). C, Two leaflets of membrane bilayer (paired arrowheads) at SVs and synaptic membrane were evident in the reconstructed tomographic slice. D, E, Tomographic slices showing macromolecular structures, such as microtubule protofilaments (D, yellow arrows) and proteasome-like particle (E, red circle) in different synapses.
Figure 8.
Figure 8.
Putative receptors and scaffolding proteins in an excitatory synapse. A, An 8.7-nm-thick tomographic slice of an excitatory synapse. Circles: SVs (green), DCVs (purple), ribosome-like structures (cyan); arrows: ellipsoidal vesicle (green), putative actin filaments (red). ER, Endoplasmic reticulum; Mit, mitochondria; MT, microtubule. B, 3D segmented structures of the whole tomogram (∼300 nm thickness) of the same synapse shown in A rendered as surfaces, colored as follows: outer-Mit, gold; inner-Mit, light pink; MT, yellow; ER, orange; ribosomes, cyan; actin filaments, red; presynaptic membrane, light yellow; postsynaptic membrane, cyan; presynaptic putative adhesion molecules, magenta; postsynaptic putative adhesion molecules, yellow; putative glutamate receptors, red; PSD filaments attached to the postsynaptic membrane, blue; PSD filaments away from the postsynaptic membrane, purple. Except for DCVs (purple), the size of SVs was color-coded (top). The same code also applies to Figure 9 and Movies 2–5. C, Zoomed-in view of the dashed-box area in A with arrows pointing to putative proteins on the postsynaptic membrane: glutamate receptors, red; other cleft structures, yellow; PSD filaments, blue. D, Scatter plot of length and width dimensions of the particles on the postsynaptic membrane at the synaptic cleft side. Red dots are putative glutamate receptors, and yellow dots are putative nonreceptor structures identified by visual inspection. The sizes of putative receptors (length: 12.1 ± 1.4 nm; width: 8.6 ± 1.4 nm, n = 81) are similar to that of extracellular domains of the crystal structures of AMPAR (green; length: 12.0 ± 0.2 nm; width: 10.5 ± 2.4 nm) and NMDAR (magenta; length: 10.5 ± 0.2 nm; width: 10.3 ± 1.4 nm; see detailed calculation of averaged dimensions in Materials and Methods). D1, Averaged 2D image of all particles in the red cluster in D. D2, D1 with AMPAR (green) and NMDAR (magenta) superposed. E, F, Segmented structures on the postsynaptic membrane either superposed on a 1.54-nm-thick (gray) tomographic slice (E) or 90°-rotated (F) to reveal their deposition on the postsynaptic membrane (cyan). Structures were colored as follows: putative glutamate receptors, red; putative nonreceptor structures on the cleft side, yellow; putative scaffolding proteins on the cytoplasmic side, blue. G, Four types of glutamate receptor-like particles with their interactions on the cytoplasmic side. G1, NMDAR-like structure (extracellular domain: red) had a ∼10 nm globular cytoplasmic domain (pink), which linked to one filamentous structure (blue). G2, G3, AMPAR-like structures (extracellular domain; red) linked to one and two filamentous structures (blue). G4, AMPAR-like structure with no associated filamentous structure. The postsynaptic membrane in all four panels is shown in cyan.
Figure 9.
Figure 9.
Putative receptors and scaffolding proteins in an inhibitory synapse. A, An 8.7-nm-thick tomographic slice of an inhibitory synapse. Green circles, SVs; red arrows, actin filaments; ER, endoplasmic reticulum; Mit, mitochondria; MT, microtubule. B, 3D segmented structures of the whole tomogram (∼370 nm thickness) of the same synapse shown in A rendered as surface, colored the same as the labels in Fig. 8B except for postsynaptic vesicles (beige). C, Zoomed-in view of the dashed-box area in A with arrows and arrowheads pointing to particles attached to the postsynaptic membrane. Putative receptors, Red arrows; putative adhesion molecules, yellow arrows; short PSD particles, blue arrowheads; and long PSD particles, blue arrows. D, Scatter plot of length and width dimensions of the structures on the postsynaptic membrane at the synaptic cleft side. Red dots are putative GABAARs, and yellow dots are putative nonreceptor structures identified by visual inspection. The mean sizes of putative receptors (length: 7.1 ± 0.9 nm; width: 5.9 ± 0.9 nm, n = 143) are close to those of the extracellular domain of the crystal structures of GABAARs (green; length: 6.2 ± 0.1 nm; width: 6.4 ± 0.1 nm; see detailed calculation of averaged dimensions in Materials and Methods). D1, Averaged 2D image of all particles in the red cluster in D. D2, D1 with GABAAR (green) superposed. E, F, Segmented structures on the postsynaptic membrane either superposed on a 1.54-nm-thick (gray) tomographic slice (E) or 90° rotated (F) to reveal their position on the postsynaptic membrane (cyan). Putative GABAAR, Red; putative nonreceptor structures in the cleft, yellow; putative scaffolding proteins, blue. G, Typical GABAAR-like structures and their interactions at cytoplasmic and cleft side. GABAAR-like structures (extracellular domain: red) each linked to one or two hammer-like structures, which had a dense “head” (blue) and a thin “neck” (pink), at cytoplasmic side (G1–G3). Some of GABAAR-like structures only linked to two “necks” (G4). Additionally, some of GABAAR-like structures were connected to putative adhesion molecules (magenta) in the extracellular side (G3, G4).

References

    1. Asano S, Fukuda Y, Beck F, Aufderheide A, Förster F, Danev R, Baumeister W (2015) Proteasomes. A molecular census of 26S proteasomes in intact neurons. Science 347:439–442. 10.1126/science.1261197 - DOI - PubMed
    1. Bi GQ, Poo MM (1998) Synaptic modifications in cultured hippocampal neurons: dependence on spike timing, synaptic strength, and postsynaptic cell type. J Neurosci 18:10464–10472. - PMC - PubMed
    1. Bi G, Poo M (2001) Synaptic modification by correlated activity: Hebb's postulate revisited. Annu Rev Neurosci 24:139–166. 10.1146/annurev.neuro.24.1.139 - DOI - PubMed
    1. Bourne JN, Chirillo MA, Harris KM (2013) Presynaptic ultrastructural plasticity along CA3→CA1 axons during long-term potentiation in mature hippocampus. J Comp Neurol 521:3898–3912. 10.1002/cne.23384 - DOI - PMC - PubMed
    1. Brandt F, Carlson LA, Hartl FU, Baumeister W, Grünewald K (2010) The three-dimensional organization of polyribosomes in intact human cells. Mol Cell 39:560–569. 10.1016/j.molcel.2010.08.003 - DOI - PubMed

Publication types

MeSH terms