. 2018 Apr;67(4):745-754.
doi: 10.2337/db17-0996. Epub 2018 Jan 8.

Sirt1: A Guardian of the Development of Diabetic Retinopathy

Affiliations

Sirt1: A Guardian of the Development of Diabetic Retinopathy

Manish Mishra et al. Diabetes. 2018 Apr.

Abstract

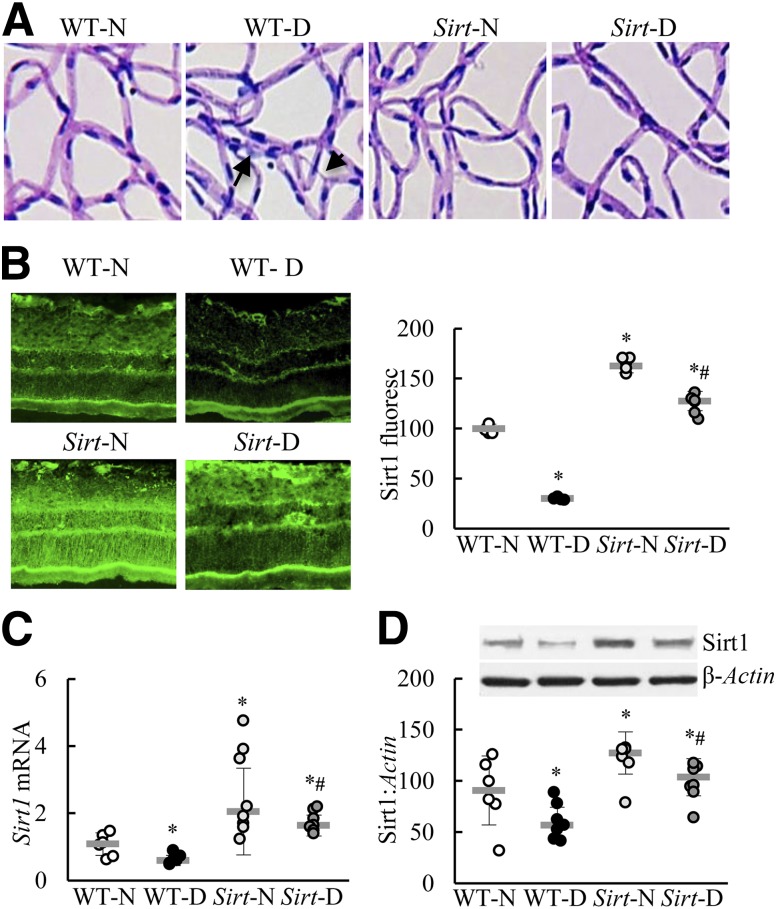
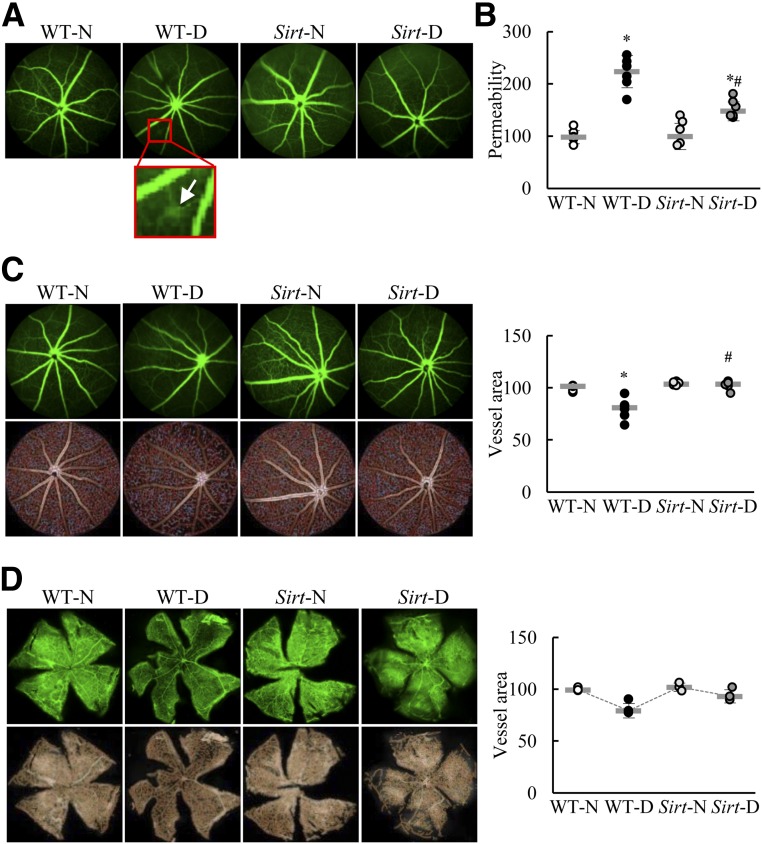
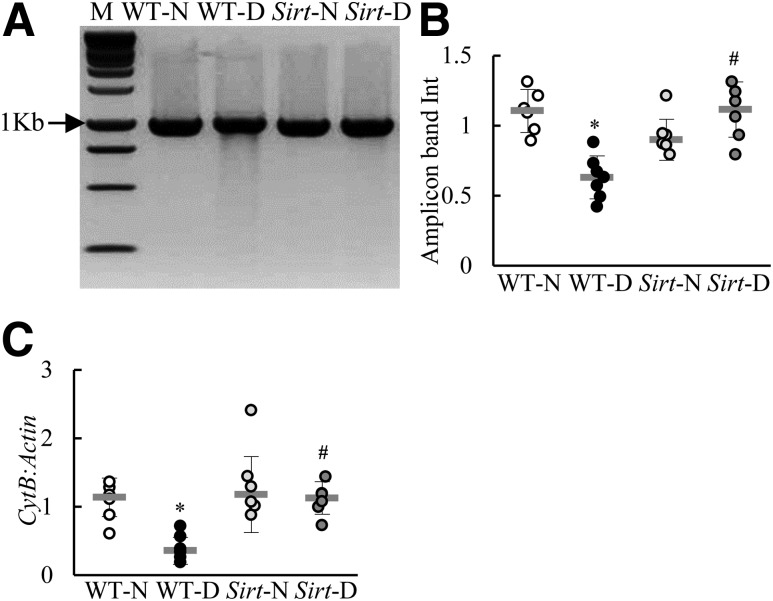
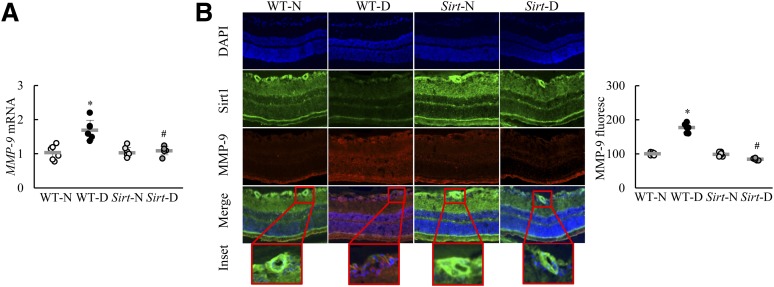
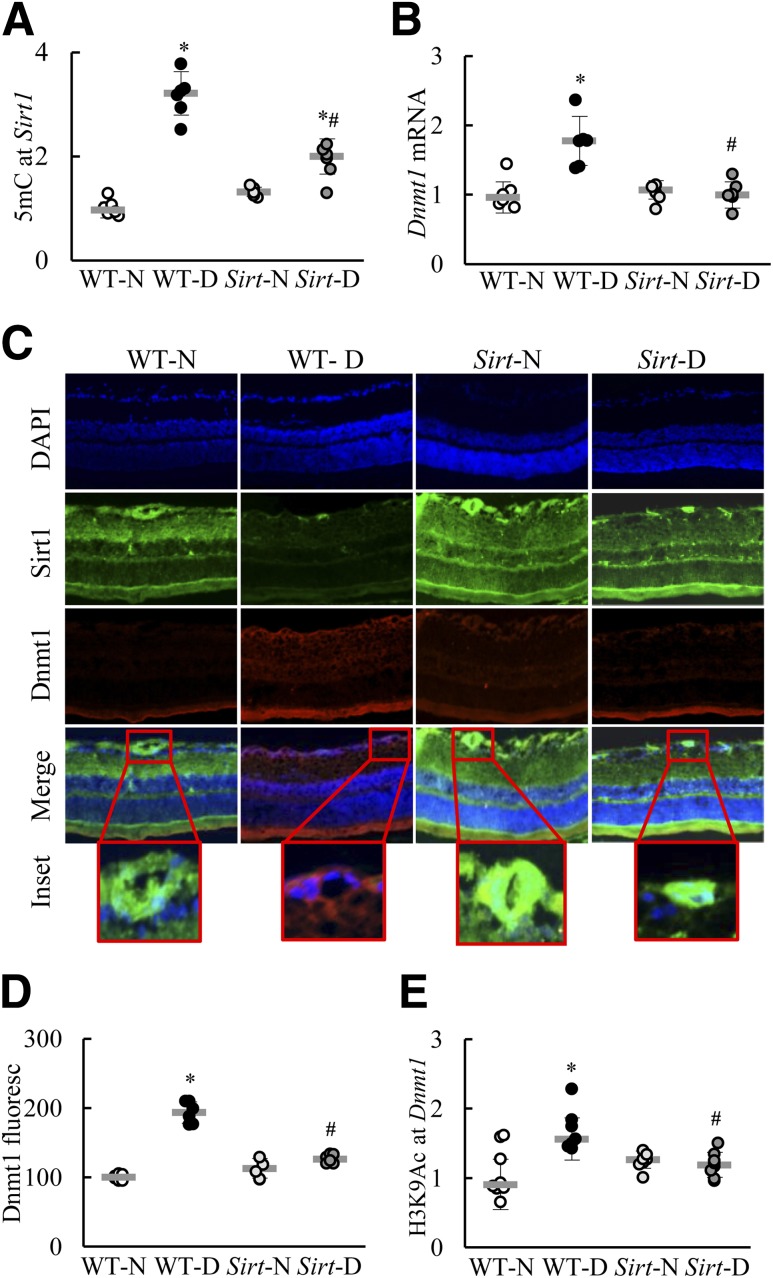
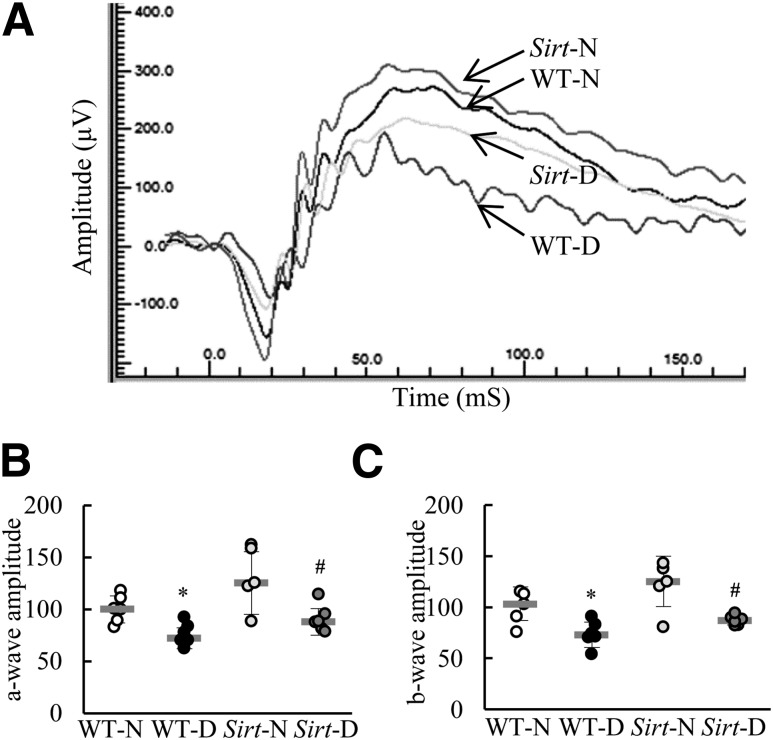
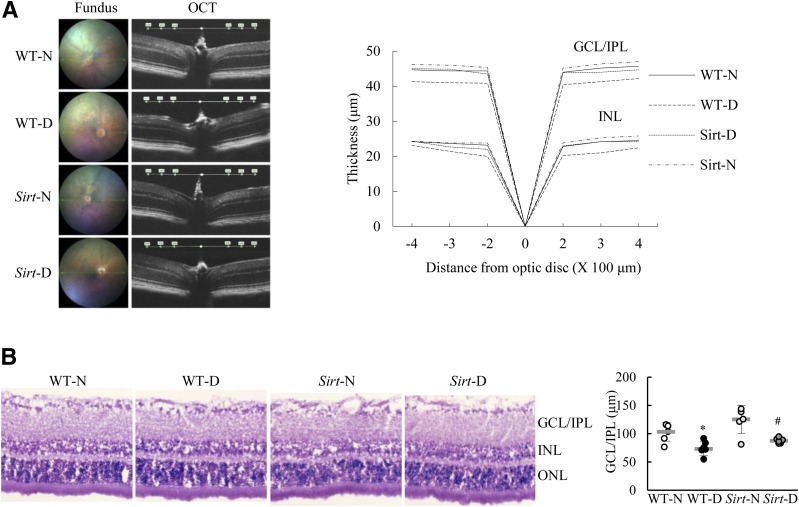
Diabetic retinopathy is a multifactorial disease, and the exact mechanism of its pathogenesis remains obscure. Sirtuin 1 (Sirt1), a multifunctional deacetylase, is implicated in the regulation of many cellular functions and in gene transcription, and retinal Sirt1 is inhibited in diabetes. Our aim was to determine the role of Sirt1 in the development of diabetic retinopathy and to elucidate the molecular mechanism of its downregulation. Using Sirt1-overexpressing mice that were diabetic for 8 months, structural, functional, and metabolic abnormalities were investigated in vascular and neuronal retina. The role of epigenetics in Sirt1 transcriptional suppression was investigated in retinal microvessels. Compared with diabetic wild-type mice, retinal vasculature from diabetic Sirt1 mice did not present any increase in the number of apoptotic cells or degenerative capillaries or decrease in vascular density. Diabetic Sirt1 mice were also protected from mitochondrial damage and had normal electroretinography responses and ganglion cell layer thickness. Diabetic wild-type mice had hypermethylated Sirt1 promoter DNA, which was alleviated in diabetic Sirt1 mice, suggesting a role for epigenetics in its transcriptional suppression. Thus strategies targeted to ameliorate Sirt1 inhibition have the potential to maintain retinal vascular and neuronal homeostasis, providing opportunities to retard the development of diabetic retinopathy in its early stages.


Figures

Figure 1
Figure 1
Effect of Sirt1 overexpression on retinal capillary cell damage in diabetes. Trypsin-digested retinal microvessels from C57BL/6J WT and Sirt1-overexpressing mice, which had diabetes for ∼8 months, were stained with TUNEL. TUNEL-positive cells were counted throughout the entire retinal vasculature. The microvasculature was then stained with periodic acid Schiff–hematoxylin, providing representative microvasculature (A). The arrowhead indicates an acellular capillary, and the arrow points to a pericyte ghost. B: Sirt1 expression was quantified in the retinal cryosections by immunofluorescence (fluoresc) staining using DyLight 488–labeled (green) secondary antibodies. Retinal microvessels prepared with the hypotonic shock method were analyzed for Sirt1 gene expression by SYBR green–based quantitative PCR (C) and protein expression by Western blotting (D). Values are presented as the mean ± SD (n = 5–7 mice/group). *P < 0.05 compared with age-matched WT-N; #P < 0.05 compared with WT-D. Sirt-D, diabetic Sirt1-overexpressing mice; Sirt-N, normal Sirt1-overexpressing mice; WT-D, diabetic WT C57BL/6J mice; WT-N, normal WT C57BL/6J mice.
Figure 2
Figure 2
Effect of Sirt1 overexpression on vascular leakage and capillary density. A: Fluorescein angiography was performed using a Micron IV Retinal Imaging Microscope containing a barrier filter. The images show representative angiograms from mice in each group; the arrow in the inset indicates vascular leakage. B: Tail vein–injected Evans blue dye in the retinal extract was quantified spectrophotometrically at 620 nm. C and D: Vascular density was determined in fluorescein angiograms (C) and by isolectin staining of retinal flatmounts using fluorescein isothiocyanate–conjugated Isolectin B4 under a confocal microscope (D). The grayscale images, converted using AngioTool software, were analyzed, and the accompanying graph represents vessel area. The values obtained from normal WT mice are considered 100%. Each group had five or six mice. *P < 0.05 compared with normal WT C57BL/6J mice (WT-N); #P < 0.05 compared with diabetic WT C57BL/6J mice (WT-D). Sirt-D, diabetic Sirt1-overexpressing mice; Sirt-N, normal Sirt1-overexpressing mice.
Figure 3
Figure 3
Effect of Sirt1 upregulation on mtDNA damage and biogenesis. A: Retinal microvessels were analyzed for DNA damage by measuring sequence variants in the amplified D-Loop region using a mismatch-specific surveyor endonuclease, followed by analysis on a 2% agarose gel. B: The parent band amplicon intensity was quantified; the intensity of the amplicons from normal WT C57BL/6J mice (WT-N) was considered 100%. C: Mitochondrial copy numbers were quantified in the total DNA isolated from retinal microvessels by quantitative PCR, using CytB as an mtDNA marker and β-Actin as a nuclear DNA marker. The results are representative of five or six microvessel preparations per group. *P < 0.05 compared with WT-N; #P < 0.05 compared with diabetic WT C57BL/6J mice (WT-D). M, marker; Sirt-D, diabetic Sirt1-overexpressing mice; Sirt-N, normal Sirt1-overexpressing mice.
Figure 4
Figure 4
Effect of Sirt1 overexpression on diabetes-induced retinal MMP-9. A: The MMP-9 gene transcript was quantified in retinal microvasculature by SYBR green–based quantitative PCR using 18S as the housekeeping gene. Values are the mean ± SD of four to six samples per group. B: Expression of MMP-9 in retinal cryosections was evaluated with immunofluorescence (fluoresc) using DyLight 488–conjugated (green) and Texas Red–conjugated (red) secondary antibodies for Sirt1 and MMP-9, respectively; cells were mounted in DAPI mounting medium (blue). The insets show magnified areas. Values are mean ± SD (4–6 samples/group). *P < 0.05 compared with normal WT C57BL/6J mice (WT-N); #P < 0.05 compared with diabetic WT C57BL/6J mice (WT-D). Sirt-D, diabetic Sirt1-overexpressing mice; Sirt-N, normal Sirt1-overexpressing mice.
Figure 5
Figure 5
DNA methylation of retinal Sirt1. Retinal microvessels were used to quantify 5mC levels using the methylated DNA immunoprecipitation technique (A) and Dnmt1 gene transcripts through quantitative PCR (B), using 18S as the housekeeping gene. C: Dnmt1 expression in the cryosections was determined by immunofluorescence using secondary antibodies conjugated with DyLight 488 (green) for Sirt1 and with Texas Red for Dnmt1. DAPI mounting medium (blue) was used to mount the sections. D: The graph shows the mean fluorescence intensity (fluoresc) of Dnmt1. E: Acetylated H3K9 levels at the Dnmt1 promoter in retinal microvessels were quantified by immunoprecipitating genomic DNA with H3K9Ac antibody, followed by quantitative PCR using primers for the Dnmt1 promoter. Values are presented as the mean ± SD of four to six retinal microvessel preparations per group. *P < 0.05 vs. normal WT C57BL/6J mice (WT-N); #P < 0.05 vs. diabetic WT C57BL/6J mice (WT-D). Sirt-D, diabetic Sirt1-overexpressing mice; Sirt-N, normal Sirt1-overexpressing mice.
Figure 6
Figure 6
Effect of Sirt1 on retinal neuronal function. ERG was performed in dark-adapted mice using the OcuScience HMsERG Lab System. The electrical response was recorded using a series of Ganzfeld flashes with intensities ranging from 100 to 25,000 mcds/m2. A: A representative ERG response at 1,000 mcds/m2 from one mouse in each group. B and C: a-Wave amplitude (B) and b-wave amplitude (C) are presented as the percentage of normal; the values obtained from normal WT C57BL/6J mice (WT-N) were considered to be 100%. *P < 0.05 compared with normal WT C57BL/6J mice (WT-N); #P < 0.05 compared with diabetic WT C57BL/6J mice (WT-D). Sirt-D, diabetic Sirt1-overexpressing mice; Sirt-N, normal Sirt1-overexpressing mice.
Figure 7
Figure 7
Effect of Sirt1 overexpression on retinal layer thickness. A: OCT was performed using an OCT module, customized for retinal imaging of small animals, in the Micron IV Retinal Imaging System. An average high-resolution B-scan of retinal cross sections was obtained by spatially aligning 50 individual B-scans along the same horizontal axis through the optic disc, marked with a green arrow on the fundus images (left). The right panels show representative B-scans from each group; the layer thickness measurement points are marked. The thickness of the GCL + IPL and INL, at 200, 300, and 400 μm on either side of the optic disc, was measured using InSight software. In the graph, negative integers represent measurements on the left side of the optic disc, and positive integers represent those on the right side of the optic disc. B: Retinal cryosections were stained with hematoxylin-eosin, and the thickness of the layers was analyzed at three random places using ImageJ software. *P < 0.05 vs. normal WT C57BL/6J mice; #P < 0.05 vs. diabetic WT C57BL/6J mice. ONL, outer nuclear layer; Sirt-D, diabetic Sirt1-overexpressing mice; Sirt-N, normal Sirt1-overexpressing mice; WT-D, diabetic WT C57BL/6J mice; WT-N, normal WT C57BL/6J mice.

References

    1. Frank RN. Diabetic retinopathy. N Engl J Med 2004;350:48–58 - PubMed
    1. Kowluru RA, Kowluru A, Mishra M, Kumar B. Oxidative stress and epigenetic modifications in the pathogenesis of diabetic retinopathy. Prog Retin Eye Res 2015;48:40–61 - PMC - PubMed
    1. Kowluru RA. Diabetic retinopathy, metabolic memory and epigenetic modifications. Vision Res 2017;139:30–38 - PubMed
    1. Mizutani M, Kern TS, Lorenzi M. Accelerated death of retinal microvascular cells in human and experimental diabetic retinopathy. J Clin Invest 1996;97:2883–2890 - PMC - PubMed
    1. Kern TS, Barber AJ. Retinal ganglion cells in diabetes. J Physiol 2008;586:4401–4408 - PMC - PubMed

Publication types

MeSH terms