

Revised Framingham Stroke Risk Score, Nontraditional Risk Markers, and Incident Stroke in a Multiethnic Cohort
- PMID: 29311270
- PMCID: PMC5780220
- DOI: 10.1161/STROKEAHA.117.018928
Revised Framingham Stroke Risk Score, Nontraditional Risk Markers, and Incident Stroke in a Multiethnic Cohort
Abstract
Background and purpose: Limited data exist on the performance of the revised Framingham Stroke Risk Score (R-FSRS) and the R-FSRS in conjunction with nontraditional risk markers. We compared the R-FSRS, original FSRS, and the Pooled Cohort Equation for stroke prediction and assessed the improvement in discrimination by nontraditional risk markers.
Methods: Six thousand seven hundred twelve of 6814 participants of the MESA (Multi-Ethnic Study of Atherosclerosis) were included. Cox proportional hazard, area under the curve, net reclassification improvement, and integrated discrimination increment analysis were used to assess and compare each stroke prediction risk score. Stroke was defined as fatal/nonfatal strokes (hemorrhagic or ischemic).
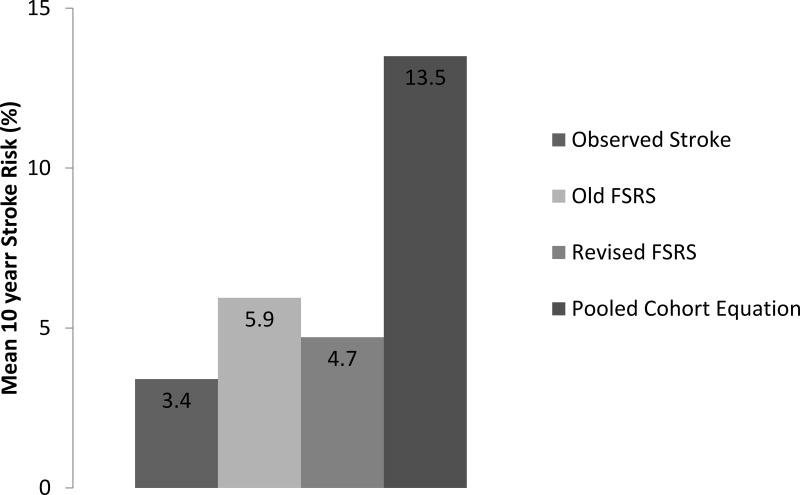
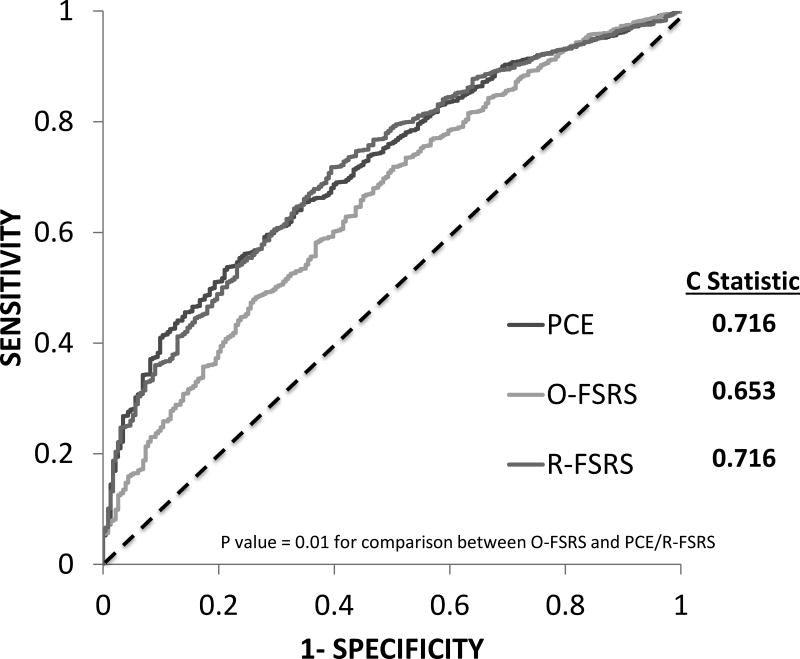
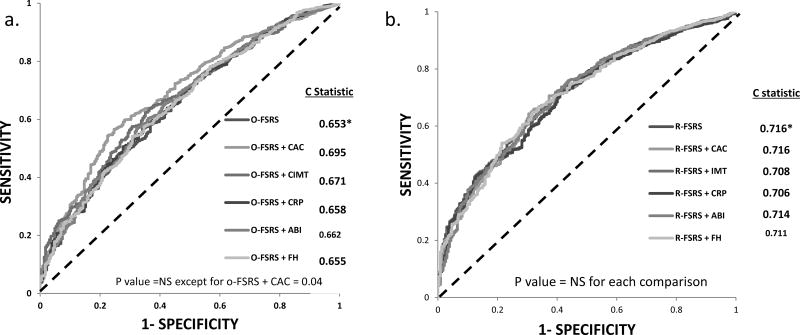
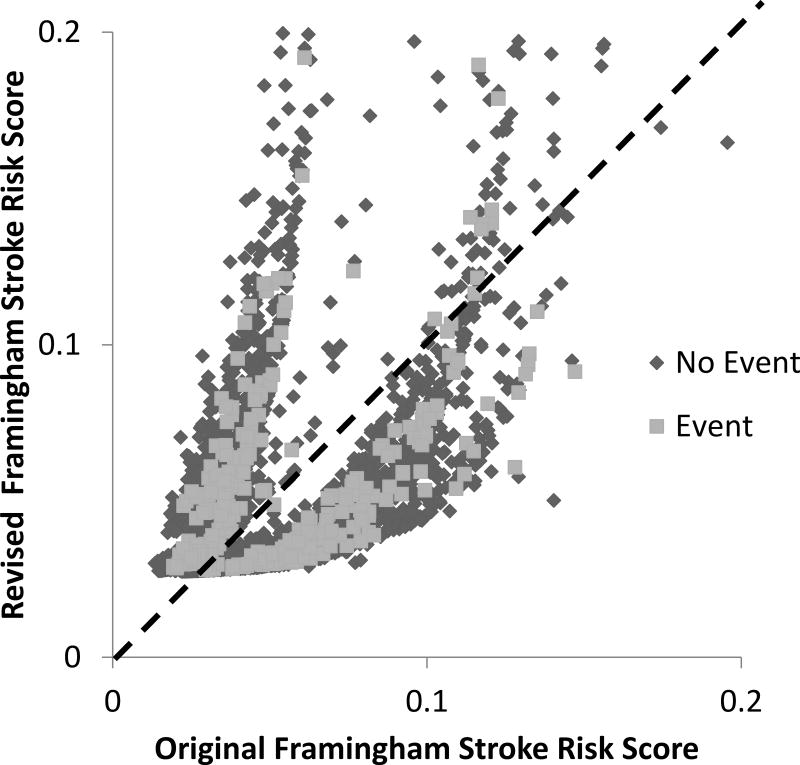
Results: After mean follow-up of 10.7 years, 231 of 6712 (3.4%) strokes were adjudicated (2.7% ischemic strokes). Mean stroke risks using the R-FSRS, original FSRS, and Pooled Cohort Equation were 4.7%, 5.9%, and 13.5%. The R-FSRS had the best calibration (Hosmer-Lemeshow goodness-of-fit, χ2=6.55; P=0.59). All risk scores were predictive of incident stroke. C statistics of R-FSRS (0.716) was similar to Pooled Cohort Equation (0.716), but significantly higher than the original FSRS (0.653; P=0.01 for comparison with R-FSRS). Adding nontraditional risk markers individually to the R-FSRS did not improve discrimination of the R-FSRS in the area under the curve analysis, but did improve category-less net reclassification improvement and integrated discrimination increment for incident stroke. The addition of coronary artery calcium to R-FSRS produced the highest category-less net reclassification improvement (0.36) and integrated discrimination increment (0.0027). Similar results were obtained when ischemic strokes were used as the outcome.
Conclusions: The R-FSRS downgraded stroke risk but had better calibration and discriminative ability for incident stroke compared with the original FSRS. Nontraditional risk markers modestly improved the discriminative ability of the R-FSRS, with coronary artery calcium performing the best.
Keywords: atherosclerosis; epidemiology; risk factors; stroke.
© 2018 American Heart Association, Inc.
Figures
References
-
- Wolf PA, D'Agostino RB, Belanger AJ, Kannel WB. Probability of stroke: a risk profile from the Framingham Study. Stroke; a journal of cerebral circulation. 1991;22:312–8. - PubMed
-
- Manolio TA, Kronmal RA, Burke GL, O'Leary DH, Price TR. Short-term predictors of incident stroke in older adults. The Cardiovascular Health Study. Stroke; a journal of cerebral circulation. 1996;27:1479–86. - PubMed
-
- Chambless LE, Heiss G, Shahar E, Earp MJ, Toole J. Prediction of ischemic stroke risk in the Atherosclerosis Risk in Communities Study. American journal of epidemiology. 2004;160:259–69. - PubMed
Publication types
MeSH terms
Grants and funding
- HHSN268201500003C/HL/NHLBI NIH HHS/United States
- N01 HC095161/HL/NHLBI NIH HHS/United States
- N01 HC095168/HL/NHLBI NIH HHS/United States
- HHSN268200800007C/HL/NHLBI NIH HHS/United States
- N01 HC095167/HL/NHLBI NIH HHS/United States
- N01 HC095159/HL/NHLBI NIH HHS/United States
- N01 HC085079/HL/NHLBI NIH HHS/United States
- N01 HC095163/HL/NHLBI NIH HHS/United States
- UL1 TR000040/TR/NCATS NIH HHS/United States
- N01 HC095166/HL/NHLBI NIH HHS/United States
- N01 HC095162/HL/NHLBI NIH HHS/United States
- UL1 TR001079/TR/NCATS NIH HHS/United States
- N01 HC095169/HL/NHLBI NIH HHS/United States
- N01 HC095165/HC/NHLBI NIH HHS/United States
- HHSN268201500003I/HL/NHLBI NIH HHS/United States
- N01 HC095165/HL/NHLBI NIH HHS/United States
- N01 HC095164/HL/NHLBI NIH HHS/United States
- N01 HC095159/HC/NHLBI NIH HHS/United States
- N01 HC095160/HL/NHLBI NIH HHS/United States
LinkOut - more resources
Full Text Sources
Other Literature Sources
Medical
