. 2018 Jan 23;115(4):E762-E771.
doi: 10.1073/pnas.1715865115. Epub 2018 Jan 8.

Faulty neuronal determination and cell polarization are reverted by modulating HD early phenotypes

Affiliations

Faulty neuronal determination and cell polarization are reverted by modulating HD early phenotypes

P Conforti et al. Proc Natl Acad Sci U S A. .

Erratum in

Abstract

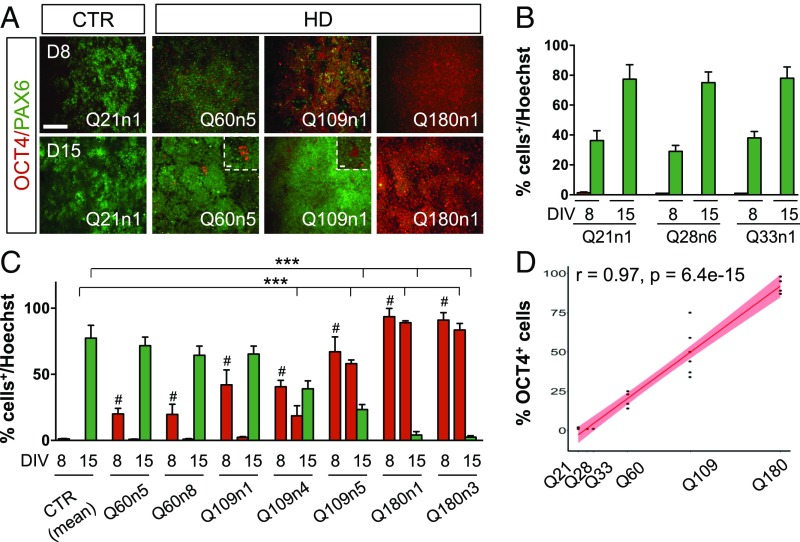
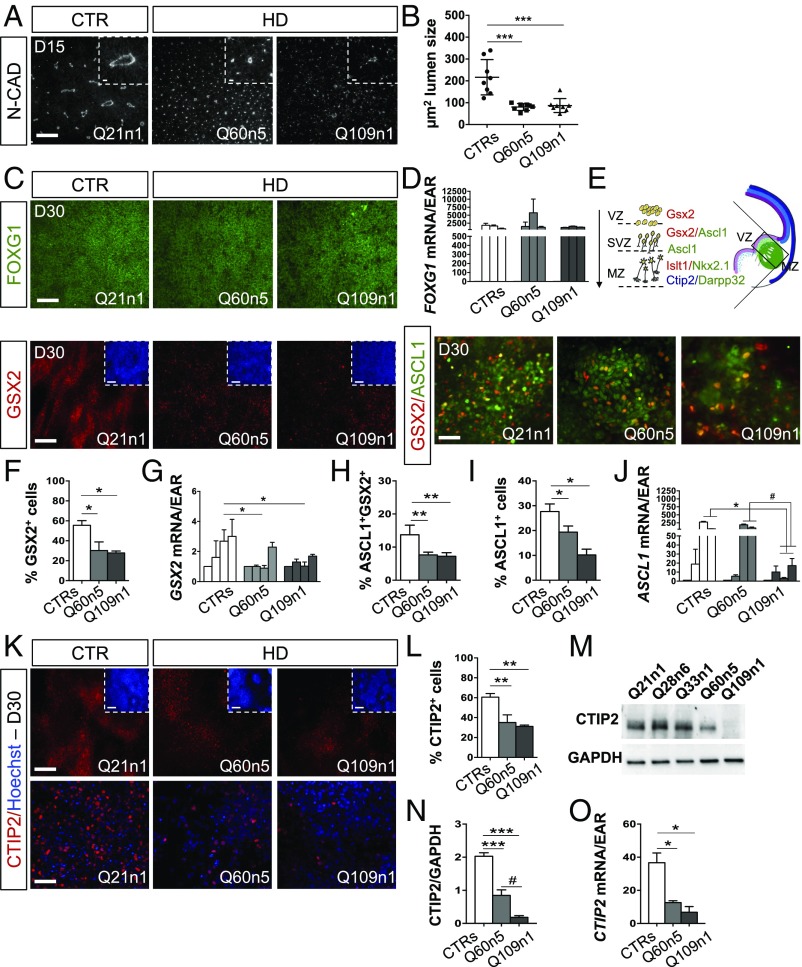
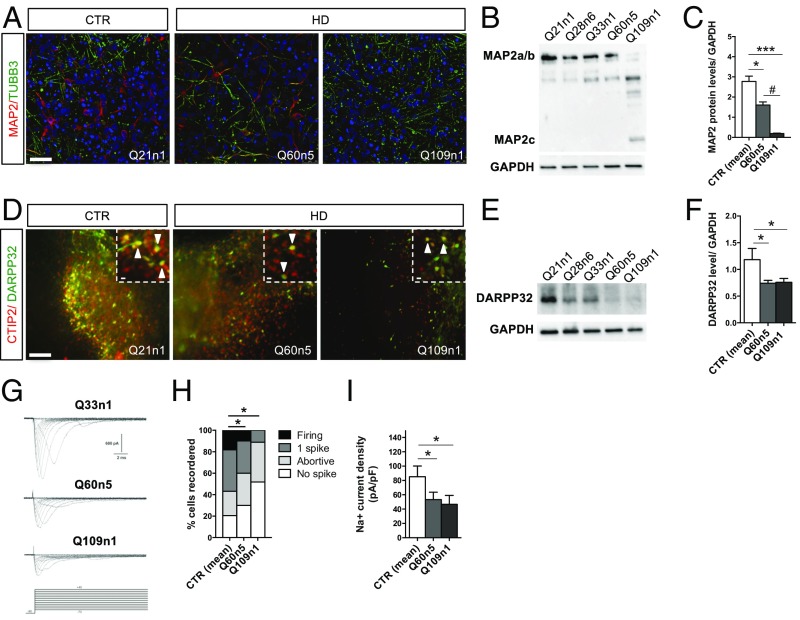
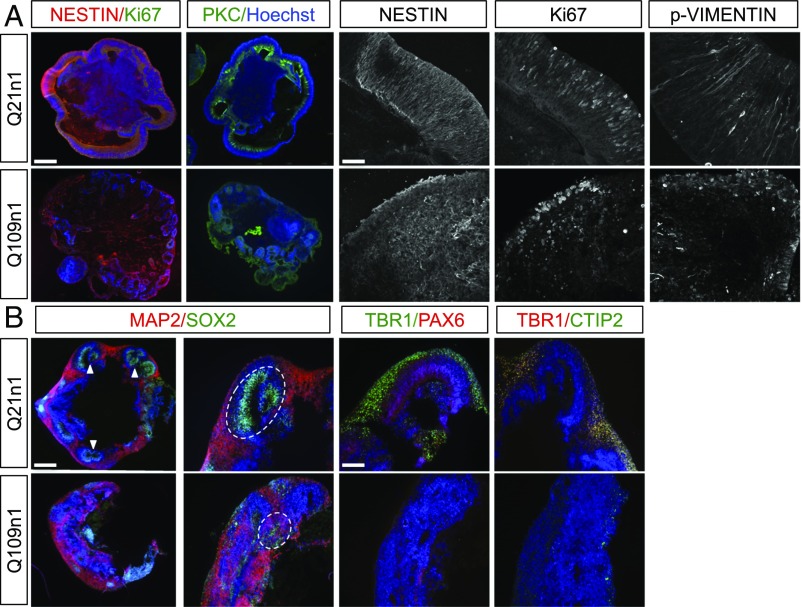
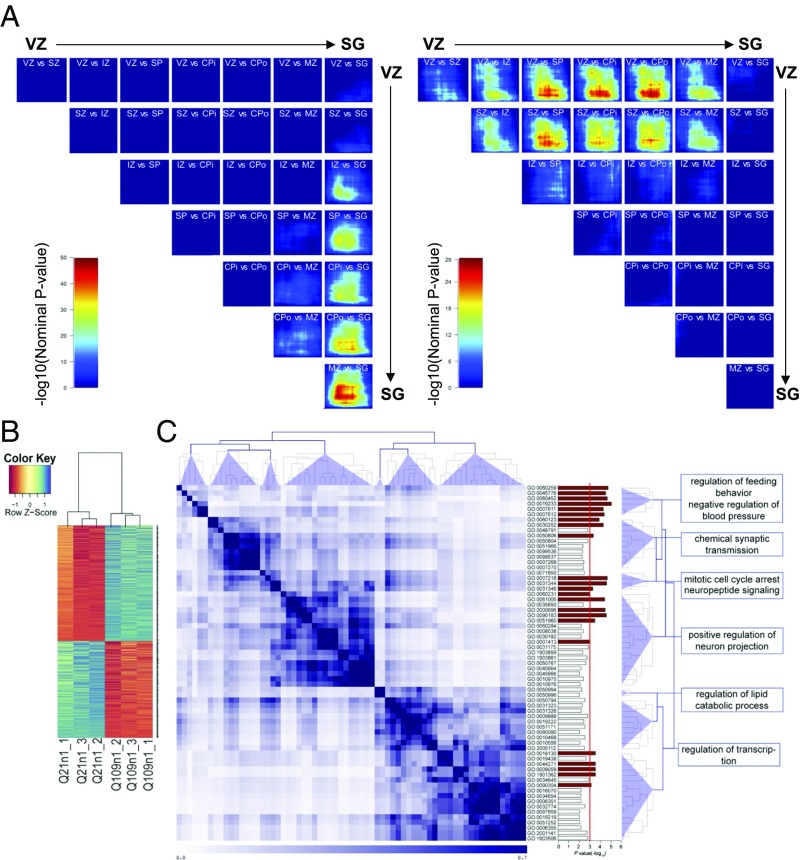
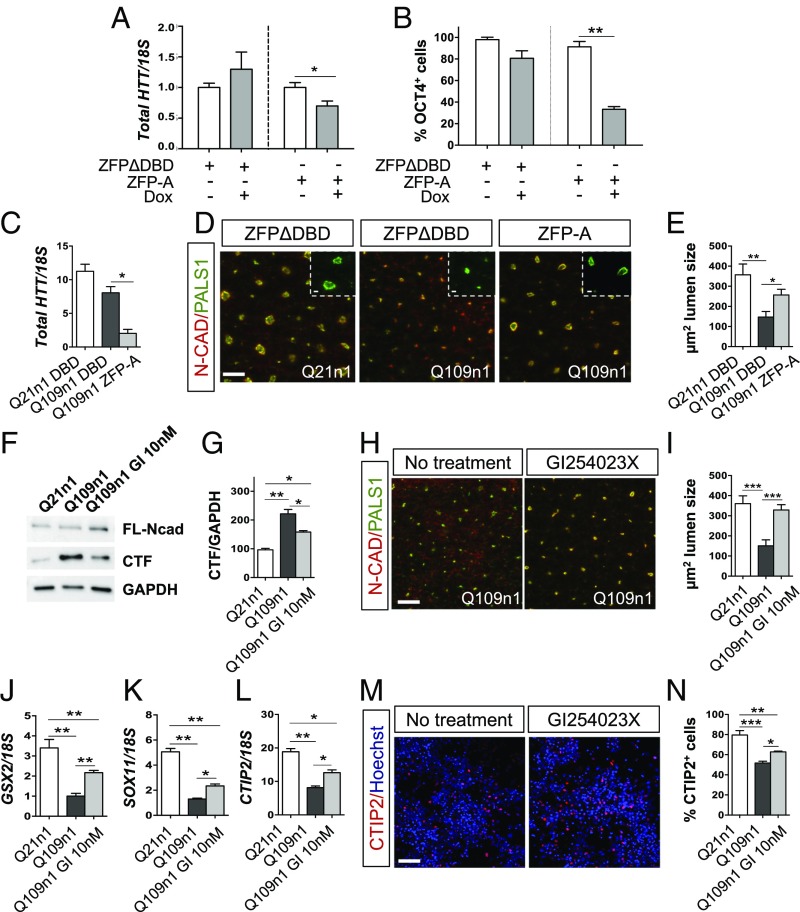
Increasing evidence suggests that early neurodevelopmental defects in Huntington's disease (HD) patients could contribute to the later adult neurodegenerative phenotype. Here, by using HD-derived induced pluripotent stem cell lines, we report that early telencephalic induction and late neural identity are affected in cortical and striatal populations. We show that a large CAG expansion causes complete failure of the neuro-ectodermal acquisition, while cells carrying shorter CAGs repeats show gross abnormalities in neural rosette formation as well as disrupted cytoarchitecture in cortical organoids. Gene-expression analysis showed that control organoid overlapped with mature human fetal cortical areas, while HD organoids correlated with the immature ventricular zone/subventricular zone. We also report that defects in neuroectoderm and rosette formation could be rescued by molecular and pharmacological approaches leading to a recovery of striatal identity. These results show that mutant huntingtin precludes normal neuronal fate acquisition and highlights a possible connection between mutant huntingtin and abnormal neural development in HD.

Keywords: Huntington’s disease; human iPS lines; neurodevelopment; organoids; striatal differentiation.


Conflict of interest statement

The authors declare no conflict of interest.

Figures

Fig. 1.
Fig. 1.
Neural induction analysis in HD and CTR iPSCs following striatal differentiation. (A) Immunocytochemistry for OCT4 and PAX6 at DIV8 and 15 of differentiation in Q21n1 and three HD lines (Q60n5, Q109n1, Q180n1). (Scale bar, 100 μm; Inset, 50 μm.) (B) Counts of OCT4+ (red column) and PAX6+ (green column) cells by the Automatic Nuclei Counter plug (ITCN) ImageJ plugin both at DIV8 and 15. (C) Counts of OCT4+ (red column) cells at DIV 8 and 15 and PAX6+ (green column) cells at DIV 15 by ITCN in CTR and HD lines. (One-way ANOVA, OCT4: #P < 0.01 between HD and CTRs at DIV8, one-way ANOVA; OCT4 and PAX6: ***P < 0.001 between HD and CTRs at DIV15, one-way ANOVA; n = 3 biological experiments, data are represented as mean ± SEM.) (D) Graph of OCT4 and CAG length correlation for all seven HD lines/clones (Q60n5, Q60n8, Q109n1, Q109n4, Q109n5, Q180n1, and Q180n3) (r = 0.97, P = 6.4e-15 calculated using Pearson correlation).
Fig. 2.
Fig. 2.
HD lines show defects in ventral telencephalic identity acquisition. (A) Immunocytochemistry for N-CAD in Q21n1 and in Q60n5 and Q109n1 HD lines at DIV15 of differentiation. [Scale bar, 100 μm; Inset (the N-CAD staining for each image), 50 μm.] (B) Counts of lumen size’s area (μm2) in rosettes from HD and CTRs lines performed by Cell Profiler. (***P < 0.001, one-way ANOVA; n = 3 biological experiments, data are represented as mean ± SEM.) (C) Immunocytochemistry for FOXG1, GSX2, and GSX2/ASCL1 in Q21n1, Q60n5, and Q109n1 after neural induction (DIV30). [FOXG1, GSX2 scale bar: 100 μm; Inset (Hoechst staining for each image), 100 μm; GSX2/ASCL1, 50 μm.] (D) qPCR for FOXG1 in CTRs and Q60n5 and Q109n1 lines at DIV0, 8, 15, and 30 (A.U.). (E) Scheme of cells transitioning during development in the striatal anlage. GSX2+ cells found in the VZ migrate in the SVZ while acquiring identity of progenitors GSX2+/ASCL1+. Their complete maturation in striatal neurons is confirmed by colocalization of CTIP2 and DARPP32. (F) Quantification of GSX2+ cells by the ITCN ImageJ plugin. (CTRs = 55.55 ± 11.36%; Q60n5 = 30.22 ± 15.1%; Q109n1 = 27.8 ± 3.52%; *P < 0.05 one-way ANOVA; n = 3 biological experiments, data are represented as mean ± SEM.) (G) qPCR GSX2 in CTRs, Q60n5, and Q109n1 lines at DIV0, 8, 15, and 30. (A.U., GSX2, CTRs = 2.69 ± 0.76-fold increase at DIV30 vs. DIV0 vs. 0.9 ± 0.17 and 1.03 ± 0.28 in Q60n5 and Q109n1 fold-increase, respectively; *P < 0.05, one-way ANOVA; n = 3 biological experiments, data are represented as mean ± SEM.) (H and I) Quantification of ASCL1+/GSX2+ (H) and ASCL1+ (I) cells by the ITCN ImageJ plugin. (ASCL1+/GSX2+: CTRs = 13.7% ± 2.9; Q60n5 = 7.63 ± 0.85; Q109n1 = 7.23 ± 1.08; **P < 0.01 one-way ANOVA; ASCL1+: CTRs = 27.67 ± 3.05%; Q60n5 = 19.3 ± 2.52%; Q109n1 = 9.5 ± 1.80%; *P < 0.05 one-way ANOVA; n = 3 biological experiments, data are represented as mean ± SEM.) (J) qPCR for ASCL1 in CTRs and Q60n5 and Q109n1 lines at DIV0, 8, 15, and 30. (A.U., ASCL1 DIV 15: CTRs = 275 ± 32.53-fold induction vs. 186.5 ± 37.47 and 2.93 ± 1.58 in Q60n5 and Q109n1 fold-increase, respectively; DIV30 CTRs = 60.5 ± 4.95 vs. 68.4 ± 4.4 and 17.24 ± 10.98 in Q60n5 and Q109n1 fold-increase, respectively; *P < 0.05 one-way ANOVA; n = 3 biological experiments, data are represented as mean ± SEM; #P < 0.05 one way ANOVA.) (K) Immunocytochemistry for CTIP2 at DIV30 of differentiation. [Scale bar, 100 μm; Inset (Hoechst staining for each image), 100 μm.] (Lower) High magnification for CTIP2 staining. (Confocal images, scale bar, 50 μm.) (L) Counts of CTIP2+ postmitotic progenitors at DIV30 of differentiation by ITCN ImageJ plugin. (CTIP2+ cells decreased of 42 ± 5.3% and 45 ± 2.6%, respectively, in Q60 and Q109 lines compared with CTRs, **P < 0.01, one-way ANOVA; n = 3 biological experiments, data are represented as mean ± SEM.) (M) Western blot for CTIP2 at DIV30 of differentiation. CTIP2 protein level was normalized on GAPDH. (N) Graph represents densitometric analysis performed on Western blot results from three biological differentiation experiments. (CTRs = 2.02 ± 0.32; Q60n5 = 0.85 ± 0.29; Q109n1 = 0.18 ± 0.09, HD vs. CTRs ***P < 0.001 one-way ANOVA; Q60n5 vs. Q109n1 #P < 0.05 one-way ANOVA; n = 3 biological experiments, data are represented as mean ± SEM.) (O) qPCR for CTIP2 in CTRs and Q60n5 and Q109n1 lines at DIV30. (A.U., CTRs = 31.5 ± 11.4; Q60n5 = 12.6 ± 1.08; Q109n1 = 6.75 ± 3.46; *P < 0.05 one-way ANOVA; n = 3 biological experiments, data are represented as mean ± SEM.)
Fig. 3.
Fig. 3.
Defective striatal terminal differentiation and maturation in HD lines. (A) Immunostaining for TUBB3/MAP2 at DIV30 of differentiation of Q60n5 and Q109n1 and CTR Q21n1. (Confocal images, scale bar, 50 μm.) (B) Representative Western blot for MAP2a/b at DIV30 with corresponding GAPDH levels. (C) Densitometric analysis on Western blot analysis normalized with GAPDH. (CTRs = 2.77 ± 0.74; Q60n5 = 1.61 ± 0.27; Q109n1 = 0.19 ± 0.04; *P < 0.05, ***P < 0.001, #P < 0.05 one-way ANOVA; n = 3 biological experiments, data are represented as mean ± SEM.) (D) Double immunostaining for CTIP2 and DARPP32 at DIV 50 of differentiation. Arrows indicate striatal neurons double positive for CTIP2 (red) and DARPP32 (green). [Scale bar, 100 μm; Insets (crops of the same images), 50 μm.] (E) Representative Western blot for DARPP32 at DIV50 with corresponding GAPDH levels. (F) Densitometric analysis on Western blot analysis. (CTRs = 1.19 ± 0.21; Q60n5 = 0.85 ± 0.29; Q109n1 = 0.18 ± 0.09; *P < 0.05 one-way ANOVA; n = 3 biological experiments, data are represented as mean ± SEM.) (G) Families of Na+ current traces evoked by the protocol (Lower traces) from iPSC-derived striatal neurons differentiated in vitro for 30 d. (H) The graph represents the percentage of cells able to generate 1 spike or firing at DIV30 of differentiation. 62% of CTRs, 53% of Q60n5, and only 8% of Q109 when activated displayed single spike or repetitive firing. (*P < 0.05 one-way ANOVA; n = 3 biological experiments, data are represented as mean ± SEM.) (I) The Na+ current density recorded at −20 mV from the different iPSC-derived neurons. In the graph, each column represents the average of Na+ current density in recorded cells. (Q21n1 plus Q33n1 n = 78; Q60 n = 27, Q109 n = 17, *P < 0.05 one-way ANOVA; n = 3 biological experiments, data are represented as mean ± SEM.)
Fig. 4.
Fig. 4.
HD lines show defects in cortical differentiation and cytoarchitecture. (A) Immunocytochemistry for αPKC, NESTIN/Ki67 on organoids derived from Q21n1 and Q109n1. (Scale bar, 100 μm.) These images are representative of five organoids stained for each line generated in two independent experiments. Representative confocal images of organoids stained with NESTIN, Ki67, and p-VIMENTIN. (Scale bar, 25 μm.) (B) Organoids derived from Q21n1 and Q109n1, double-stained for SOX2/MAP2. (Scale bar, 100 μm.) Specific cortical markers PAX6/TBR1 and CTIP2/TBR1. Arrows indicate the structure mimicking the embryonic ventricle in Q21n1 organoids. Dotted ovals show SOX2 and MAP2 organization in Q21n1 and Q109n1. (Scale bar, 50 μm.)
Fig. 5.
Fig. 5.
Transcriptional dynamics in CTR and HD organoids. (A) Rank-rank hypergeometric overlap maps comparing the transitions between in vivo laminae in the developing cortex to differentiation of CTR (Left) and HD (Right) organoids from DIV45 and 105. Each box shows the color associated with the −log10(P value) multiplied by the sign of either up-regulated (Bottom Left of the box) or down-regulated genes (Top Right of the box) when comparing the differentially expressed genes (DEGs) between each layer of the cortex (e.g., VZ vs. SZ) and DEGs between DIV45 and DIV105. The stronger the intensity of red, the stronger the overlap between in vivo transitions and organoid differentiation. IZ, intermediate zone. (B) Heat map diagram showing the expression levels (z-score) of the differentially expressed genes from the comparison between CTR and HD organoids (t test, P < 0.01, n = 3 different biological replicates in each experimental condition, for each line). (C) Semantic similarity matrix of down-regulated genes in HD organoids. The semantic similarity scores of all GO-term pairs were grouped by hierarchical clustering and representative GO terms are shown on the right and were identified by REVIGO. (GO terms with P < 0.05 are shown. Bar plots in red have P < 0.01.)
Fig. 6.
Fig. 6.
HTT down-regulation by ZFP rescues defects in neural induction. (A) qPCR for total HTT mRNA in Q109n5 line after doxy treatment (+Dox) and relative control (−Dox) at DIV5 of differentiation. (A.U., *P < 0.05 Student t test. n = 3 biological experiments, data are represented as mean ± SEM.) (B) Counts of OCT4+ cells by cell profile in ZFP-A and ZFPΔDBD-infected cells in the absence or presence of Dox. (**P < 0.01 one-way ANOVA; n = 3 biological experiments, data are represented as mean ± SEM.) (C) qPCR for total HTT mRNA in ZFP-A and ZFPΔDBD constitutive Q109n1 line at DIV15 of differentiation. (A.U., *P < 0.05 one-way ANOVA; n = 3 biological experiments, data are represented as mean ± SEM.) (D) Immunostaining for PALS1/N-cadherin in ZFP-A and ZFPΔDBD constitutive Q109n1 lines and ZFPΔDBD Q21n1 line at DIV15 of differentiation. [Scale bar, 50 μm; Insets (crops of the PALS1 of the same images), 50 μm.] (E) Counts of lumen size in rosettes in ZFP-A and ZFPΔDBD constitutive Q109n1 and Q21n1 (μm2). (*P < 0.05, **P < 0.01 one-way ANOVA; n = 3 biological experiments, data are represented as mean ± SEM.) (F) Western blot for N-CAD in Q109n1 cells treated with 10 nM ADAM10 inhibitor GI254023X with respect to untreated cells and Q21n1 at DIV15 of differentiation. MuHTT leads to increase N-CAD cleavage and affects rosettes formation, a phenotype that is partially rescued by GI254023X treatment. (G) Densitometric analysis of CTF level in Q109n1 cells in the presence or absence of GI254023X and relative to Q21n1 control line. (*P < 0.05, **P < 0.01 one-way ANOVA; n = 3 biological experiments, data are represented as mean ± SEM.) (H) Immunostaining for PALS1/N-CAD in Q109n1 treated with GI254023X relative to untreated control at DIV15 of differentiation. (Scale bar, 50 μm.) (I) Counts of area lumen size in the presence or absence of GI254023X (μm2) (***P < 0.001 Student t test). (J) qPCR for GSX2, (K) SOX11, and (L) CTIP2 transcripts at DIV30 of differentiation in Q109n1 treated with GI254023X relative to untreated control. (*P < 0.05, **P < 0.01 one-way ANOVA; n = 3 biological experiments, data are represented as mean ± SEM.) (M) Confocal images of CTIP2 in Q109n1 without and with GI254023X at DIV30 of differentiation. (Confocal images, scale bar, 50 μm.) (N) Counts of percentage of CTIP2+ cells with cell profile pipeline in Q109n1 without and with GI254023X. (***P < 0.001, *P < 0.05 one-way ANOVA; n = 3 biological experiments, data are represented as mean ± SEM.)

References

    1. Reiner A, et al. Differential loss of striatal projection neurons in Huntington disease. Proc Natl Acad Sci USA. 1988;85:5733–5737. - PMC - PubMed
    1. Cudkowicz M, Kowall NW. Degeneration of pyramidal projection neurons in Huntington’s disease cortex. Ann Neurol. 1990;27:200–204. - PubMed
    1. Duyao MP, et al. Inactivation of the mouse Huntington’s disease gene homolog Hdh. Science. 1995;269:407–410. - PubMed
    1. Zeitlin S, Liu JP, Chapman DL, Papaioannou VE, Efstratiadis A. Increased apoptosis and early embryonic lethality in mice nullizygous for the Huntington’s disease gene homologue. Nat Genet. 1995;11:155–163. - PubMed
    1. Leavitt BR, et al. Wild-type huntingtin reduces the cellular toxicity of mutant huntingtin in vivo. Am J Hum Genet. 2001;68:313–324. - PMC - PubMed

Publication types