. 2018 Jan 8;9(1):75.
doi: 10.1038/s41467-017-02492-2.

Yolk sac macrophage progenitors traffic to the embryo during defined stages of development

Affiliations

Yolk sac macrophage progenitors traffic to the embryo during defined stages of development

C Stremmel et al. Nat Commun. .

Erratum in

Abstract

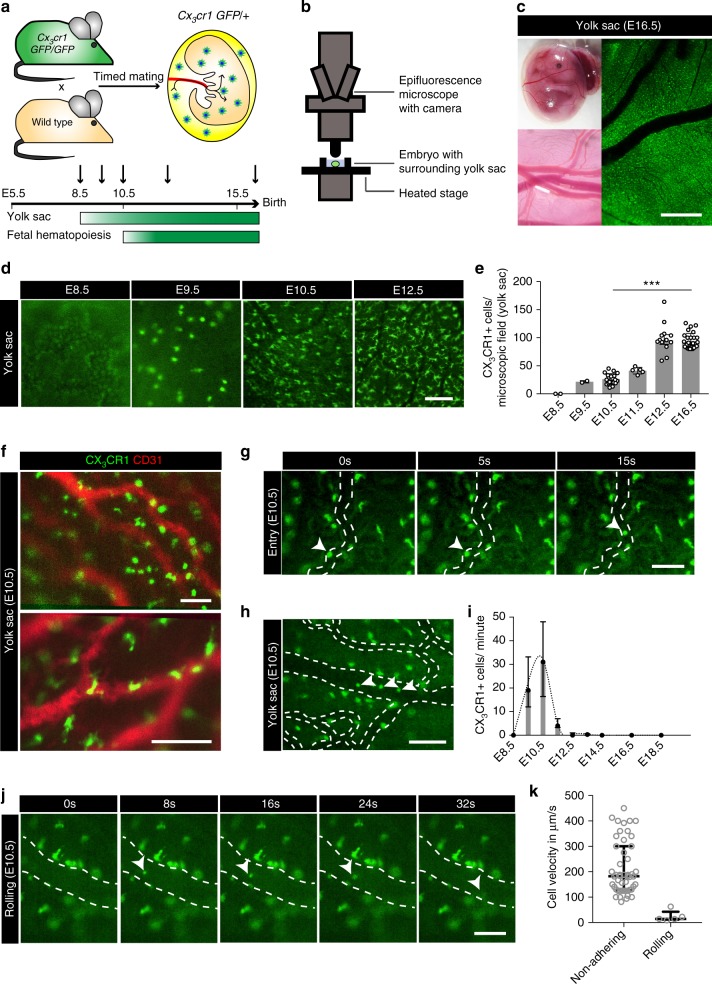
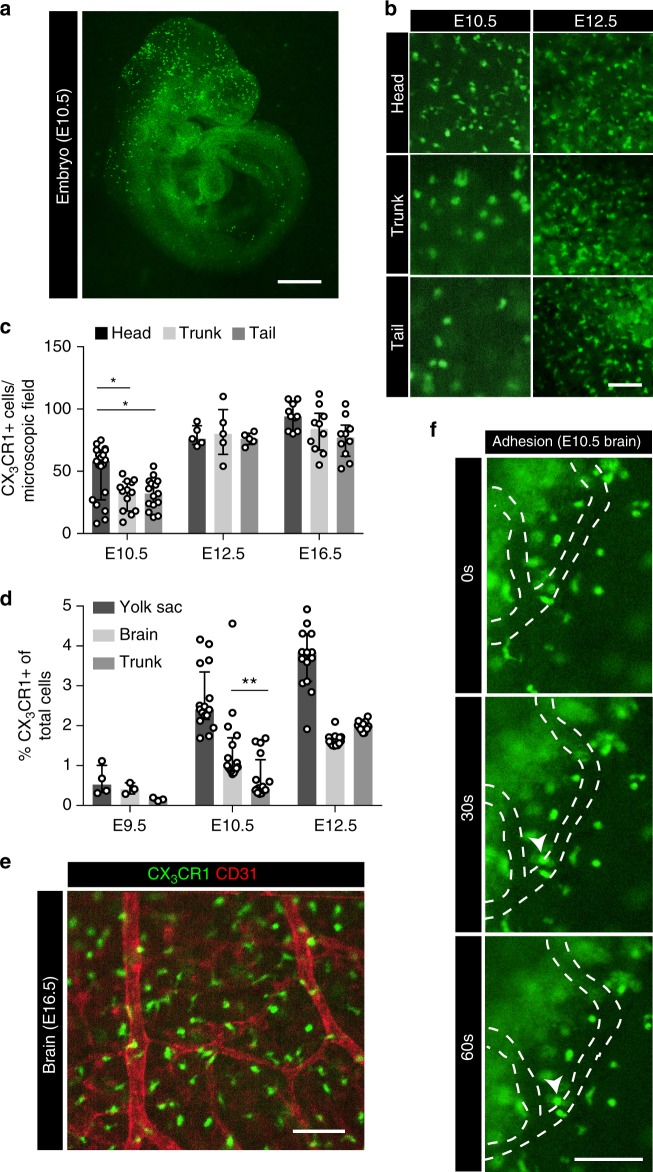
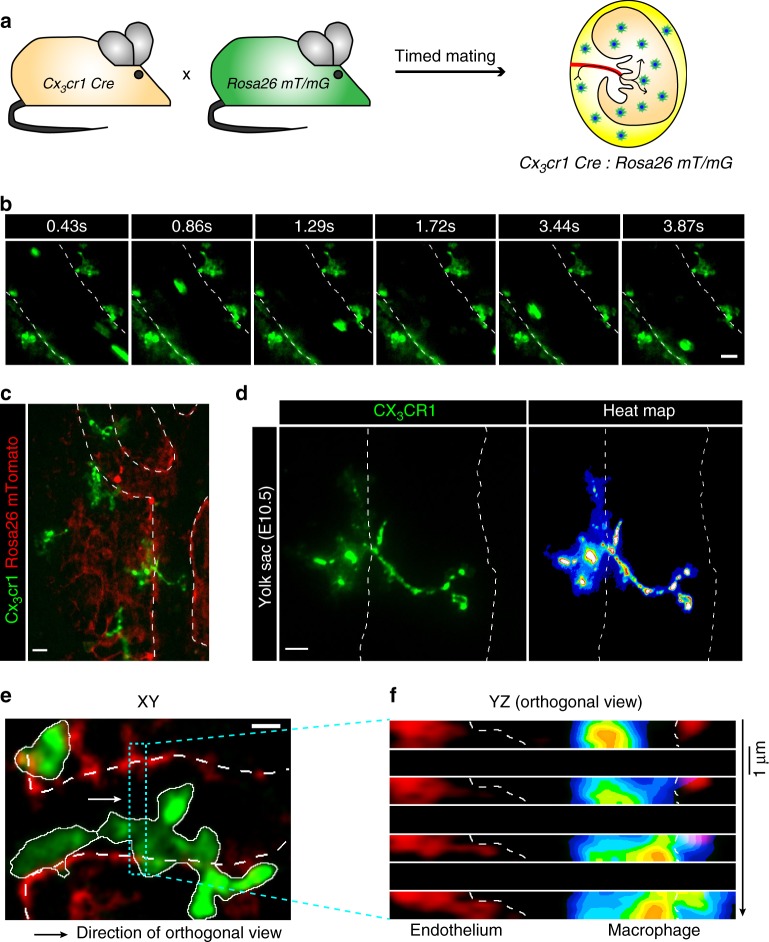
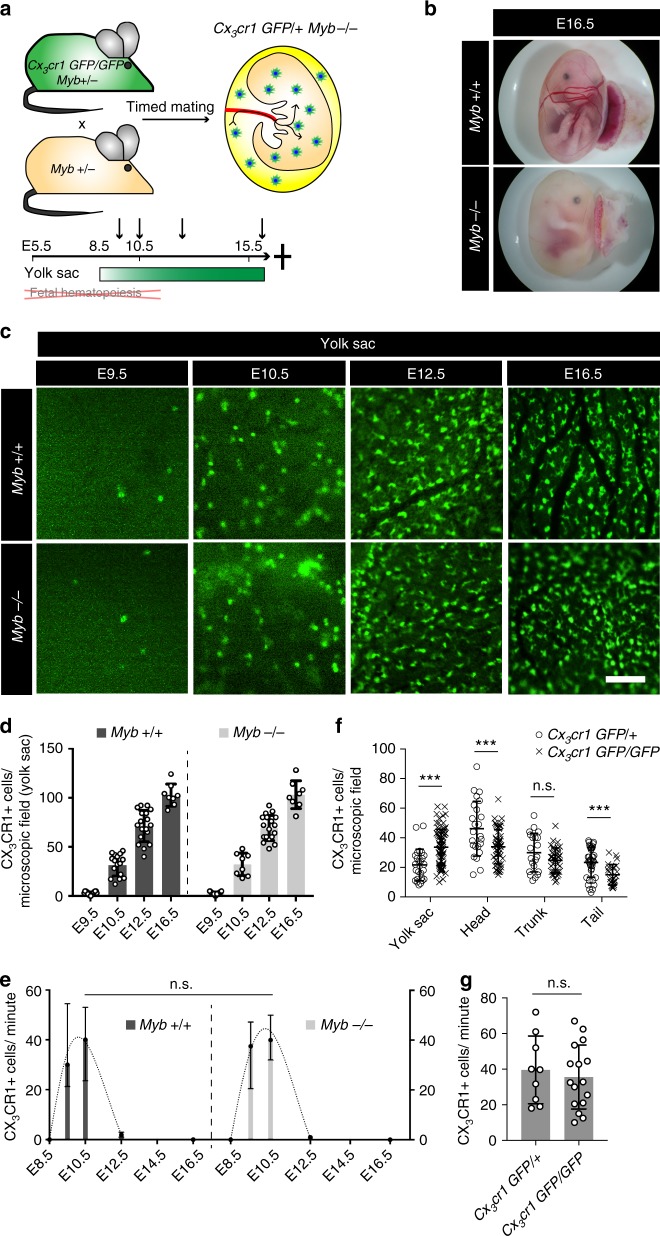
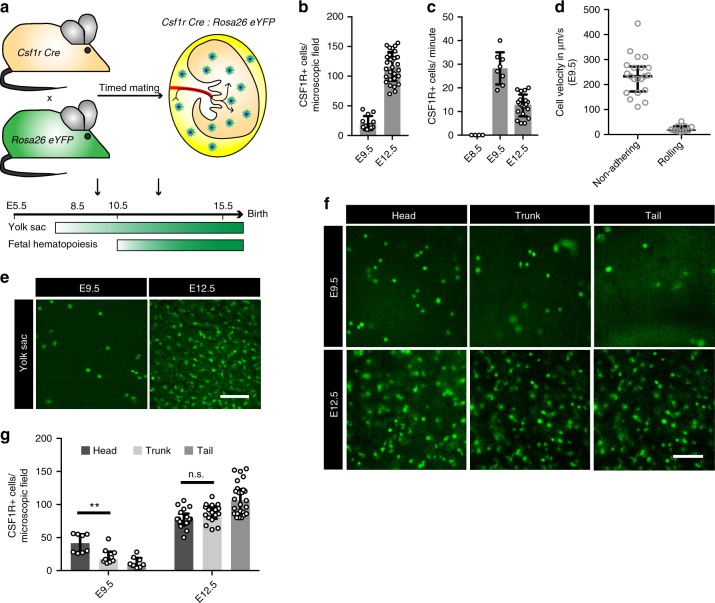
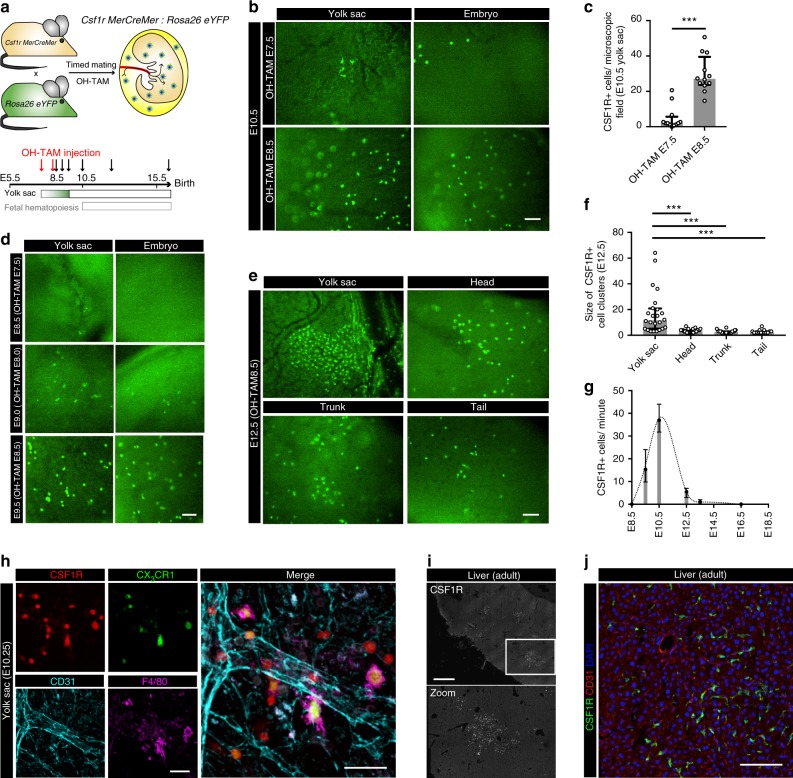
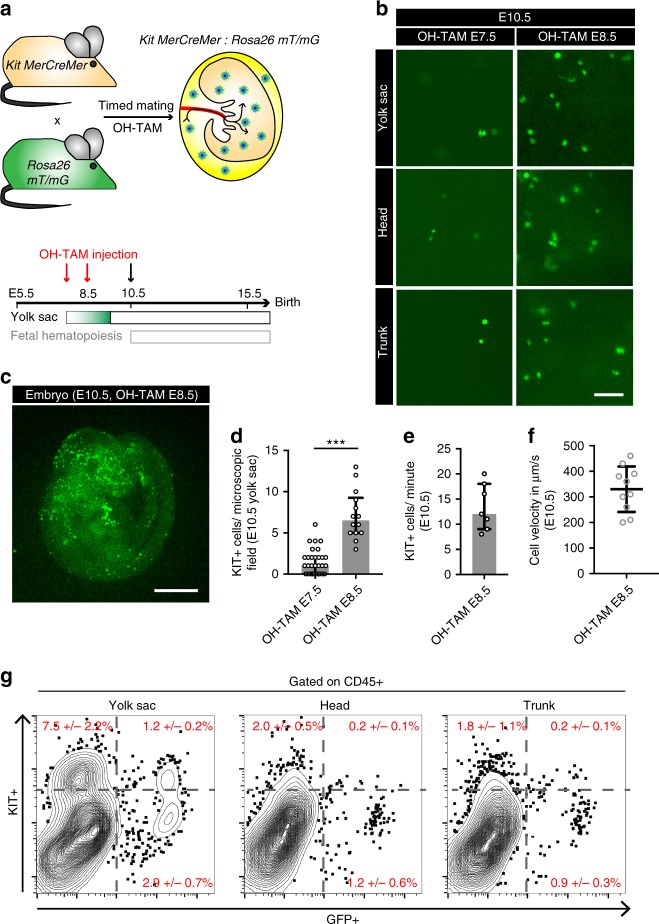
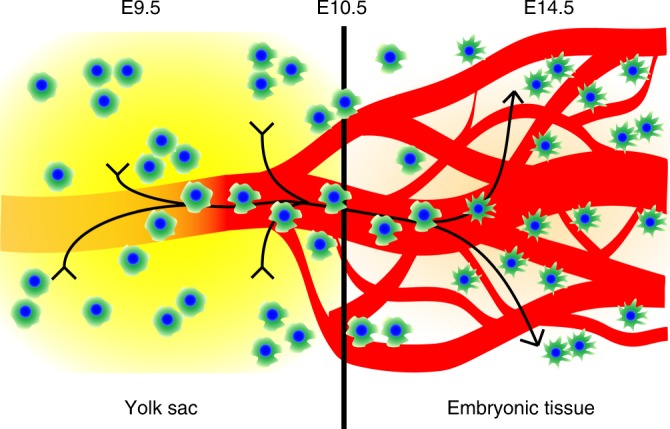
Tissue macrophages in many adult organs originate from yolk sac (YS) progenitors, which invade the developing embryo and persist by means of local self-renewal. However, the route and characteristics of YS macrophage trafficking during embryogenesis are incompletely understood. Here we show the early migration dynamics of YS-derived macrophage progenitors in vivo using fate mapping and intravital microscopy. From embryonic day 8.5 (E8.5) CX3CR1+ pre-macrophages are present in the mouse YS where they rapidly proliferate and gain access to the bloodstream to migrate towards the embryo. Trafficking of pre-macrophages and their progenitors from the YS to tissues peaks around E10.5, dramatically decreases towards E12.5 and is no longer evident from E14.5 onwards. Thus, YS progenitors use the vascular system during a restricted time window of embryogenesis to invade the growing fetus. These findings close an important gap in our understanding of the development of the innate immune system.


Conflict of interest statement

The authors declare no competing financial interests.

Figures

Fig. 1
Fig. 1
Intravascular trafficking of CX3CR1+ YS pre-macrophages. a, b Schematic graphs of the mouse model (a) and the intravital imaging setup in Cx3cr1GFP/+ mice (b). c E16.5 Cx3cr1GFP/+ embryo with surrounding YS and its dense vascular network. d YS tissue with CX3CR1+ pre-macrophages at indicated time points. Pictures show a representative microscopic field of 400 × 400 µm. e Corresponding quantification of CX3CR1+ cells per microscopic field of 400 × 400 µm; *** p < 0.001 (two-tailed Mann–Whitney test); graph shows median with interquartile range (±IQR, error bars). f In vivo YS staining for the endothelial marker CD31 (red) in Cx3cr1GFP/+ (green) embryos at E10.5. g, h, j Images extracted from E10.5 video sequences of CX3CR1+ YS tissue show a cell entering the vasculature (g, from Supplementary Movie 1) as well as intravascular non-adhering (h, from Supplementary Movie 3) and rolling (j) cells. CX3CR1+ cells in focus are indicated by arrowheads; direction of flow from bottom to top (g), left to right (h), left to right (j). i Quantification of intravascular CX3CR1+ cells in the YS in an average-sized vessel; median ± IQR. k Velocity of intravascular non-adhering (n = 50) and rolling (n = 5) CX3CR1+ cells in the YS at E10.5; median ± IQR. Scale bars are 1 mm (c), 100 µm (d, f, g, h, j)
Fig. 2
Fig. 2
Pre-macrophages infiltrate embryonic tissues. a Isolated E10.5 Cx3cr1GFP/+ embryo. b, c Visualization (b) and quantification (c) of CX3CR1+ macrophages in different embryonic regions at indicated time points; * p < 0.05 (one-way ANOVA with Tukey’s multiple comparisons test: head vs. trunk p = 0.0107, head vs. tail p = 0.0121, trunk vs. tail p = 0.9860); graph shows median ± IQR. d Quantification by flow cytometry of CX3CR1 GFP+ cells in the embryonic YS, brain and trunk at indicated time points; (**) p = 0.0017 (two-tailed Mann–Whitney test); median ± IQR. e CX3CR1 GFP+ cells (green) in the embryonic brain at E16.5 additionally stained for the endothelial marker CD31 (red). f Image series extracted from live E10.5 video sequences (Supplementary Movie 6) show a cell attaching to the endothelium in the embryonic head region; direction of flow from top to bottom. Scale bars are 1 mm (a), 100 µm (b, e, f)
Fig. 3
Fig. 3
Trafficking is associated with cellular morphology. Intravital spinning disc microscopy of YS vasculature in E10.5 Cx3cr1Cre:Rosa26mT/mG embryos. a Schematic graph for the Cx3cr1Cre:Rosa26mT/mG mouse model. b Image series of CX3CR1 GFP+ (green) YS pre-macrophages; direction of flow from top to bottom (from Supplementary Movie 7). cf Dendrite-shaped CX3CR1 GFP+ macrophages (green) with intravascular protrusions (c, d) further illustrated by multiplanar reconstructions in XY (e, from Supplementary Movie 8) and orthogonal YZ views including heat map (f); endothelium (mTomato, red). Scale bars are 20 µm (b, c, e), 10 µm (d)
Fig. 4
Fig. 4
Intravascular trafficking is independent of MYB and CX3CR1. a Schematic graph of the Cx3cr1GFP/+ Myb−/− mouse model. b Bright field images of isolated embryos at E16.5 indicating the absence of fetal definitive hematopoiesis (i.e. severe anemia). c, d Visualization (c) and quantification (d) of CX3CR1+ cells in the YS of Myb+/+ or Myb−/− mice at indicated time points; all comparisons of Myb+/+ vs. Myb−/− are n.s. (two-tailed t-test: E9.5 p = 0.9818, E10.5 p = 0.8894, E12.5 p = 0.6900, E16.5 p = 0.9543); mean ± standard deviation (SD, error bars). e Quantification of intravascular CX3CR1+ cells in a Myb+/+ and Myb−/− YS on indicated time points; E10.5: n.s. (two-tailed Mann–Whitney: E10.5 p = 0.4537); median ± IQR. f Quantification of CX3CR1+ cell densities per microscopic field of 400 × 400 µm in embryonic tissues at E10.5; *** p < 0.001 (two-tailed t-test); mean ± SD. g Quantification of intravascular CX3CR1+ cells in YS of Cx3cr1GFP/+ and Cx3cr1GFP/GFP E10.5 embryos; n.s. (two-tailed t-test: p = 0.6065); mean ± SD. Scale bar is 100 µm (c)
Fig. 5
Fig. 5
Trafficking kinetics of CSF1R+ cells are similar to pre-macrophages. a Schematic graph for the Csf1rCre:Rosa26eYFP mouse model. b, e Fluorescence images of CSF1R YFP+ cells (green) in the YS (e) with corresponding quantifications (b) of cells per microscopic field at indicated time points; mean ± SD. c Quantification of intravascular CSF1R+ cells in an average-sized vessel; mean ± SD. d Velocity of intravascular non-adhering (n = 21) and rolling (n = 11) CSF1R+ cells in the YS at E9.5; median ± IQR. f, g Fluorescence images of CSF1R YFP+ cells (green) in different embryonic regions (f) with corresponding quantifications (g) of cells per microscopic field at indicated time points; ** p = 0.0072, n.s. p = 0.0569 (two-tailed Mann–Whitney test); median ± IQR. Scale bars are 100 µm (e, f)
Fig. 6
Fig. 6
Cellular expansion and morphology of CSF1R+ progenitors. a Schematic graph for the Csf1rMerCreMer:Rosa26eYFP mouse model with OH-TAM pulse labeling at E7.5 or E8.5 (red arrows) and subsequent analyses at indicated time points (black arrows). b, c Fluorescence pictures of E10.5 YS and embryo after OH-TAM pulse at E7.5 or E8.5 as indicated (b) with corresponding quantifications c; *** p < 0.001 (two-tailed MannWhitney test); median ± IQR. d Fluorescent pictures in the YS and embryo at E8.5, E9.0 and E9.5 with OH-TAM injection 24 h earlier. e, f Fluorescence pictures of a E12.5 YS and different embryonic regions after OH-TAM pulse labeling on E8.5 (e) with corresponding quantification of cluster size (f); *** p < 0.001 (Kruskal–Wallis test with Dunn’s multiple comparisons test); median ± IQR. g Quantification of intravascular cells at indicated time points in an average-sized vessel; median ± IQR. h Fluorescence pictures of a E10.25 YS in a Csf1rMerCreMer:Rosa26tdTomato (red):Cx3cr1GFP/+ (green) mouse model with OH-TAM pulse labeling at E8.5. Additional staining for F4/80 (purple) and CD31 (turquoise). i, j Adult liver sections of Csf1rMerCreMer:Rosa26eYFP mice, pulse-labeled at E8.5 (i) with additional stainings for CD31 (red) and DAPI (blue) (j). Scale bars are 100 µm (b, d, e, j), 1 mm (i), 50 µm (h)
Fig. 7
Fig. 7
Trafficking of KIT+ EMPs. a Schematic graph for the KitMerCreMer:Rosa26mT/mG mouse model with OH-TAM pulse labeling at E7.5 or E8.5 (red arrows) and subsequent analyses at E10.5 (black arrow). bd Fluorescent pictures of KIT+ cells in the YS and embryo on E10.5 after pulse labeling at indicated time points (b, c) with corresponding quantifications (d); *** p < 0.001 (Mann–Whitney test); median ± IQR. e Quantification of labeled KIT+ cells/min in an average-sized YS vessel at E10.5; median ± IQR. f Velocity of intravascular non-adhering KIT+ cells in the YS at E10.5; mean ± SD. g Flow cytometry plots of CD45+ gated KIT+ vs. GFP+ cells from pulse-labeled KitMerCreMer:Rosa26mT/mG mice in YS, head and trunk region at E10.5. Plots show an individual representative experiment. At least 3 embryos of minimum 2 independent litters were analyzed per time point. Scale bars are 100 µm (b), 1 mm (c)
Fig. 8
Fig. 8
YS-derived macrophages traffic during defined stages of development. Graphical summary of morphology-dependent trafficking dynamics: macrophage progenitors expand in the YS from E8.5 onwards. They traffic to embryonic organs via vascular routes during a restricted time frame until E14.5. This trafficking period is characterized by a spherical cell shape. Along with progressive macrophage maturation an increasing amount of dendrites is formed and macrophages lose intravascular trafficking capacity

Similar articles

Cited by

References

    1. Tauber AI. Metchnikoff and the phagocytosis theory. Nat. Rev. Mol. Cell. Biol. 2003;4:897–901. doi: 10.1038/nrm1244. - DOI - PubMed
    1. Moore KJ, Sheedy FJ, Fisher EA. Macrophages in atherosclerosis: a dynamic balance. Nat. Rev. Immunol. 2013;13:709–721. doi: 10.1038/nri3520. - DOI - PMC - PubMed
    1. McNelis JC, Olefsky JM. Macrophages, immunity, and metabolic disease. Immunity. 2014;41:36–48. doi: 10.1016/j.immuni.2014.05.010. - DOI - PubMed
    1. Noy R, Pollard JW. Tumor-associated macrophages: from mechanisms to therapy. Immunity. 2014;41:49–61. doi: 10.1016/j.immuni.2014.06.010. - DOI - PMC - PubMed
    1. Prinz M, Priller J. Microglia and brain macrophages in the molecular age: from origin to neuropsychiatric disease. Nat. Rev. Neurosci. 2014;15:300–312. doi: 10.1038/nrn3722. - DOI - PubMed

Publication types

LinkOut - more resources