. 2018 Jan 8;9(1):74.
doi: 10.1038/s41467-017-02426-y.

Dynamic changes in carbonate chemistry in the microenvironment around single marine phytoplankton cells

Affiliations

Dynamic changes in carbonate chemistry in the microenvironment around single marine phytoplankton cells

Abdul Chrachri et al. Nat Commun. .

Abstract

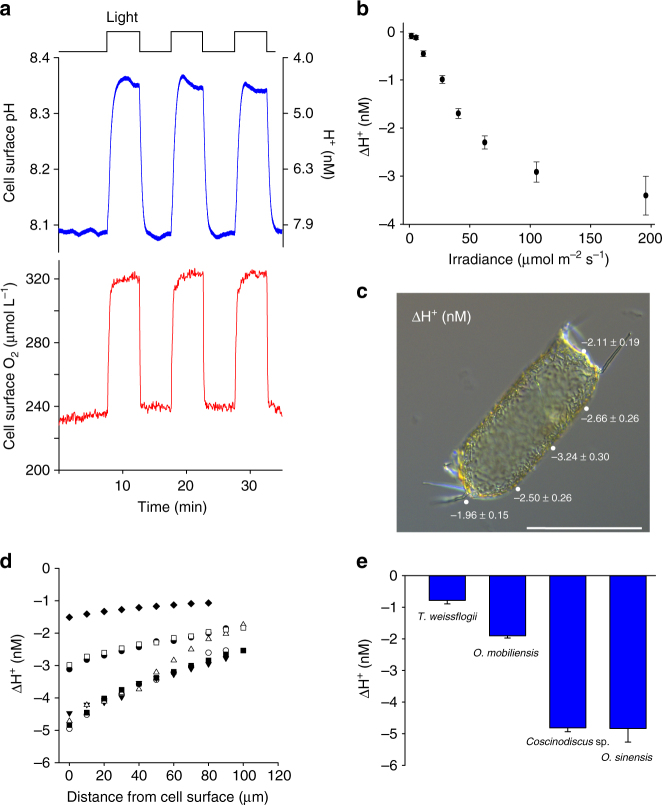
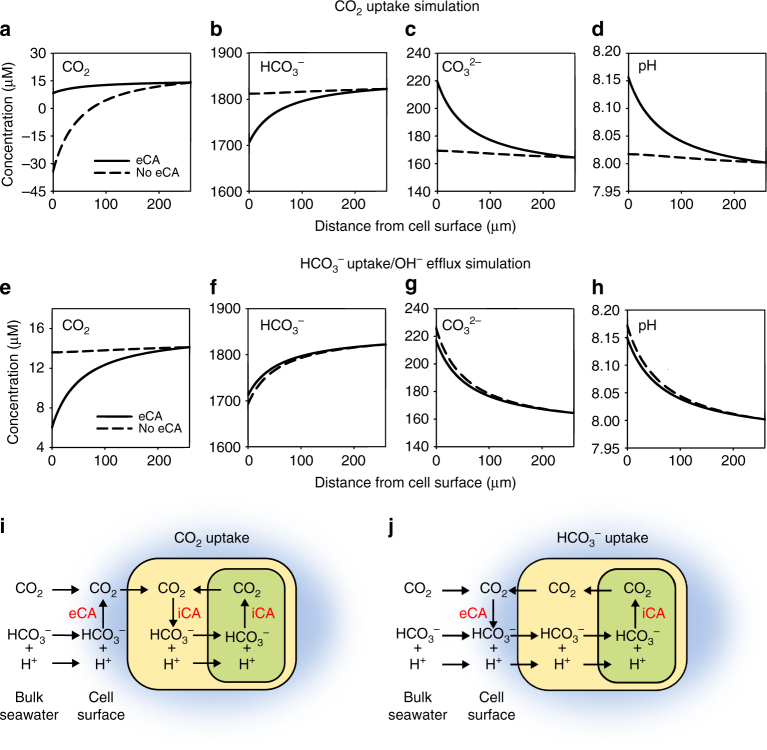
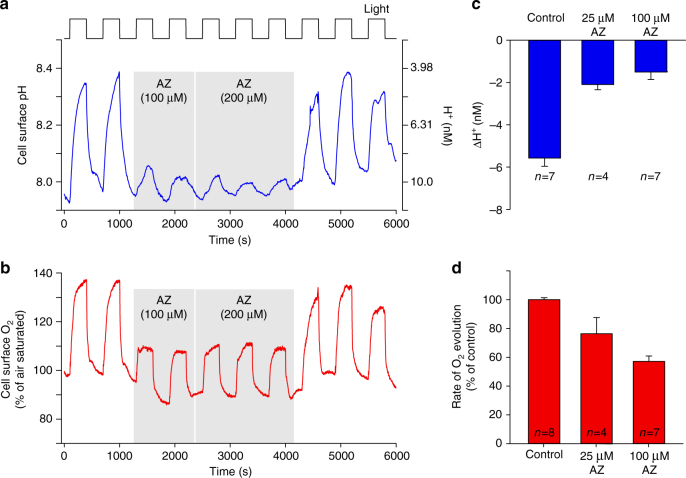
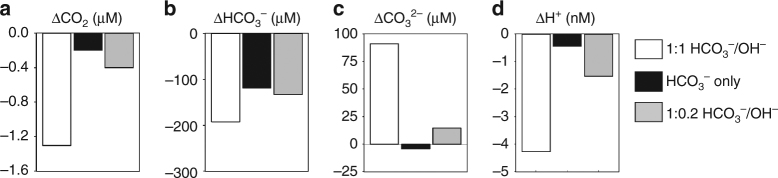
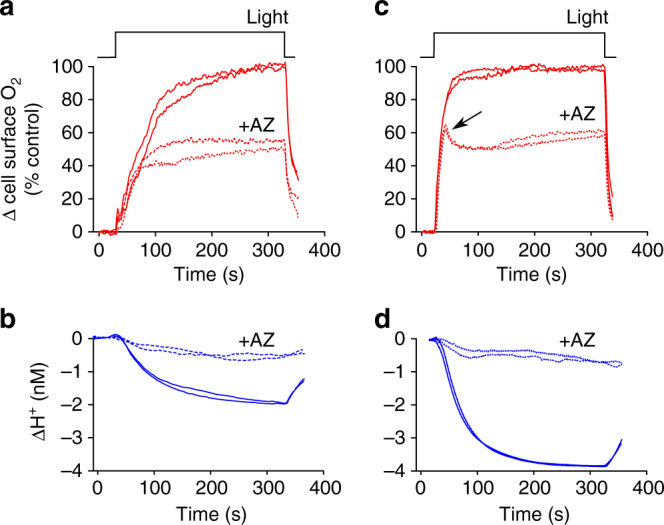
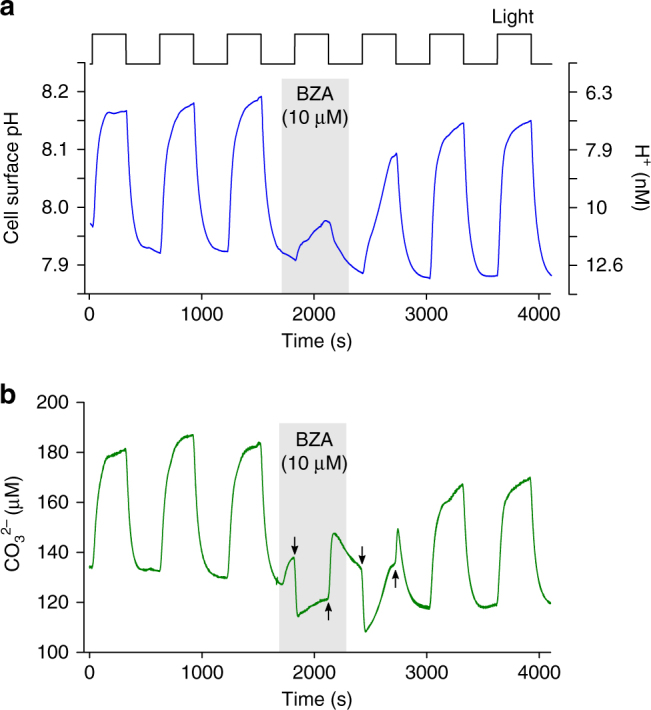
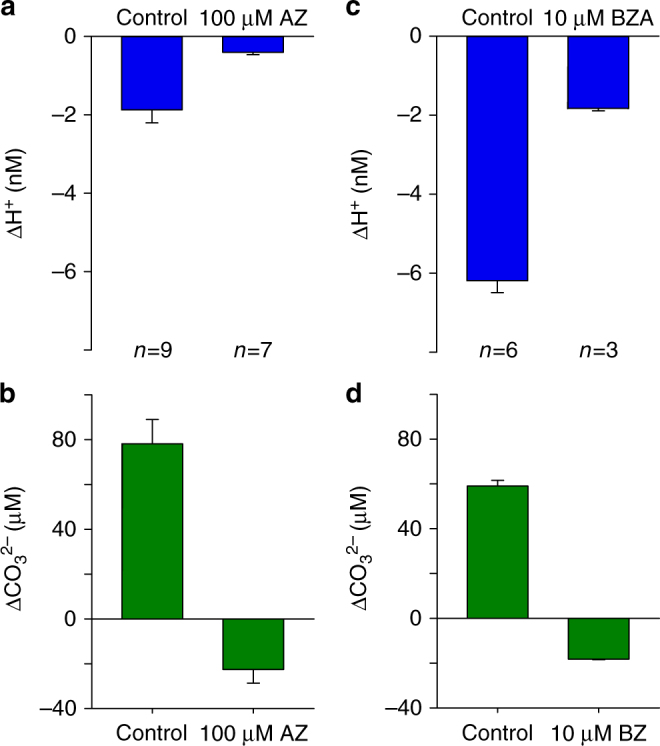
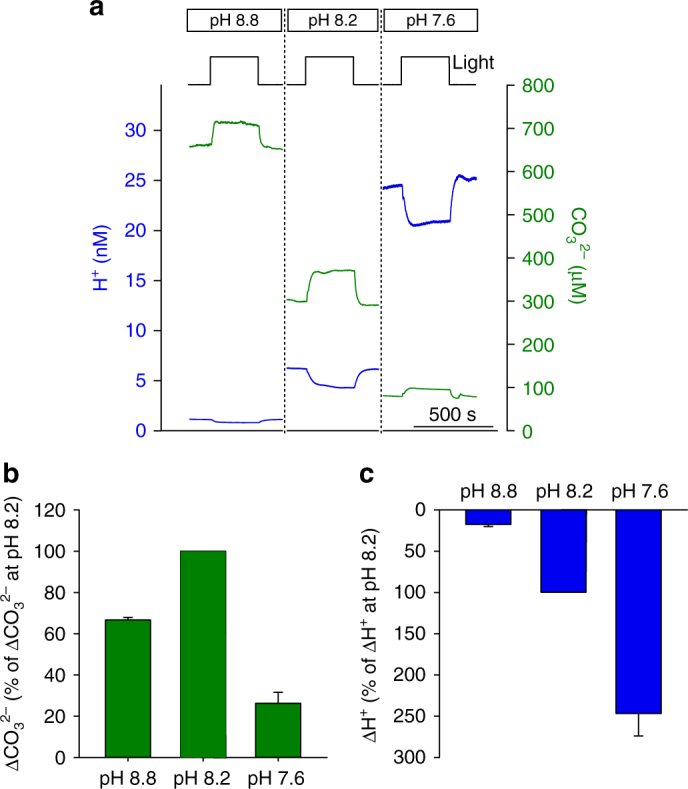
Photosynthesis by marine diatoms plays a major role in the global carbon cycle, although the precise mechanisms of dissolved inorganic carbon (DIC) uptake remain unclear. A lack of direct measurements of carbonate chemistry at the cell surface has led to uncertainty over the underlying membrane transport processes and the role of external carbonic anhydrase (eCA). Here we identify rapid and substantial photosynthesis-driven increases in pH and [CO32-] primarily due to the activity of eCA at the cell surface of the large diatom Odontella sinensis using direct simultaneous microelectrode measurements of pH and CO32- along with modelling of cell surface inorganic carbonate chemistry. Our results show that eCA acts to maintain cell surface CO2 concentrations, making a major contribution to DIC supply in O. sinensis. Carbonate chemistry at the cell surface is therefore highly dynamic and strongly dependent on cell size, morphology and the carbonate chemistry of the bulk seawater.


Conflict of interest statement

The authors declare no competing financial interests.

Figures

Fig. 1
Fig. 1
Photosynthetic DIC uptake results in an increase in pH at the cell surface. a Light-dependent changes in cell surface pH (upper) and [O2] (lower) around the large diatom Odontella sinensis measured using microelectrodes. Upon illumination there are very rapid increases in pH and [O2]. b The increase in cell surface pH is strongly dependent on irradiance. The mean change in cell surface [H+] (±s.e.m.) following illumination is shown (n = 12 cells). c Brightfield microscopy image of an O. sinensis cell illustrating spatial variability in cell surface pH in the light. The mean change in [H+] (±s.e.m.) following illumination was measured at different positions around the cell in seawater at pH 8.0 (n = 12 cells). The positions of the microelectrode are shown around a representative cell. Bar = 100 µm. d The zone of elevated pH extends significantly away from the cell. For each illuminated cell, pH was recorded at 10 µm increments away from the cell. The change in [H+] from the bulk seawater is shown (pH 8.0). n = 7 cells. e Comparison of the light-dependent increase in cell surface pH in four centric diatoms; Thalassiosira weissflogii (approximate length 20–25 µm), Odontella mobiliensis (length 40–60 µm), Coscinodiscus sp. (diameter 140–170 µm) and O. sinensis (length 150–250 µm). The mean light-dependent change in cell surface [H+] in seawater at pH 8.0 is shown (±s.e.m.) (n = 12)
Fig. 2
Fig. 2
Cellular modelling of carbonate chemistry around a large diatom cell. Simulated profiles of inorganic carbon species (CO2, HCO3 , CO3 2−) and pH around a large (r = 60 µm) photosynthesising cell. The horizontal axis represents distance away from the cell surface. ad A cell taking up only CO2 for photosynthesis in the presence (solid line) and absence (dashed-line) of extracellular carbonic anhydrase (eCA). eh A cell taking up only HCO3 for photosynthesis but exporting OH to maintain internal pH and charge balance. The model shows that eCA is necessary to support substantial rates of CO2 uptake and that surface pH is dependent on eCA activity only when CO2 uptake occurs. Note that the model assumes a fixed rate of CO2 uptake, which results in a negative value of [CO2] at the cell surface, illustrating that the combination of uncatalysed conversion from HCO3 and diffusion is insufficient to supply CO2 at this rate. The cell size approximates a typical O. sinensis cell and the eCA activity in the model is equivalent to that measured in O. sinensis (8.3 × 10−5 cm3 s−1). i Schematic illustration of the major DIC and H+ fluxes during CO2 uptake. eCA catalyses the conversion of HCO3 to CO2 at the cell surface (consuming H+) to maintain the inward concentration gradient for CO2. iCA intracellular carbonic anhydrase. j DIC and H+ fluxes during active HCO3 uptake. In this scenario, eCA could act to minimise CO2 loss from the cell, converting CO2 leaking across the plasma membrane to HCO3 (generating H+). For simplicity, the schematic shows H+ uptake co-occurring with HCO3 uptake, although OH efflux was used in the cellular model described above
Fig. 3
Fig. 3
Changes in cell surface pH in O. sinensis due to the activity of external carbonic anhydrase. a Acetazolamide (AZ), an inhibitor of external carbonic anhydrase (eCA), has a significant impact on cell surface pH. Light-dependent increases in cell surface pH were measured using a pH microelectrode. The addition of AZ largely inhibits the increase in cell surface pH. b Light-dependent increases in [O2] for the cell shown in a. The addition of AZ substantially reduces the light-dependent increase in [O2] around the cell. The inhibitory effect of AZ is rapidly reversed. c Mean changes in cell surface [H+] after illumination for 300 s following treatment with AZ. d Mean rate of O2 evolution relative to control following treatment with AZ. Error bars represent s.e.m.
Fig. 4
Fig. 4
Cellular modelling of HCO3 uptake. ad Simulated changes in concentrations of inorganic carbon species and H+ at the cell surface relative to bulk solution concentrations. Three different scenarios were simulated: (1) Photosynthesis supported by HCO3 uptake with equimolar OH export, (2) HCO3 uptake only, (3) HCO3 uptake with OH export occurring at 20% the rate of HCO3 uptake, a scenario chosen to best match the H+ drawdown observed in the presence of AZ
Fig. 5
Fig. 5
The cell surface microenvironment under low DIC conditions. a Detailed view of the increase in cell surface [O2] following illumination of an O. sinensis cell in ASW media containing 2 mM DIC at pH 8.0 with or without the addition of 100 µM AZ. The O2 traces are shown as % of the untreated control. b The decrease in cell surface [H+] for cells shown in a. c Cell surface [O2] around an O. sinensis cell in ASW media containing 0.5 mM DIC at pH 8.0 with or without the addition of 100 µM AZ. In the presence of AZ at 0.5 mM DIC, the initial rise in [O2] at the cell surface is very similar to the untreated control, but this rate cannot be sustained and falls to a lower level. d The decrease in cell surface [H+] for cells shown in c. The depletion of [H+] at the cell surface is much greater at 0.5 mM DIC than at 2 mM DIC. Representative traces are shown from two individual cells, n = 7 cells examined
Fig. 6
Fig. 6
Simultaneous measurement of pH and CO3 2− at the cell surface. a Light-dependent changes in cell surface pH around an O. sinensis cell. b Light-dependent changes in cell surface [CO3 2−] around the cell described in a. In the untreated cell, illumination results in a rapid increase in cell surface [CO3 2−] that very closely mirrors the rise in pH. On addition of 10 µM benzolamide (BZA), the increase in cell surface pH is dramatically reduced and [CO3 2−] no longer mirrors pH but shows an immediate decrease upon illumination (down arrow), which is restored after the cell is returned to the dark (up arrow). Following the removal of BZA, the light-dependent increase in cell surface pH is rapidly restored, although the decrease in [CO3 2−] persists for one light/dark cycle (arrowed). Note a small increase in [CO3 2−] coincides with the addition of BZA, which is due to slight differences in the carbonate chemistry of the ASW media containing BZA
Fig. 7
Fig. 7
The effect of eCA inhibitors on cell surface pH and CO3 2−. a Mean changes in cell surface [H+] after illumination for 300 s at pH 8.2 following treatment with 100 µM AZ. b The mean changes in [CO3 2−] for cells described in a. c Mean changes in cell surface [H+] after illumination for 300 s at pH 8.0 following treatment with 10 µM BZA. d The mean changes in [CO3 2−] for cells described in c. Error bars represent s.e.m.
Fig. 8
Fig. 8
Cell surface carbonate chemistry at altered seawater pH. a Simultaneous measurement of cell surface [H+] and [CO3 2−] around an O. sinensis cell in ASW media at pH 8.8. Measurements around the same cell were then taken after the ASW media was bubbled with CO2 to reduce the pH sequentially to 8.2 and 7.6. b Mean light-dependent changes in cell surface [CO3 2−] in ASW media at pH 8.8, 8.2 and 7.6. c Mean light-dependent changes in [H+] for the cells shown in b. The results are shown as percentage of the light-dependent changes observed at pH 8.2 to normalise for variability in the photosynthetic activity between individual cells. n = 3 cells. Error bars represent s.e.m.

References

    1. Nelson DM, Treguer P, Brzezinski MA, Leynaert A, Queguiner B. Production and dissolution of biogenic silica in the ocean - revised global estimates, comparison with regional data and relationship to biogenic sedimentation. Glob. Biogeochem. Cycles. 1995;9:359–372. doi: 10.1029/95GB01070. - DOI
    1. Zeebe, R. & Wolf-Gladrow, D. CO2 in Seawater: Equilibrium, Kinetics, Isotopes (Elsevier, London, 2001).
    1. Giordano M, Beardall J, Raven JA. CO2 concentrating mechanisms in algae: mechanisms, environmental modulation, and evolution. Annu. Rev. Plant. Biol. 2005;56:99–131. doi: 10.1146/annurev.arplant.56.032604.144052. - DOI - PubMed
    1. Hopkinson BM, Dupont CL, Allen AE, Morel FM. Efficiency of the CO2-concentrating mechanism of diatoms. Proc. Natl. Acad. Sci. USA. 2011;108:3830–3837. doi: 10.1073/pnas.1018062108. - DOI - PMC - PubMed
    1. Hopkinson BM, Dupont CL, Matsuda Y. The physiology and genetics of CO2 concentrating mechanisms in model diatoms. Curr. Opin. Plant. Biol. 2016;31:51–57. doi: 10.1016/j.pbi.2016.03.013. - DOI - PubMed

Publication types

LinkOut - more resources