. 2018 Jan 8;9(1):88.
doi: 10.1038/s41467-017-02577-y.

Multi-day rhythms modulate seizure risk in epilepsy

Affiliations

Multi-day rhythms modulate seizure risk in epilepsy

Maxime O Baud et al. Nat Commun. .

Abstract

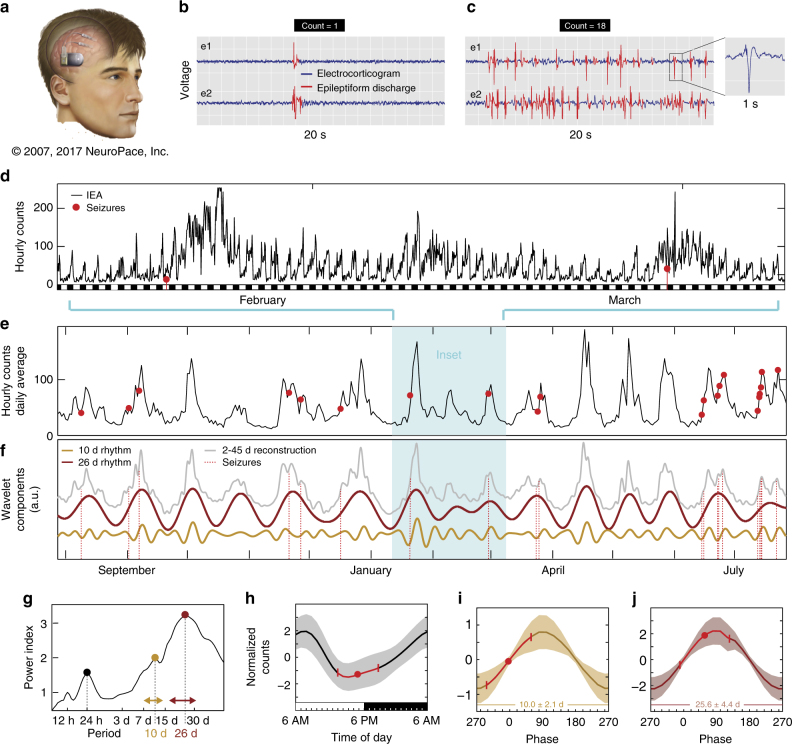
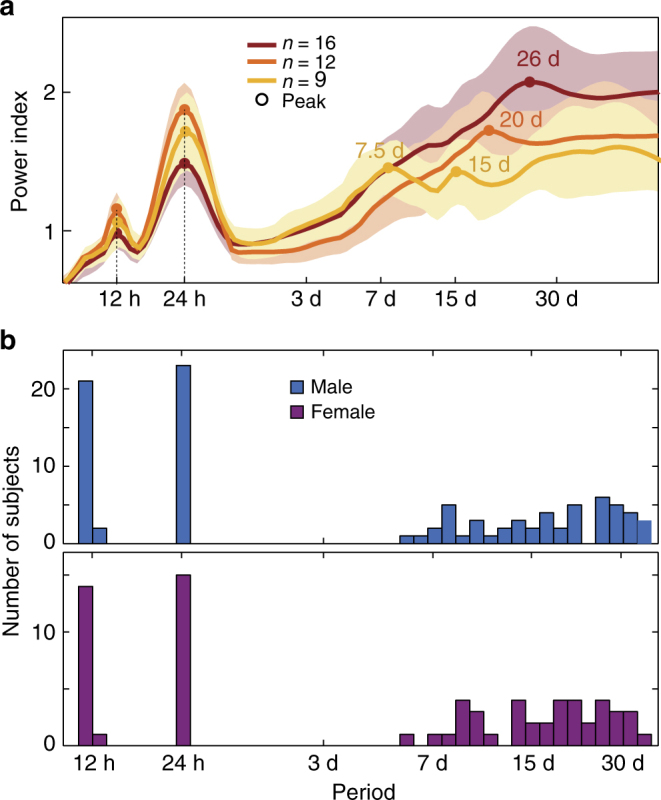
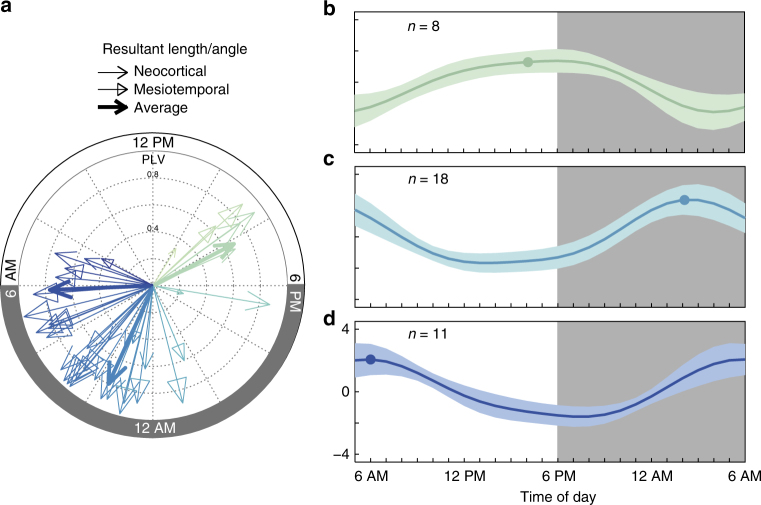
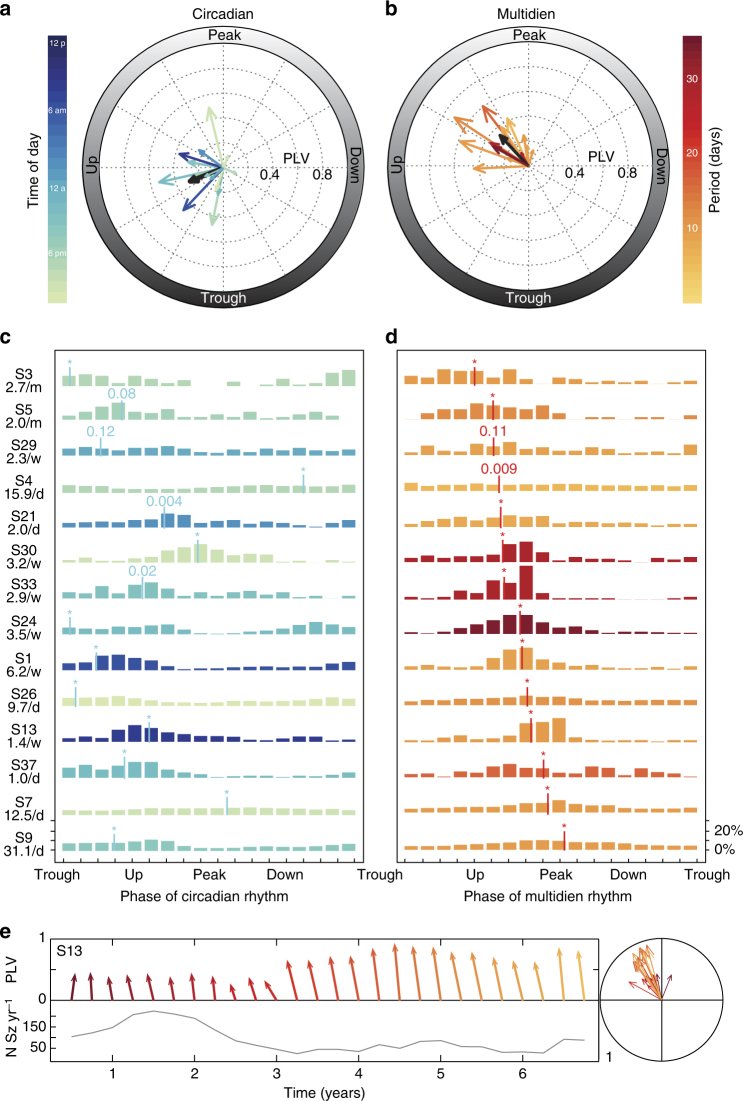
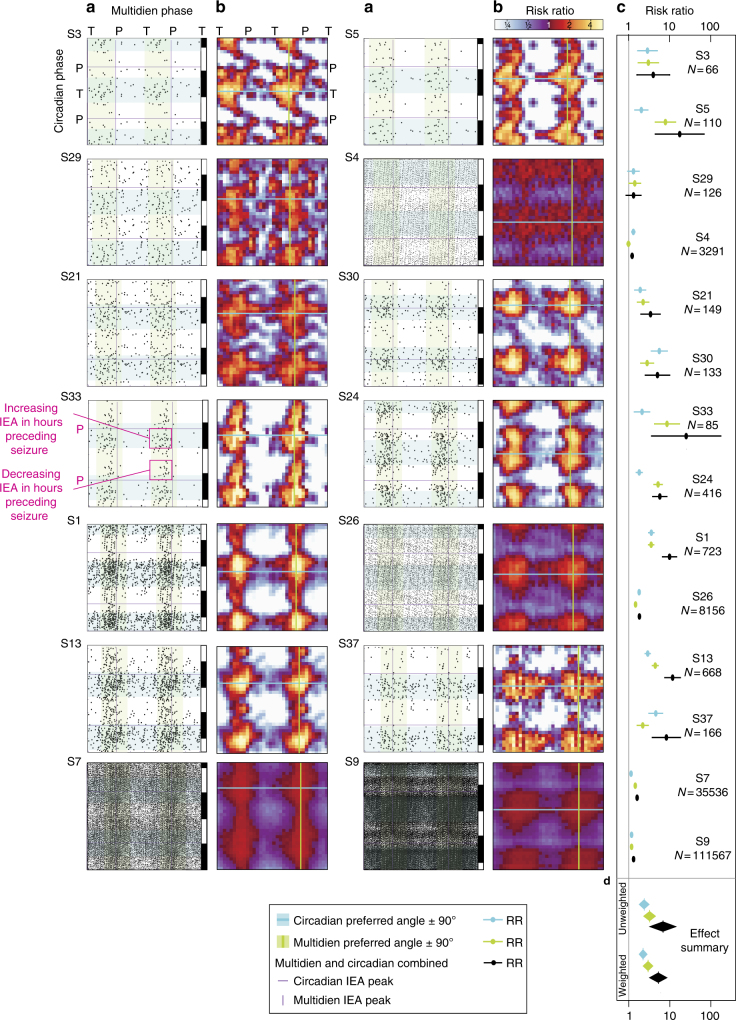
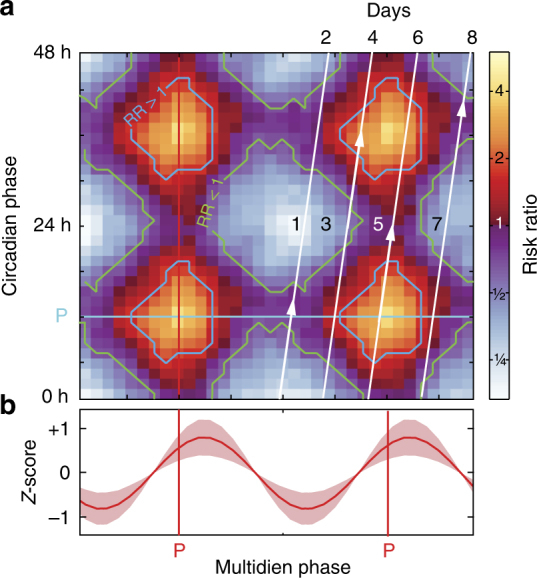
Epilepsy is defined by the seemingly random occurrence of spontaneous seizures. The ability to anticipate seizures would enable preventative treatment strategies. A central but unresolved question concerns the relationship of seizure timing to fluctuating rates of interictal epileptiform discharges (here termed interictal epileptiform activity, IEA), a marker of brain irritability observed between seizures by electroencephalography (EEG). Here, in 37 subjects with an implanted brain stimulation device that detects IEA and seizures over years, we find that IEA oscillates with circadian and subject-specific multidien (multi-day) periods. Multidien periodicities, most commonly 20-30 days in duration, are robust and relatively stable for up to 10 years in men and women. We show that seizures occur preferentially during the rising phase of multidien IEA rhythms. Combining phase information from circadian and multidien IEA rhythms provides a novel biomarker for determining relative seizure risk with a large effect size in most subjects.


Conflict of interest statement

V.R.R. and D.K.-S. have received honoraria from NeuroPace, Inc. for consulting and speaking engagements. E.A.M. is an employee of NeuroPace, Inc. M.O.B. is a part-time employee of the Wyss Center for Bio and Neuroengineering. The authors declare no targeted funding or compensation from NeuroPace, Inc. for this study. The remaining authors declare no competing financial interests.

Figures

Fig. 1
Fig. 1
Representative subject demonstrating circadian and multidien rhythms in IEA, as well as preferential timing of seizures. a RNS System comprising cranially implanted neurostimulator connected to intracranial leads (image used with permission from NeuroPace, Inc.). b EEG showing a single-epileptiform discharge (spike) in channels corresponding to left (e1) and right (e2) hippocampal leads. c EEG recorded 1 week later at the same time of day showing higher count of epileptiform discharges, i.e., higher IEA. Inset magnifies one typical element to show waveform morphology. Hourly (d, cyan inset) and daily (e) fluctuation in IEA in one subject over 2 and 12 months, respectively. Red dots indicate times of seizure occurrence. f Wavelet decomposition revealing two component multidien rhythms with periodicities of 10 and 26 days. Combining all multidien wavelet coefficients reconstructs the daily IEA time-series (gray curve, 2–45 d, Pearson correlation r = 0.93, p = 0). g Corresponding periodogram showing ultradian (12 h), circadian (24 h), and multidien (10 and 26 d) peaks in periodicity. Period length displayed on the x-axis, and power index (square root of spectrogram power) on the y-axis. Horizontal double-arrows show span of corresponding wavelet coefficients included for (f) (peak period ± 33%). h Average normalized amplitude of the circadian rhythm as a function of time of the day showing phase preference of seizures near the trough at 5 PM (n = 74 seizures, mean ± SD in red, p = 10−4, Omnibus test, see Methods section). Black and white rectangles (d, h) represent night (6PM–6AM) and day (6AM–6PM), respectively. i, j Average normalized amplitude of the 10 d and 26 d IEA rhythms as a function of their underlying phase (x-axis, full 360 degrees phase; y-axes have different scales). Seizures demonstrate phase preference for the up-slope of both rhythms (10 and 26 days, n = 66 seizures, mean ± SD in red, p = 0.0002 and p = 0.002, respectively, Omnibus test)
Fig. 2
Fig. 2
Periodograms and peaks of IEA rhythms. a Average periodograms across all subjects (N  = 37) showing ultradian, circadian, and multidien peaks. For better visualization, unsupervised clustering across all subjects revealed three patterns: (i) about weekly-to-biweekly rhythm (peaks at 7.5 and 15 days, N  = 9), (ii) about tri-weekly rhythm (peak at 20 days, N  = 12), and (iii) about monthly rhythm (peak at 26 days, N  = 16). Shading indicates ± 1 SD. b Histograms showing the number of subjects with a peak in the periodogram at a given period. The distributions are similar (p = 0.87, χ2-test) in male (N = 22) and female (N = 15) subjects
Fig. 3
Fig. 3
Circadian timing of peak IEA. a Phase entrainment of peak circadian rhythm to time of day for each subject (N = 37, 85–3478 days, resultant angle and phase-locking value (PLV), p < 0.0001 for all, Omnibus test, see Methods section) grouped into three clusters (group mean angle and PLV in bold, corresponding time as a dot in (bd). Normalized average circadian amplitude (±SD) with peak in the late afternoon (b), early night (c), and early morning (d) were independent of seizure localization (mesial temporal vs. neocortical, p = 0.14, χ2-test) but may represent three chronotypes
Fig. 4
Fig. 4
Phase preference of seizures in relation to underlying IEA rhythm. Seizure timing relative to phase of the underlying circadian (a) or multidien (b) rhythm for each subject shown as the PLV and resultant angle (N = 14; p-values in (c,d), Omnibus test, see Methods section). On average, the PLV was not different (p = 0.63, Wilcoxon test), but the angles were more tightly distributed and closer to the peak for the multidien as compared to the circadian rhythm (p = 0.002, Kuiper two-sample test, see Methods section). For visualization purposes, individual circular histograms of seizure counts (percentage of total count) for circadian (c) and multidien (d) rhythms are shown, ranked according to increasing multidien average phase (vertical bar position). p-values for the Omnibus test shown in Figure. *p < 0.001. Color codes in (a) and (c) are the same as in Fig. 3 and represent hour of the day of peak circadian rhythm. Color codes in (b) and (d) represent peak periodicity of multidien rhythm, illustrating that the preferred multidien phase is similar, regardless of the exact period length. e Feather and polar plots showing stable direction and magnitude of phase preference assessed every 3 months in one subject (S13). Color-coding establishes data correspondence between feather (left) and polar plot (right) and does not refer to color-bars in (b). The annual number of seizures is displayed to show the decrease over years of treatment with the RNS System and the number of seizures included in each calculation
Fig. 5
Fig. 5
Individual risk ratio (RR) maps in the circadian vs. multidien phase-space. a Scatterplots of circadian vs. multidien phase at time of seizures (total number of seizures on the right of (c), N). Note that data have been duplicated on the x and y-axes to emphasize complete cycles. Each dot represents one to a few seizures happening during the same hour. P: peak, T: trough of underlying rhythms also represented with purple lines. The black (night, 6PM–6AM) and white (day, 6AM–6PM) boxes on the right y-axis represent approximate time of the day. Note the lack of correlation between the circadian and multidien angles (i.e., they do not align on a diagonal). Pink boxes in S33 highlight that, for a given multidien phase, IEA could go up or down in the hours before or after a seizure, depending on the circadian phase relative to peak (pink P). b Corresponding density plots representing risk ratio (color-coded logarithmic scale) for bins of 20-degree circadian and multidien phase combination. Each pixel represents the risk of having a seizure at this point in phase-space as compared to the risk of not having a seizure at this point. Green and cyan lines in (b) with corresponding green and cyan shading in (a) (±90°) represent preferred phases of seizures in relation to underlying IEA rhythms (also visible in Fig. 4). In some subjects, seizures can occur at any time of the day if in the at-risk multidien phase (S1, S5, S7, S13, and S24) and, conversely, in other subjects, seizures can occur on any day of the multidien cycle if at specific times of the day (S4, S26, and S37). c Forest plot showing the risk ratio for having a seizure when in-phase vs. anti-phase with the preferred phase of the underlying circadian or multidien rhythm or the combination of the two. d Effect summary for all 14 subjects. Overall, seizure occurrence was best explained by incorporating information about circadian and multidien rhythms
Fig. 6
Fig. 6
Average risk ratio (RR) map in the circadian vs. multidien phase-space. a Average of individual RR maps shown in Fig. 5 after alignment to the preferred phases (“P” in axes labels; red vertical line, multidien; cyan horizontal line, circadian). Blue and green contour lines indicate RR >1 and < 1, respectively, (95% CI excluding RR of one). To illustrate the concept of time-varying seizure risk, white lines depict the hypothetical circular trajectory of a subject with a 24 h circadian and 8-day multidien cycle. Each line covers two circadian cycles and a quarter multidien cycle. When starting on the left line, the subject mostly crosses areas of low seizure RR with the exception of medium RR at times of favored circadian timing (arrowhead). In the second quarter (second line from left), the subject crosses an area where multidien and circadian timing jointly increase seizure RR (arrowhead). In the third quarter (third line from left), the subject stays on an area of increased risk for two circadian cycles by traveling on a vertical band of favored multidien phase (arrowhead). The fourth quarter line joins the bottom of the first line to close the cycle. b Average multidien amplitude (z-scored) and peak position (just right of the preferred phase). Average circadian cycle is not displayed because the preferred phase was too variable across subjects, but circadian time is labeled 0–24–48 h

Comment in

References

    1. Temkin, O. The falling sickness: A history of epilepsy from the Greeks to the beginnings of modern neurology. (Johns Hopkins University Press, 1994).
    1. Duckrow RB, Tcheng TK. Daily variation in an intracranial EEG feature in humans detected by a responsive neurostimulator system. Epilepsia. 2007;48:1614–1620. doi: 10.1111/j.1528-1167.2007.01091.x. - DOI - PubMed
    1. Spencer DC, et al. Circadian and ultradian patterns of epileptiform discharges differ by seizure-onset location during long-term ambulatory intracranial monitoring. Epilepsia. 2016;57:1495–1502. doi: 10.1111/epi.13455. - DOI - PubMed
    1. Karoly PJ, et al. Interictal spikes and epileptic seizures: their relationship and underlying rhythmicity. Brain. 2016;139:aww019–1078. doi: 10.1093/brain/aww019. - DOI - PubMed
    1. Cook MJ, et al. Human focal seizures are characterized by populations of fixed duration and interval. Epilepsia. 2016;57:359–368. doi: 10.1111/epi.13291. - DOI - PubMed

Publication types