. 2018 Jan 8;8(1):73.
doi: 10.1038/s41598-017-17913-x.

LSD1 activation promotes inducible EMT programs and modulates the tumour microenvironment in breast cancer

Affiliations

LSD1 activation promotes inducible EMT programs and modulates the tumour microenvironment in breast cancer

T Boulding et al. Sci Rep. .

Erratum in

Abstract

Complex regulatory networks control epithelial-to-mesenchymal transition (EMT) but the underlying epigenetic control is poorly understood. Lysine-specific demethylase 1 (LSD1) is a key histone demethylase that alters the epigenetic landscape. Here we explored the role of LSD1 in global epigenetic regulation of EMT, cancer stem cells (CSCs), the tumour microenvironment, and therapeutic resistance in breast cancer. LSD1 induced pan-genomic gene expression in networks implicated in EMT and selectively elicits gene expression programs in CSCs whilst repressing non-CSC programs. LSD1 phosphorylation at serine-111 (LSD1-s111p) by chromatin anchored protein kinase C-theta (PKC-θ), is critical for its demethylase and EMT promoting activity and LSD1-s111p is enriched in chemoresistant cells in vivo. LSD1 couples to PKC-θ on the mesenchymal gene epigenetic template promotes LSD1-mediated gene induction. In vivo, chemotherapy reduced tumour volume, and when combined with an LSD1 inhibitor, abrogated the mesenchymal signature and promoted an innate, M1 macrophage-like tumouricidal immune response. Circulating tumour cells (CTCs) from metastatic breast cancer (MBC) patients were enriched with LSD1 and pharmacological blockade of LSD1 suppressed the mesenchymal and stem-like signature in these patient-derived CTCs. Overall, LSD1 inhibition may serve as a promising epigenetic adjuvant therapy to subvert its pleiotropic roles in breast cancer progression and treatment resistance.


Conflict of interest statement

The authors declare that they have no competing interests.

Figures

Figure 1
Figure 1
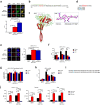
LSD1 is induced in mesenchymal cells and promotes breast cancer EMT markers. (a) LSD1 transcript levels measured by qPCR in MCF-7 cells after incubation with PMA + TGF-β or withdrawal of PMA+TGF-β after 60 h incubation at the indicated time points. Data are expressed as fold change relative to 0 h stimulation or 0 h stimulation withdrawal (n = 3). *Indicates significance relative to 0 h stimulation. (b) Immunofluorescence microscopy was performed on cells fixed and probed with primary anti-LSD1 or anti-Snail antibodies and DAPI. Representative images for each dataset are shown. Graph represents the TNFI values for LSD1 measured using ImageJ to select the nucleus minus background (n > 50 individual cells). (c) The PCC was determined for LSD1 and Snail (n = 40 individual cells). −1 = inverse of colocalization; 0 = no colocalization; +1 = perfect colocalization. TCFI of E-cadherin and vimentin and TNFI of Snail and in MCF-7, MCF-7/PMA+ TGF-β and MDA-MB-231 cells after treatment with either (d) mock and LSD1 siRNA; or (e) vehicle alone and pargyline (n ≥ 30 individual cells). (f) LSD1 H3K4 demethylation activity assay was performed on MCF-7, MCF-7/PMA+ TGF-β, and MDA-MB-231 nuclear extracts in triplicate wells. LSD1 demethylase activity was calculated and graph depicts percentage of activity relative to MCF-7 cells (n = 2). All data represents the mean ±SE. Scale bars = 10 µm. *P < 0.05; **P < 0.01; ***P < 0.001; ****P < 0.0001, Mann-Whitney test.
Figure 2
Figure 2
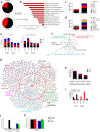
LSD1 selectively targets gene induction programs promoting EMT and CSCs. (a) Induced and repressed probes following treatment with either mock or LSD1 siRNA in MCF-7/PMA+ TGF-β cells. Probes with a log2 (0.5)-fold difference were considered induced or repressed. (b) Induced LSD1-sensitive genes were profiled for enrichment of biological processes and KEGG pathways. The significance of the enrichment of each group is indicated, hypergeometric test. LSD1 ChIP-seq peaks were annotated to: (c) summarised chromatin environments of the nearest Ensembl transcript. Peaks were classified as rRNA, 5′UTR, promoter (<1 kb from TSS), intergenic, intron, exon, pseudo, TTS, ncRNA, or 3′UTR; and (d) summarised CTCF/chromatin states in MCF-7 cells. (e) LSD1 ChIP-seq peaks were grouped by indicated distance to the nearest TSS of induced or repressed genes based on their sensitivity to LSD1 siRNA in MCF-7 and MCF-7/PMA+ TGF-β cells. Graphs represent the percentage of genes that lie within each group. (f) Venn diagram depicting the separation of LSD1 ChIP-seq peaks in MCF-7/PMA+ TGF-β cells. (g) Induced LSD1-sensitive genes with GO or KEGG annotations in indicated pathways. Genes within the circle are direct LSD1 targets, outside the circle are indirect LSD1 targets. (h) LSD1 ChIP-seq-peaks were annotated by indicated distance to the nearest TSS of CSC > NCSC or NCSC > CSC transcripts in MCF-7/PMA+ TGF-β cells. Graphs represent the percentage of genes that lie within each group. Fisher’s exact t test was performed comparing CSCs vs NCSCs and p values are shown for indicated distances. (i) Percent of genes that are LSD1 sensitive or LSD1 insensitive and either expressed CSC > NCSC or NCSC > CSC. Percentage CD44+/CD24 cells as measured by flow cytometry after treatment with vehicle alone, pargyline, mock siRNA or LSD1 siRNA in (j) MCF-7 and MCF-7/PMA+ TGF-β; or (k) MDA-MB-231 cells ±SE (n = 3).
Figure 3
Figure 3
Phosphorylation of LSD1 at serine-111 by PKC-θ regulates its pro-EMT function. (a) Immunofluorescence microscopy was performed on indicated cells fixed and probed with anti-LSD1, anti-PKC-θ and DAPI. Representative images for each dataset are shown. Graph depicts the PCC for LSD1 and PKC-θ (n = 30 individual cells). −1 = inverse of colocalization; 0 = no colocalization; +1 = perfect colocalization. (b) Partial LSD1 amino acid sequence indicating the location of peptides positive for phosphorylation. Red amino acids = NLS region; blue amino acid = serine-111; green bars = location of peptides and are numbered in order of mean signal intensity. (c) Model of LSD1 generated using Phyre2, highlighting the close proximity of the serine-111 phosphorylation site to the positively charged NLS domain (inner box). LSD1 structure is based on PDB code 2V1D and cartoons were created in Pymol. (d) Partial LSD1 amino acid sequence indicating potential PKC-θ phosphorylation motifs near the NLS region (described in). Red amino acids = NLS region; blue amino acids = potential PKC-θ phosphorylation sites. (e) LSD1-s111p TNFI in indicated cell lines (n > 30 individual cells). Representative images for each dataset are shown. (f) Graph indicates LSD1-s111p TNFI after treatment with vehicle alone, BIM or C27 as determined by immunofluorescence microscopy (n > 20 individual cells). (g) LSD1 H3K4 demethylation assay was performed on nuclear extracts from indicated cells after treatment with BIM, C27, or vehicle alone. Graph depicts percentage LSD1 demethylase activity relative to control (n = 2). (h) PCC for LSD1 and Snail after treatment with either BIM, C27, or vehicle alone (n ≥ 10 individual cells). −1 = inverse of colocalization; 0 = no colocalization; +1 = perfect colocalization. (i) LSD1-WT and LSD1-Mut plasmid construct sequences. Blue amino acid = mutation site. (j) Graphs indicate LSD1-s111p TNFI, vimentin TCFI, and Snail TNFI after incubation with LSD1-WT, LSD1-Mut, or vector only as determined by immunofluorescence microscopy (n = 40 individual cells). Scale bars = 10 µM. All data represents the mean ±SE. ns = p > 0.05; *P < 0.05; **P < 0.01; ***P < 0.001; ****P < 0.0001, Mann-Whitney test.
Figure 4
Figure 4
LSD1 and PKC-θ co-binding promotes transcription in mesenchymal cells. Diagram depicts proportion of peaks occupied by PKC-θ in MCF-7/PMA cells, LSD1 in MCF-7/PMA + TGF-β cells, and both PKC-θ and LSD1. LSD1 and PKC-θ ChIP-seq peaks and regions with both LSD1 and PKC-θ peaks were annotated to: (a) summarised chromatin environments of the nearest Ensembl transcript in different cell types. Peaks were classified as rRNA, 5’UTR, promoter (<1 kb from TSS), intergenic, intron, exon, pseudo, TTS, ncRNA or 3′UTR; and (b) summarised CTCF/chromatin states in MCF-7 cells. (c) Percentage of regions bound by LSD1 alone, both LSD1 and PKC-θ, or PKC-θ alone in the indicated gene groups where the number of regions is used as the denominator. (d) Average LSD1, PKC-θ, H3K4me3, and H3K27ac levels around the TSS of LSD1-sensitive genes. Reads are binned by 0.1 kb, ±1.5 kb around TSS. Dashed lines = MCF-7 samples; solid lines = MCF-7/PMA (PKC-θ) or MCF-7/PMA+ TGF-β (LSD1). (e) LSD1, PKC-θ, H3K4me3, H3K27ac, H3K9me3, and H3K27me3 ChIP-seq peaks at JUNB, KLF6, and KLF10 in indicated cell types as shown in the UCSC Genome Browser.
Figure 5
Figure 5
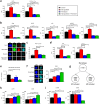
LSD1 is involved in breast cancer growth and is enriched in chemoresistant cells. (a) Western blots of indicated breast cancer cell line total cell extracts probed for LSD1. NPM and histone H3 were loading controls. Copped images are from samples and antibodies processed and run on the same gel. Full-length blot is shown in Supplementary Fig. 6. (b) LSD1 mRNA levels as measured by qPCR in breast cancer cell lines characterised as ER positive and ER negative. Data are expressed as arbitrary copy numbers normalised to PPIA (n = 2). LSD1 expression in: (c) local recurrent and non-recurrent breast carcinomas from GEO dataset GSE4913 (n ≥ 19); (d) primary and secondary locally recurrent breast carcinomas from GEO dataset GSE4913 (n ≥ 9); (e) Immunofluorescence microscopy was performed on matched parental and docetaxel-resistant MCF-7, T47D and MDA-MB-231 cells fixed and probed with anti-ALDH1A1, anti-PKC-θ and anti-LSD1-s111p. Graphs indicate ALDH1A, PKC- θ and LSD1-s111p TNFI and PKC and LSD1-s111p PCC (n = 20 individual cells). −1 = inverse of colocalization; 0 = no colocalization; +1 = perfect colocalization. (f) Tumour growth (mm3) up to 5 weeks post-treatment with indicated treatments (n = 5). Coloured asterisk (*) denotes significance at that time point. (g) Tumours sizes 5 weeks post-treatment from left to right: control, nab-paclitaxel 60 mg/kg, nab-paclitaxel 30 mg/kg, nab-paclitaxel 10 mg/kg, docetaxel 10 mg/kg, and docetaxel 4 mg/kg. Tumours were excised and digested into single cell suspension and then subjected to immunofluorescence microscopy where TNFI was determined for control, nab-paclitaxel 60 mg/kg, and docetaxel 10 mg/kg treated tumours after probing with: (h) anti-EGFR, anti-Snail; or (i) anti-LSD1, or anti-LSD1-s111p (n > 10). All data represents the mean ± SE. *P < 0.05; **P < 0.01; ***P < 0.001; ****P < 0.0001, Mann-Whitney test.
Figure 6
Figure 6
LSD1 inhibition suppresses chemotherapy-induced EMT, CAFs and promotes a M1 macrophage infiltration. Balb/c nude mice were treated with either vector only, nab-paclitaxel 30 mg/kg, phenelzine 40 mg/kg, or nab-paclitaxel 30 mg/kg + phenelzine 40 mg/kg. Tumours were excised, cut in half, digested with collagenase IV into single cell suspensions and immunofluorescence microscopy was performed on pooled samples and TNFI or TCFI was determined after probing with: (a) anti-LSD1, anti-LSD1-s111p; or (b) anti-Snail, anti-EGFR, anti-CSV, anti-ABCB5, or anti-ALDH1A1 (n ≥ 15 individual cells from 5 pooled). (c) PCC was determined for FAP and LSD1 (n = 20 individual cells from 5 pooled). −1 = inverse of colocalization; 0 = no colocalization; +1 = perfect colocalization. (d) Graphs indicate FAP TNFI and CCL2 TCFI (n = 20 individual cells from 5 pooled). Representative image is shown for each data set. Scale bars = 10 µM. (e) Graph represents the total number of F4/80+ cells in individual tumours for each group as determined by flow cytometry (n ≥ 4). (f) TCFI of F4/80 (n = 60 individual cells from 5 pooled). Representative image is shown for each data set. Scale bars = 20 µM. (g) All cells were probed with anti-F4/80 and either anti-CCR7, anti-CD38, anti- CD206 or anti-EGR2. Cells that were determined to be F4/80-positive were then analyzed for their expression of M1- or M2-activated macrophage markers. TCFI was then determined for (h) CCR7, CD38; (i) CD206 and EGR2 (n ≥ 40 individual cells from 5 pooled). Black = control; red = nab-paclitaxel; blue = phenelzine; green = nab-paclitaxel + phenelzine. All data represents the mean ± SE. *P < 0.05; **P < 0.01; ***P < 0.001; ****P < 0.0001, Mann-Whitney test.
Figure 7
Figure 7
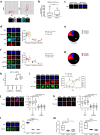
LSD1 correlates with MBC CTC mesenchymal- and CSC-like characteristics. (a) CTCs were isolated from MBC patient liquid biopsies through double expression of cytokeratin (CK) and vimentin (VIM) and absence of CD45 expression on the DEPArray. Representative image from DEPArray and workflow shown. (b) CD45/VIM+/CK+ CTC cell counts were determined in two samples collected six weeks apart (sample 1 and sample 2, respectively) (n = 10). (c) Immunofluorescence microscopy was performed on all fixed CTCs collected from 10 MBC patients at each time point and compared to normal donors. Representative images showing DAPI staining in CTCs is shown (n = 5 healthy donors and 10 MBC patients). (d) CTCs were separated based on LSD1-s111p TNFI relative to negative controls, primary and secondary antibody controls as well as healthy donor expression into phenotypes 1, 2 and 3 (high, moderate and low expression, respectively) and Snail TNFI and CSV TCFI were determined (n = 10). Representative images are shown for each dataset. (e) Average percentage of phenotype 1, 2 and 3 cells (n = 10). (f) CTCs were separated based on LSD1 TNFI relative to negative controls, primary and secondary antibody controls as well as healthy donor expression into phenotypes 1, 2 and 3 (high, moderate and low expression, respectively) and ALDH1A TNFI and ABCB5 TNFI were determined (n = 10). Representative image is shown for each dataset. (g) Average percentage of phenotype 1, 2 and 3 cells (n = 10). (h) Graph depicts the PCC for LSD1 and ALDH1A (n = 10). −1 = inverse of colocalization; 0 = no colocalization; +1 = perfect colocalization. (i) Graph depicts LSD1-s111p TNFI, CSV TCFI and CD45/VIM+/CK+ CTC cell count in five samples collected at indicated time points. Representative images are shown for each time point (n = 1 patient). Isolated CTCs were treated with either vehicle alone, pargyline or phenelzine and then immunofluorescence microscopy or qPCR was performed. Total florescence intensity of CSV and LSD1-s111p and Snail after treatment with (j) pargyline; or (k) phenelzine (n > 75 cells from 10 patients). (l) ALDH1 TNFI after treatment with pargyline or phenelzine (n = 20 cells from 10 patients). (m) VIM and CD44 mRNA transcript levels after treatment with pargyline or phenelzine (n = 10 pooled). Scale bars = 10 μM. ns = p > 0.05; *P < 0.05; **P < 0.01; ***P < 0.001; ****P < 0.0001, Mann-Whitney test.

Similar articles

Cited by

References

    1. Thiery JP, Acloque H, Huang RY, Nieto MA. Epithelial-mesenchymal transitions in development and disease. Cell. 2009;139:871–890. doi: 10.1016/j.cell.2009.11.007. - DOI - PubMed
    1. Lamouille S, Xu J, Derynck R. Molecular mechanisms of epithelial-mesenchymal transition. Nature reviews. Molecular cell biology. 2014;15:178–196. doi: 10.1038/nrm3758. - DOI - PMC - PubMed
    1. De Craene B, Berx G. Regulatory networks defining EMT during cancer initiation and progression. Nat Rev Cancer. 2013;13:97–110. doi: 10.1038/nrc3447. - DOI - PubMed
    1. Mani SA, et al. The epithelial-mesenchymal transition generates cells with properties of stem cells. Cell. 2008;133:704–715. doi: 10.1016/j.cell.2008.03.027. - DOI - PMC - PubMed
    1. O’Brien CA, Kreso A, Jamieson CHM. Cancer Stem Cells and Self-renewal. Clinical Cancer Research. 2010;16:3113–3120. doi: 10.1158/1078-0432.ccr-09-2824. - DOI - PubMed

Publication types

MeSH terms