. 2018 Jan 8;8(1):85.
doi: 10.1038/s41598-017-18391-x.

Genomic diversity and distribution of Bifidobacterium longum subsp. longum across the human lifespan

Affiliations

Genomic diversity and distribution of Bifidobacterium longum subsp. longum across the human lifespan

Toshitaka Odamaki et al. Sci Rep. .

Abstract

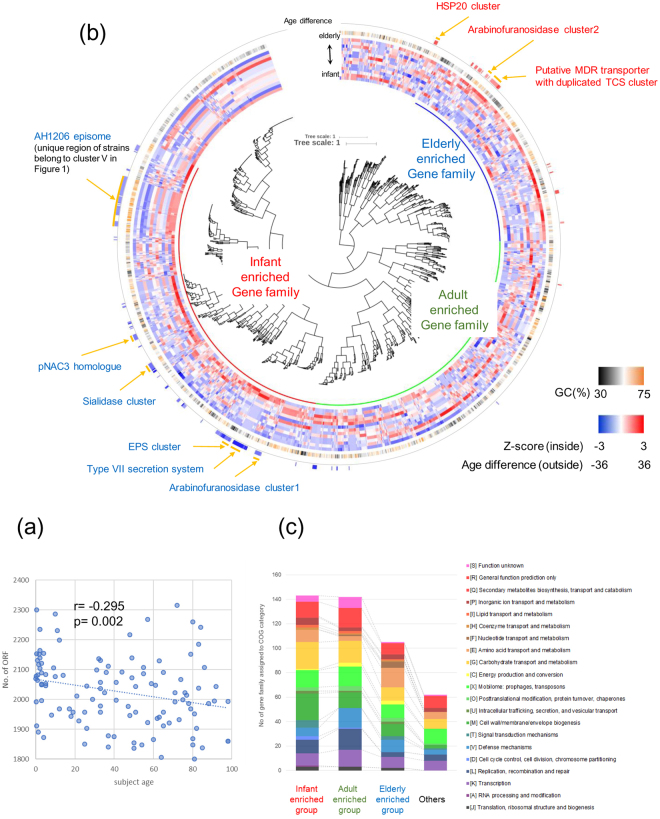
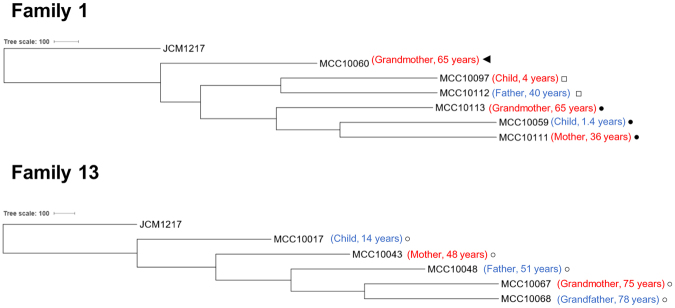
Bifidobacterium longum subsp. longum represents one of the most prevalent bifidobacterial species in the infant, adult and elderly (human) gut. In the current study, we performed a comparative genome analysis involving 145 B. longum representatives, including 113 B. longum subsp. longum strains obtained from healthy Japanese subjects aged between 0 and 98 years. Although MCL clustering did not reveal any correlation between isolated strains and subject age, certain characteristics appear to be more prevalent among strains corresponding to specific host ages, such as genes involved in carbohydrate metabolism and environmental response. Remarkably, a substantial number of strains appeared to have been transmitted across family members, a phenomenon that was shown not to be confined to mother-infant pairs. This suggests that the ubiquitous distribution of B. longum subsp. longum across the human lifespan is at least partly due to extensive transmission between relatives. Our findings form a foundation for future research aimed at unraveling the mechanisms that allow B. longum strains to successfully transfer between human hosts, where they then colonize and persist in the gut environment throughout the host's lifespan.


Conflict of interest statement

Six authors, T.O., K.K., E.M., K. Y., A.H. and J.z.X., are employees of Morinaga Milk Industry Co., Ltd.

Figures

Figure 1
Figure 1
Distribution of gut microbiota in Japanese subjects. (a) HCL clustering based on the detection rate of 871 OTUs at species level found in faecal samples of 453 healthy Japanese subjects between the ages of 0 and 104 years. The Heat map displays the detection rate in each age-segmented group (see Table 1) from infants to elderly ordered from inner to outer circles. A predominant cluster of OTUs determined by HCL clustering and composed of 59 species is also indicated. (b) Enlarged view of the predominant cluster is depicted in Fig. 1a. The three species showing the highest prevalence rate (>50%) in each segmented age are enclosed by a solid line
Figure 2
Figure 2
MCL clustering of B. longum strains. MCL clustering based on the open reading frame (ORF) content of 113 novel B. longum subsp. longum isolates obtained from healthy Japanese subjects (age range between 0 and 98 years), plus those of 32 publicly available B. longum representatives. Strain names are colour-coded based on the MCL computed clusters. The circles, from outside to inside, indicate subject age, number of ORFs per genome and, where applicable, family origin of strains (as indicated by similar symbols).
Figure 3
Figure 3
Genes enriched in B. longum subsp. longum strains isolated from subjects of varying age. (a) Correlation analysis with relative trendline computed between ORF number of B. longum subsp. longum strains and age of subject from whom each strain was isolated. (b) HCL clustering based on the detection rate of gene families across each age segmented group. From outer to inner circle a circular heatmap represents gene families significantly enriched in strains isolated from younger or older subjects, G + C % of the gene family and the computed detection rate z-scores of gene families in each age segmented group. (c) Bar chart showing the COG classification of genes detected in each age cluster in panel b.
Figure 4
Figure 4
Gene clusters enriched in younger subjects. Locus maps display the genetic organization of clusters enriched in younger subjects. Reference strain name is indicated in parenthesis and genes are colored based on predicted function (uncolored genes represent hypothetical proteins). (a) Comparison of three types of sialidase clusters observed in our dataset with the corresponding reference strain indicated. (b) Locus map of the arabinofuranosidase cluster 1 detected in our dataset. Red outer boundary indicates the glycoside hydrolase predicted as extracellular. (c) Locus map of the exopolysaccharide biosynthesis cluster where homologues are located on the same contig in five out of 17 strains. (d) Plasmid pNAC3 homologue and (e) Region encoding a predicted Type VII secretion system.
Figure 5
Figure 5
Gene clusters enriched in elderly subjects. Locus maps showing the genetic organization of clusters enriched in elderly subjects. Reference strain name is indicated in parenthesis and genes are colored based on the predicted functions (uncolored genes are predicted to encode hypothetical proteins). (a) Locus map of the arabinofuranosidase cluster 2. All glycoside hydrolases shown as red outer boundary are predicted to be extracellular enzymes. (b) Putative MDR transporter with duplicated TCS cluster and (c) HSP20 cluster.
Figure 6
Figure 6
Cladogram of strains transmitted across three generations. Phylogenetic tree representing the relationships between five strains putatively transmitted across three generations. The tree was calculated based on the nucleotide sequence of 642 single-core gene families among 145 B. longum strains analysed in this study (see Supplementary Table S5). B. longum subsp. longum JCM 1217 T was used as an outgroup. Isolation source for each strain is shown in parenthesis (blue: male; red: female). Same symbols indicate strains predicted to be transmitted between family members.

References

    1. Ventura M, Turroni F, Motherway MOC, MacSharry J, van Sinderen D. Host-microbe interactions that facilitate gut colonization by commensal bifidobacteria. Trends Microbiol. 2012;20:467–476. doi: 10.1016/j.tim.2012.07.002. - DOI - PubMed
    1. Tojo R, et al. Intestinal microbiota in health and disease: Role of bifidobacteria in gut homeostasis. World J Gastroenterol. 2014;20:15163–15176. doi: 10.3748/wjg.v20.i41.15163. - DOI - PMC - PubMed
    1. Ventura M, et al. Genome-scale analyses of health-promoting bacteria: probiogenomics. Nat. Rev. Microbiol. 2009;7:61–71. doi: 10.1038/nrmicro2047. - DOI - PubMed
    1. Fukuda S, et al. Bifidobacteria can protect from enteropathogenic infection through production of acetate. Nature. 2011;469:543–547. doi: 10.1038/nature09646. - DOI - PubMed
    1. O’Connell Motherway M, et al. Functional genome analysis of Bifidobacterium breve UCC2003 reveals type IVb tight adherence (Tad) pili as an essential and conserved host-colonization factor. Proc. Natl. Acad. Sci. USA. 2011;108:11217–22. doi: 10.1073/pnas.1105380108. - DOI - PMC - PubMed

Publication types

MeSH terms

LinkOut - more resources