. 2018 Feb;20(2):127-134.
doi: 10.1038/s41556-017-0013-z. Epub 2018 Jan 8.

Defining murine organogenesis at single-cell resolution reveals a role for the leukotriene pathway in regulating blood progenitor formation

Affiliations

Defining murine organogenesis at single-cell resolution reveals a role for the leukotriene pathway in regulating blood progenitor formation

Ximena Ibarra-Soria et al. Nat Cell Biol. 2018 Feb.

Abstract

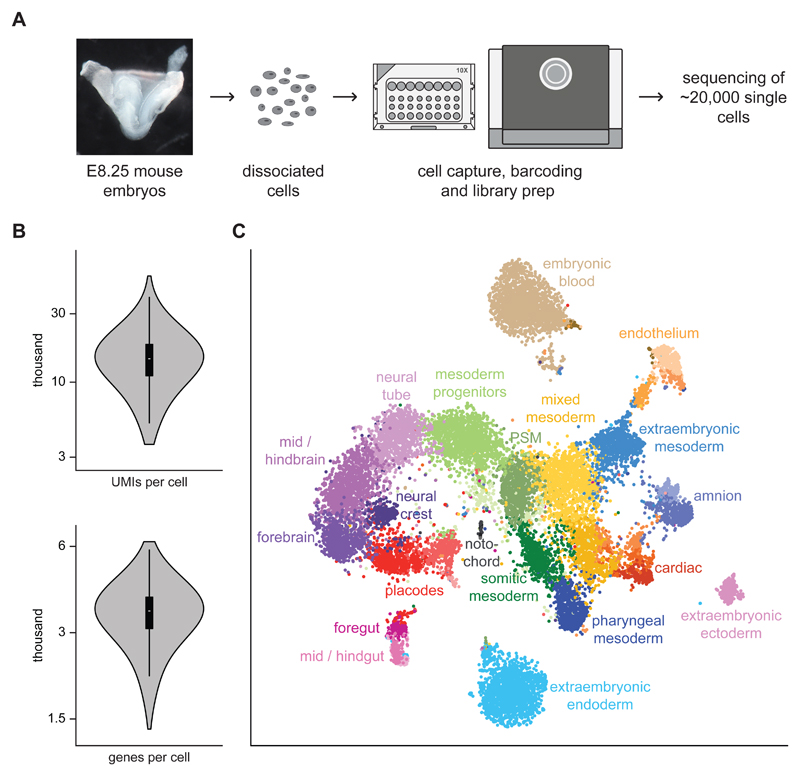
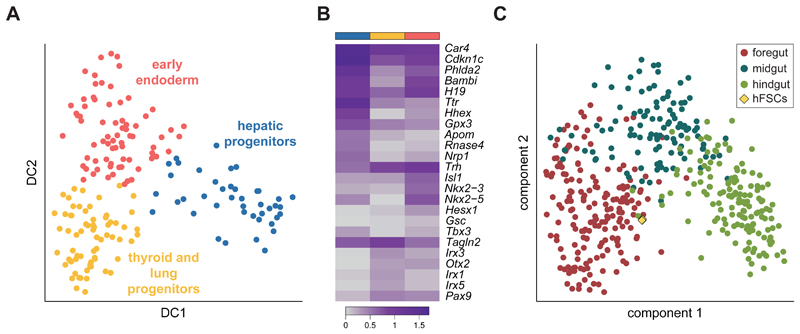
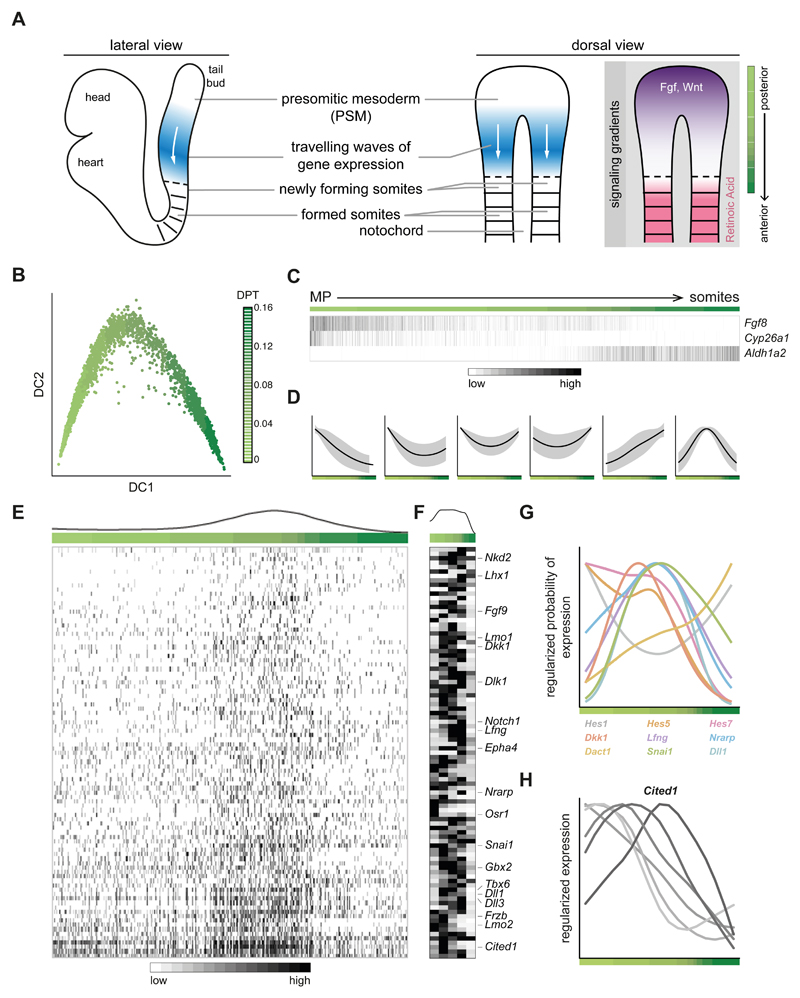
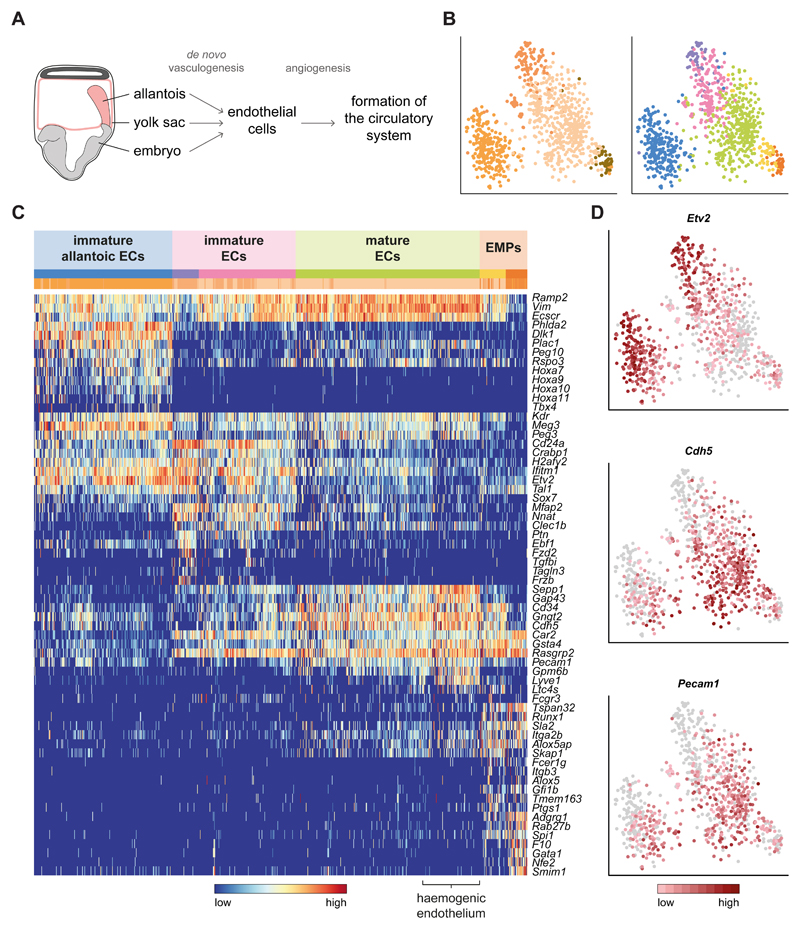
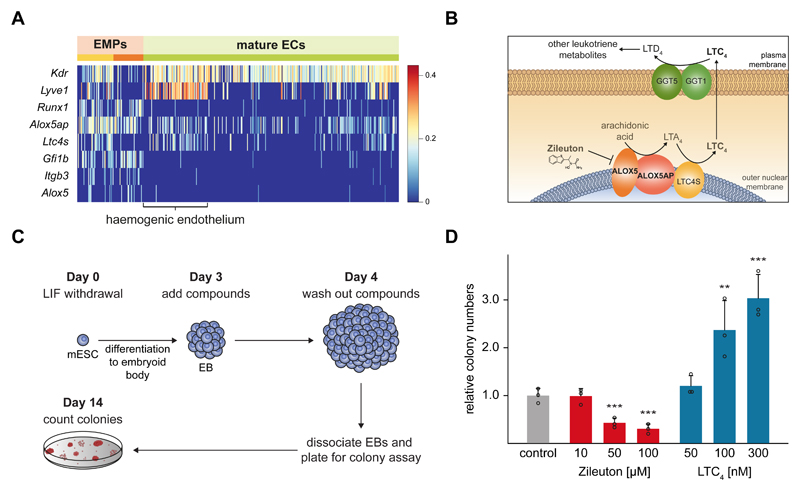
During gastrulation, cell types from all three germ layers are specified and the basic body plan is established 1 . However, molecular analysis of this key developmental stage has been hampered by limited cell numbers and a paucity of markers. Single-cell RNA sequencing circumvents these problems, but has so far been limited to specific organ systems 2 . Here, we report single-cell transcriptomic characterization of >20,000 cells immediately following gastrulation at E8.25 of mouse development. We identify 20 major cell types, which frequently contain substructure, including three distinct signatures in early foregut cells. Pseudo-space ordering of somitic progenitor cells identifies dynamic waves of transcription and candidate regulators, which are validated by molecular characterization of spatially resolved regions of the embryo. Within the endothelial population, cells that transition from haemogenic endothelial to erythro-myeloid progenitors specifically express Alox5 and its co-factor Alox5ap, which control leukotriene production. Functional assays using mouse embryonic stem cells demonstrate that leukotrienes promote haematopoietic progenitor cell generation. Thus, this comprehensive single-cell map can be exploited to reveal previously unrecognized pathways that contribute to tissue development.


Conflict of interest statement

Competing financial interests

The authors declare no competing financial interests.

Figures

Fig. 1
Fig. 1. Single-cell RNA-seq of whole mouse E8.25 embryos identifies 20 major cell types.
A) E8.25 whole mouse embryos were dissociated and processed with the 10X genomics platform to capture single cells and produce libraries for RNA sequencing. A representative image of the sequenced embryos is shown. B) Violin plots indicating the number of UMIs and genes obtained per cell. A boxplot is shown on the inside (center line, median; box limits, upper and lower quartiles; whiskers, 1.5x interquartile range; n = 19,396 cells). C) t-SNE plot of all the cells that passed quality control (19,396) computed from highly variable genes; the first two dimensions are shown. Cells with similar transcriptional profiles were clustered into 33 different groups, as indicated by the different colours. Each cluster was annotated based on the expression of marker genes into 20 major different cell types. Several cell types are composed of two or more clusters. PSM = presomitic mesoderm.
Fig. 2
Fig. 2. Sub-structure within the E8.25 mouse foregut.
A) Diffusion map of the foregut endoderm cells (Fig. 1C; n = 185); the first two diffusion components (DC) are shown. The different colours correspond to three sub-clusters detected by the k-branch algorithm. Based on their expression pattern (see panel B), likely identities of early endoderm cells (red), hepatic progenitors (blue) and thyroid and lung progenitors (yellow) were assigned. B) Heatmap showing the average expression of the top 5 most differentially expressed genes in each of the three sub-clusters (indicated by the coloured bars on top) along with well-characterised marker genes. The colour gradient is log10(normalised counts + 1). C) Principal Component Analysis of the foregut, midgut and hindgut cells from the mouse (circles; n = 437) and human pluripotent stem cell derived foregut progenitor cells (diamonds; n = 3); the first two components are shown. The human samples are closest to the mouse foregut cells.
Fig. 3
Fig. 3. Oscillating patterns of gene expression during somitogenesis can be inferred from scRNA-seq data.
A) Schematic of mouse somitogenesis, which proceeds along the anteroposterior (AP) axis. From the tail-bud (posterior) extends the presomitic mesoderm (PSM) which gives rise to somites (anterior). On the right, travelling waves of gene expression of oscillatory genes are shown along with signalling gradients on the AP axis; FGF and Wnt are posterior-high while retinoic acid (RA) has the opposite pattern. B) Diffusion map of the cells from the mesoderm progenitors (MP), presomitic and somitic mesoderm clusters (n = 2999), ordered based on the expression of genes correlated with Fgf8 expression; the first two diffusion components (DC) are shown. The colour gradient indicates the trajectory from MP to somites as a pseudo-space measurement. C) Heatmap of the genes involved in establishing signalling gradients. Aldh1a2 is the enzyme that synthesises RA while Cyp26a1 degrades RA. Cells have been ordered in pseudo-space on the x-axis. Each gene is regularised so that expression values are within [0,1]. D) Expression changes along the pseudo-space trajectory can be clustered into six groups, one of which (last) shows a wave-like pattern consistent with oscillatory expression. E) Heatmap of the expression of all genes in the last cluster from D. Cells have been ordered in pseudo-space on the x-axis. Each gene is regularised so that expression values are within [0,1]. F) Representative heatmap of the same genes on the dissected PSM of an embryo that was split into five segments from posterior to anterior, as schematised at the far right in A. Six biological replicates were analysed, all with similar results; the other five replicates are presented in Supplementary Fig. 3B. G) Regularised logistic fit of the expression across the pseudo-space for genes with well-characterised oscillatory expression. Most show a wave-like pattern. H) Expression pattern of Cited1 in dissected segments of PSM from most posterior to most anterior, for six different biological replicates. The gene shows a wave-like pattern, and different embryos peak at different regions of the PSM.
Fig. 4
Fig. 4. The endothelium can be subdivided based on maturity and location of origin.
A) Schematic diagram of how endothelial cells (ECs) and the circulatory system are formed in the embryo. B) t-SNE plot of the cells in the four endothelial clusters (n = 871). Left: original clusters coloured as in Fig. 1C. Right: colours correspond to the redefined subclusters. The first two dimensions are shown. C) Heatmap of the top 5 differentially expressed genes across subclusters, along with well-characterised genes for the endothelium. Coloured bars indicate the new cluster (top) and original cluster (bottom) they belong to. Each gene is regularised so that expression values are within [0,1]. D) Expression patterns of the endothelial markers Etv2, Cdh5 and Pecam1 on the t-SNE from B. The colour gradient is log10(normalised counts + 1). ECs: endothelial cells; EMPs: erythroid-myeloid progenitors.
Fig. 5
Fig. 5. The leukotriene biosynthesis pathway drives blood formation.
A) Heatmap showing the characteristic genes of erythro-myeloid progenitors (EMPs) and haemogenic endothelium within the non-allantoic mature endothelial cell (EC) cluster (Fig. 4C). The colour gradient is log10(normalised counts + 1). See also Supplementary Fig. 4A. B) Schematic diagram of the leukotriene biosynthesis pathway, highlighting the functions of ALOX5, ALOX5AP and the position of the leukotriene C4 (LTC4). C) Experimental setup for embryonic stem cell (ESC) differentiation to embryoid bodies (EBs) and haematopoietic colony formation assays. D) Bar plot showing the fold change in number of colonies relative to carrier control when EBs were treated with the indicated concentrations of Zileuton or LTC4 for 24 hours. Bars represent the mean plus standard deviation of n=3 biological replicates. The individual data points are shown as open circles. Statistically significant changes compared to controls were tested with a one-tail Student’s t test (p-value = 0.004 for Zileuton-50µM; 0.002 for Zileuton-100µM; 0.027 for LTC4-100µM; 0.007 for LTC4-300µM;).

References

    1. Kaufman M, Bard J. The Anatomical Basis of Mouse Development. Academic Press; San Diego, CA: 1999.
    1. Wang Y, Navin NE. Advances and applications of single-cell sequencing technologies. Molecular cell. 2015;58:598–609. - PMC - PubMed
    1. Grapin-Botton A. Endoderm specification. In: The Stem Cell Research Community, editor. StemBook. StemBook; 2008.
    1. Inoue-Yokoo T, Tani K, Sugiyama D. Mesodermal and hematopoietic differentiation from ES and iPS cells. Stem cell reviews. 2013;9:422–434. - PubMed
    1. Tang K, Peng G, Qiao Y, Song L, Jing N. Intrinsic regulations in neural fate commitment. Development, growth & differentiation. 2015;57:109–120. - PubMed

Publication types

MeSH terms

Substances