

Associations of Tumor PD-1 Ligands, Immunohistochemical Studies, and Textural Features in 18F-FDG PET in Squamous Cell Carcinoma of the Head and Neck
- PMID: 29311707
- PMCID: PMC5758832
- DOI: 10.1038/s41598-017-18489-2
Associations of Tumor PD-1 Ligands, Immunohistochemical Studies, and Textural Features in 18F-FDG PET in Squamous Cell Carcinoma of the Head and Neck
Abstract
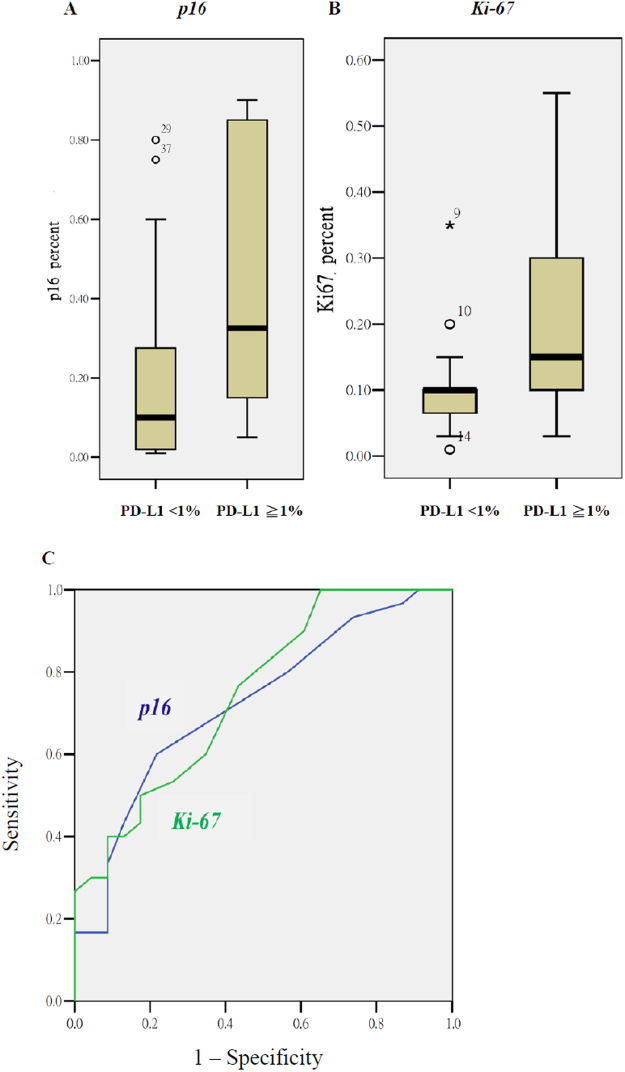
To know tumor PD-L1 expression through IHC or the FDG-PET related radiomics, we investigated the association between programmed cell death protein 1 ligand (PD-L1) expression and immunohistochemical (IHC) biomarkers or textural features of 18F-fluoro-2-deoxdeoxyglucose positron emission tomography (18F-FDG PET) in 53 oropharyngeal or hypopharyngeal cancer patients who were ready to undergo radiotherapy-based treatment. Differences in textural features or biomarkers between tumors with and without PD-L1 expression were tested using a Mann-Whitney U test. The predicted values for PD-L1 expression were examined using logistic regression analysis. The mean percentages of tumor PD-L1 expression were 6.2 ± 13.5. Eighteen tumors had PD-L1 expression ≥5%, whereas 30 tumors ≥1%. Using a 5% cutoff, the p16 staining percentage and the textural index of correlation were two factors associated with PD-L1 expression. The odds ratios (ORs) were 17.00 (p = 0.028) and 0.009 (p = 0.015), respectively. When dichotomizing PD-L1 at 1%, the p16 and Ki-67 staining percentages were two predictors for PD-L1 expression with ORs of 11.41 (p = 0.035) and 757.77 (p = 0.045). p16 and Ki-67 staining percentages and several PET/CT-derived textural features can provide supplemental information to determine tumor PD-L1 expression in HNCs.
Conflict of interest statement
The authors declare that they have no competing interests.
Figures

References
Publication types
MeSH terms
Substances
LinkOut - more resources
Full Text Sources
Other Literature Sources
Medical
Molecular Biology Databases
Research Materials
