. 2018 Feb;21(2):228-239.
doi: 10.1038/s41593-017-0047-3. Epub 2018 Jan 8.

TDP-43 pathology disrupts nuclear pore complexes and nucleocytoplasmic transport in ALS/FTD

Affiliations

TDP-43 pathology disrupts nuclear pore complexes and nucleocytoplasmic transport in ALS/FTD

Ching-Chieh Chou et al. Nat Neurosci. 2018 Feb.

Abstract

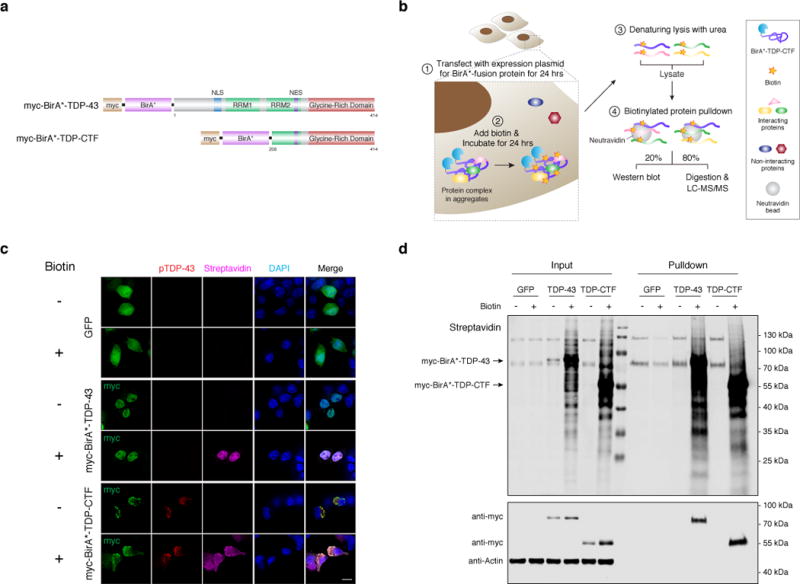
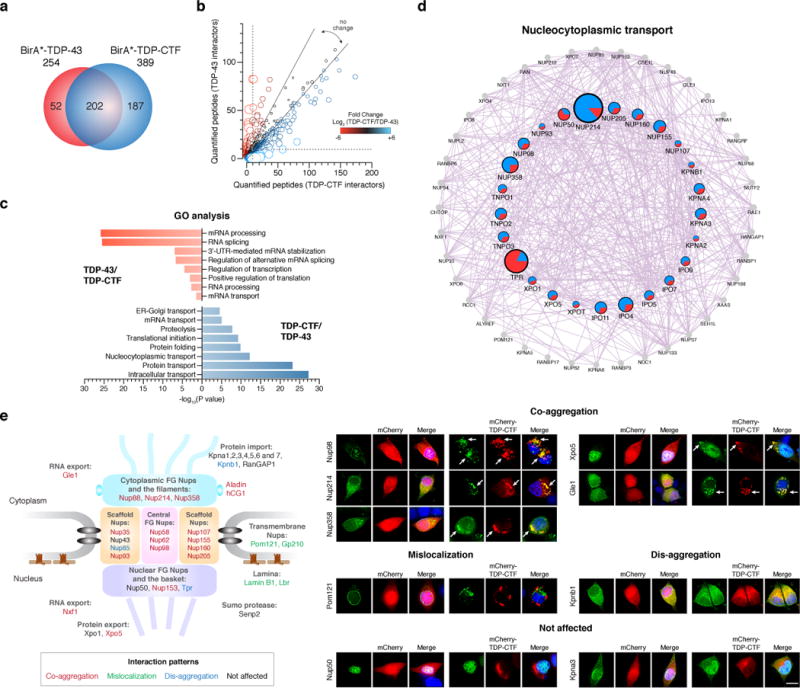
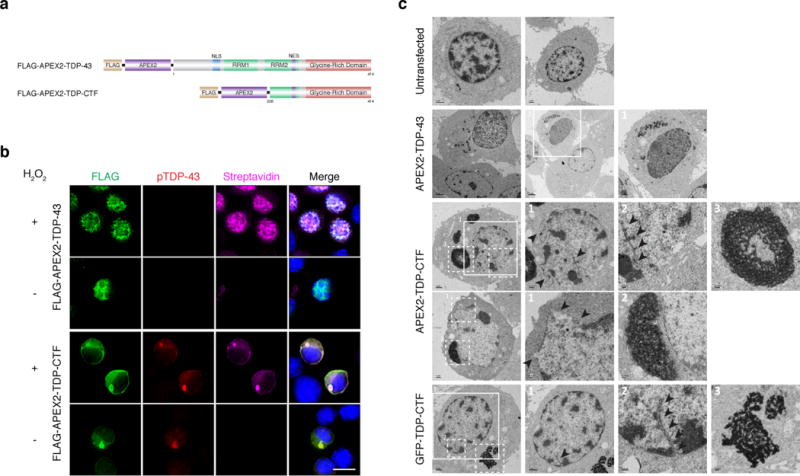
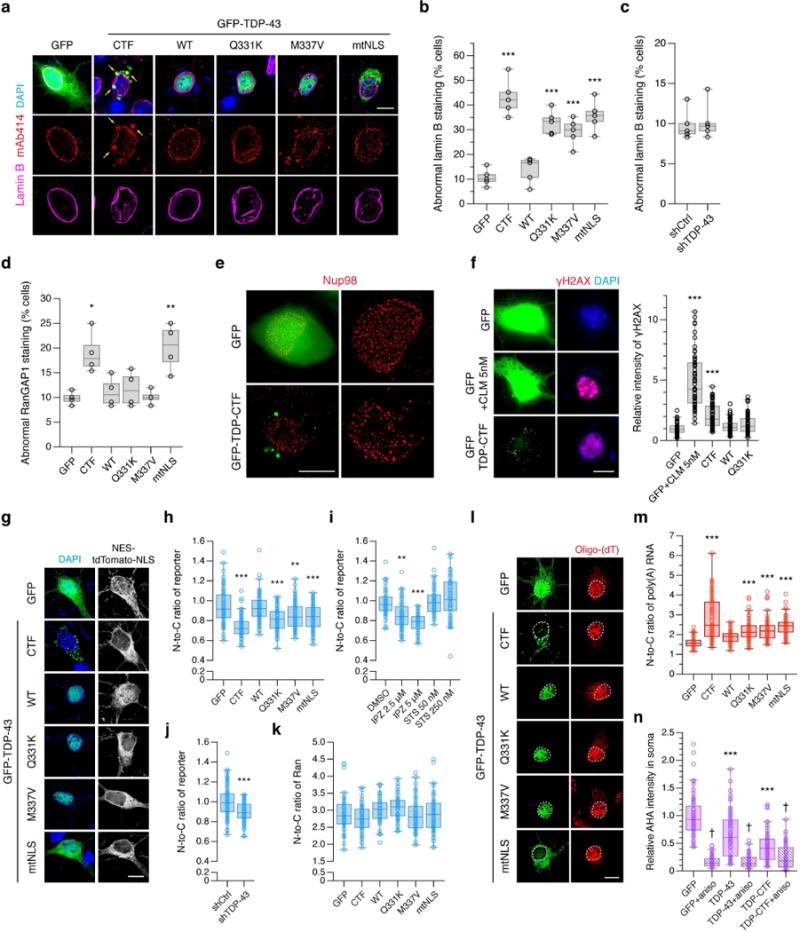
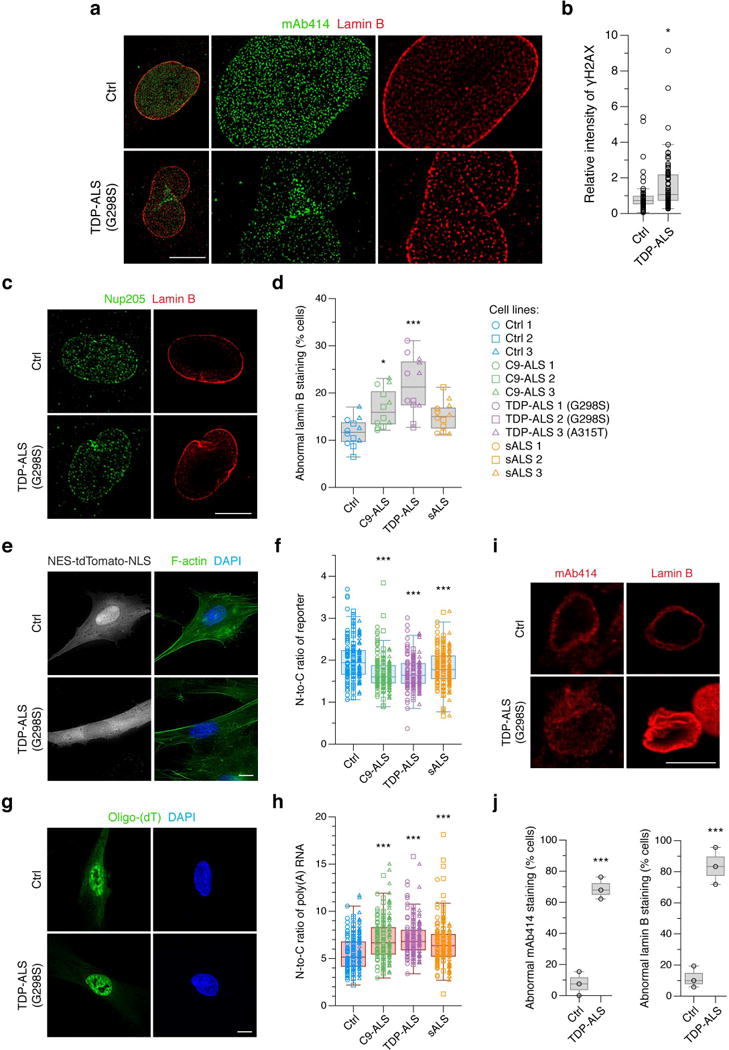
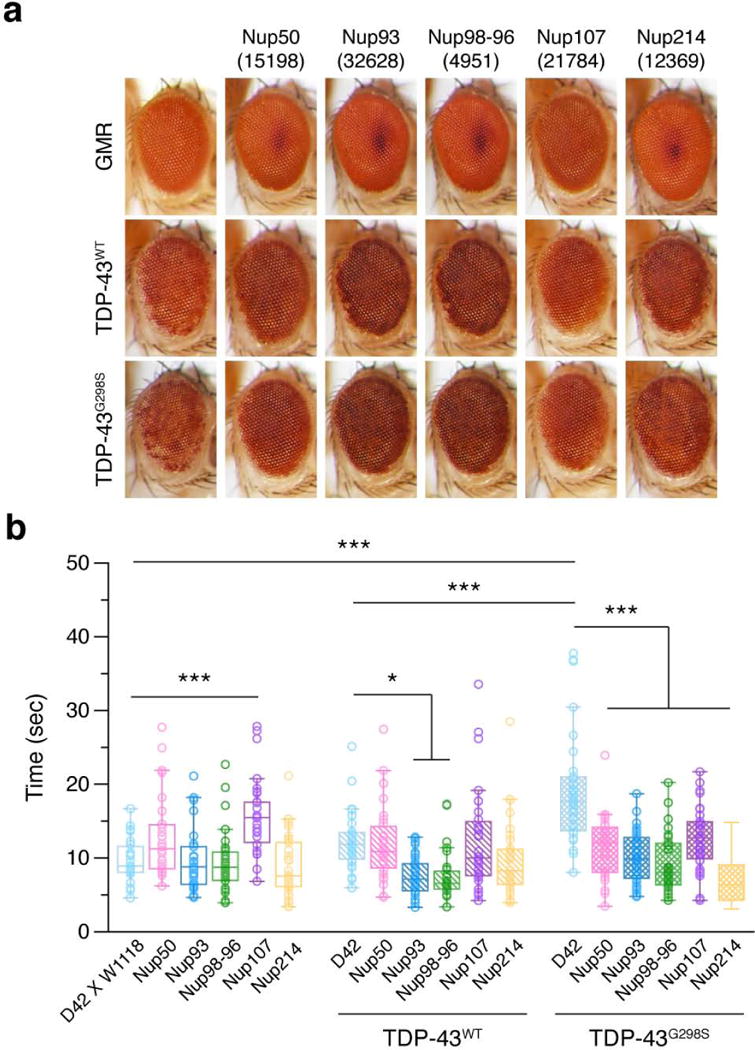
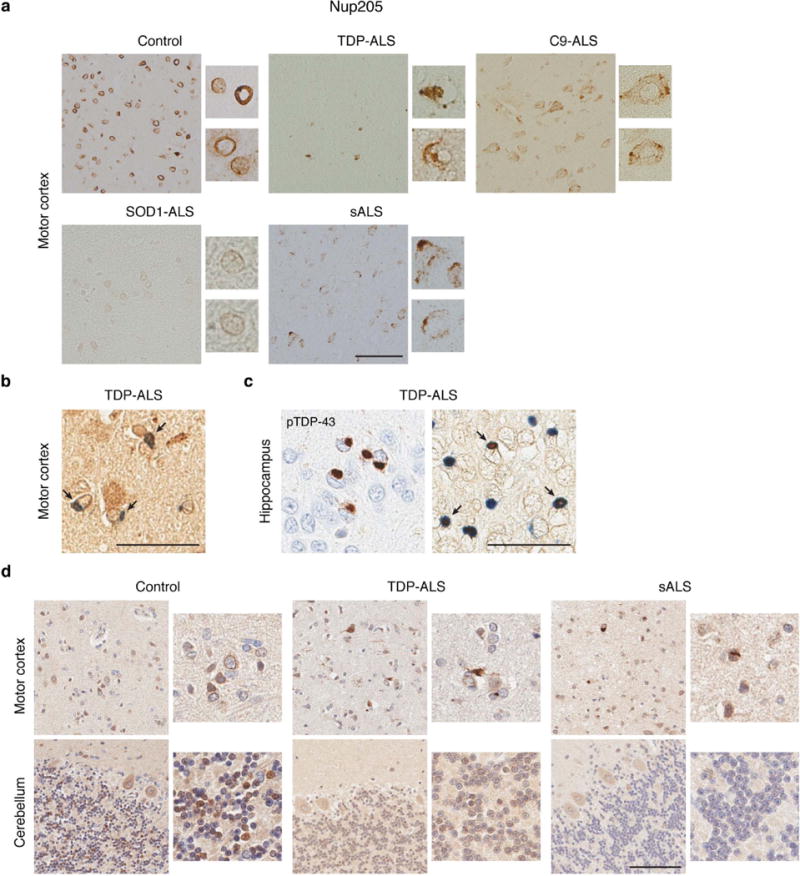
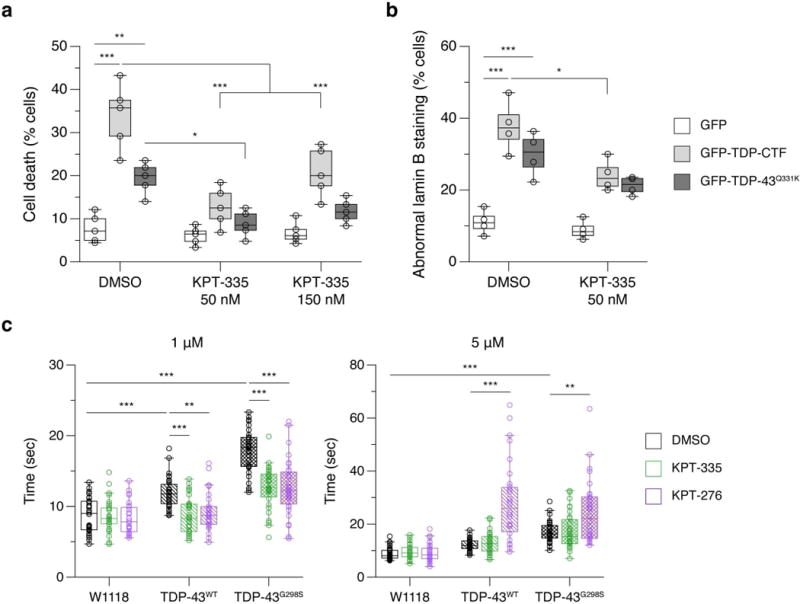
The cytoplasmic mislocalization and aggregation of TAR DNA-binding protein-43 (TDP-43) is a common histopathological hallmark of the amyotrophic lateral sclerosis and frontotemporal dementia disease spectrum (ALS/FTD). However, the composition of aggregates and their contribution to the disease process remain unknown. Here we used proximity-dependent biotin identification (BioID) to interrogate the interactome of detergent-insoluble TDP-43 aggregates and found them enriched for components of the nuclear pore complex and nucleocytoplasmic transport machinery. Aggregated and disease-linked mutant TDP-43 triggered the sequestration and/or mislocalization of nucleoporins and transport factors, and interfered with nuclear protein import and RNA export in mouse primary cortical neurons, human fibroblasts and induced pluripotent stem cell-derived neurons. Nuclear pore pathology is present in brain tissue in cases of sporadic ALS and those involving genetic mutations in TARDBP and C9orf72. Our data strongly implicate TDP-43-mediated nucleocytoplasmic transport defects as a common disease mechanism in ALS/FTD.


Conflict of interest statement

Competing Financial Interests:

The authors declare no competing financial interests.

Figures

Figure 1
Figure 1. A modified BioID method identifies the composition of pathological detergent-insoluble TDP-43 aggregates
a, Domain structures of myc-BirA* fusion constructs with human full-length TDP-43 and TDP-CTF protein. b, Schematic for the proximity-dependent biotinylation and identification of proteins associated with myc-BirA*-TDP-CTF. c, Anti-myc staining shows nuclear myc-BirA*-TDP-43 and cytoplasmic aggregates of myc-BirA*-TDP-CTF (green) that are positive for pTDP-43 (S409/410) (red) and biotin (magenta). d, Western blot analysis of biotinylated proteins in lysates and after pulldown with neutravidin beads. These experiments were repeated three times with similar results. Uncropped blots are provided in Supplementary Figure 17. Scale bar: 10 μm.
Figure 2
Figure 2. Pathological TDP-43 aggregates contain components of the nucleocytoplasmic transport machinery
a, Mass spectrometry analysis of proximity-biotinylated proteins associated with BirA*-TDP-43 and BirA*-TDP-CTF. The 202 proteins present in both datasets accounted for 80% of the TDP-43 and 52% of the TDP-CTF associated proteome. b, Mapping the number of identified peptide spectra matches (PSMs) for the interacting protein of TDP-43 and TDP-CTF (circle). The relative abundance ratio (log2-fold change) between TDP-CTF and TDP-43 associated proteome is shown by circle size and color. Positive values indicate predominant association with TDP-CTF (blue), and negative values with TDP-43 (red). The dotted line indicates the cut-off threshold. c, Gene ontology (GO) analysis of proteins preferentially associated with TDP-43 or TDP-CTF. P-values indicate the probability of seeing a number of proteins annotated to a particular GO term, given the proportion of proteins in the total mouse proteome that are annotated to that GO Term. d, Network analysis of the TDP-CTF versus TDP-43 proteome in the nucleocytoplasmic transport pathway by GeneMANIA. Grey circles represent unidentified proteins. Colored circles represent the identified proteins and their PSMs in TDP-CTF (blue) and TDP-43 (red) associated proteome. Circle sizes reflect log2-fold change between TDP-CTF and TDP-43. e, Summary diagram of the TDP-CTF interaction screen with 37 proteins involved in nucleocytoplasmic transport. Representative images of the co-aggregation (arrows) of GFP-tagged proteins with mCherry-TDP-CTF in N2a cells. Images for all tested components of the nucleocytoplasmic transport machinery are shown in Supplementary Figure 4 and 5. Each experiment was repeated independently two to four times. Scale bar: 10 μm.
Figure 3
Figure 3. Electron microscopy (EM) analysis reveals abnormal nuclear membrane (NM) morphology in N2a cells containing TDP-CTF aggregates
a, Schematic domain structures of engineered peroxidase, APEX2, fusion TDP-43 and TDP-CTF. b, Nuclear signals of FLAG-APEX2-TDP-43 and cytoplasmic aggregates of FLAG-APEX2-TDP-CTF were detected by anti-FLAG antibody (green). TDP-CTF phosphorylation was detected by anti-pTDP-43 (S409/410) antibody (red). Protein biotinylation catalyzed by APEX2 was detected by cy5-conjugated streptavidin (magenta). Scale bar: 10 μm. c, EM analysis of untransfected N2a cells and cells expressing FLAG-APEX2-TDP-43, FLAG-APEX2-TDP-CTF or GFP-TDP-CTF. Untransfected cells showed dense chromatin and round-shaped nuclei. APEX2 catalyzed the deposition of diaminobenzidine (DAB) near nuclear APEX2-TDP-43 and in cytoplasmic APEX2-TDP-CTF aggregates. APEX2-TDP-CTF as well as GFP-TDP-CTF expressing cells exhibited irregularly shaped nuclei with deep invaginations of the NM. Each experiment was repeated independently three times with similar results.
Figure 4
Figure 4. TDP-43 pathology disrupts NPC and nuclear lamina morphology and nucleocytoplasmic transport
a, Immunofluorescence (IF) of endogenous FG-Nups (mAb414, red) and lamin B (magenta) in primary cortical neurons expressing GFP or GFP-tagged TDP-CTF, TDP-43WT, TDP-43Q331K, TDP-43M337V or TDP-43mtNLS. This experiment was repeated independently five times. Scale bar: 10 μm. b, c, The percentage of transfected cells exhibiting abnormal lamin B staining (i.e. invagination, distortion) after transfection with TDP-43 expression vectors (b), or TDP-43 knockdown constructs (c). d, The percentage of transfected cells exhibiting abnormal RanGAP1 staining. e, Super-resolution IF imaging of endogenous Nup98 (red) in N2a cells expressing GFP or GFP-TDP-CTF. Scale bar: 10 μm. f, IF and quantification of mean γH2AX intensity in cortical neurons expressing GFP or GFP-tagged TDP-CTF, TDP-43WT or TDP-43Q331K. Calicheamicin (CLM) was added at 5 nM to induce DNA damage. Scale bar: 10 μm. g-i, IF and quantification of N-to-C ratio of a transport reporter encoding NES-tdTomato-NLS in cortical neurons expressing GFP or GFP-tagged TDP-43 constructs (g, h) or with treatment of staurosporine (STS) or importazole (IPZ) (i). This experiment was repeated independently three times. Scale bar: 10 μm. j, Quantification of N-to-C ratio of reporter in neurons with TDP-43 knockdown. k, Quantification of the N-to-C ratio of Ran in neurons expressing GFP or GFP-tagged TDP-43 constructs. l, m, IF and quantification of N-to-C ratio of poly(A) RNA. Poly(A) RNA was detected by fluorescence in situ hybridization (FISH) with oligo-(dT) probes (red). l, Quantification of levels of newly synthesized protein via metabolic labeling with azidohomoalanine (AHA). Anisomycin was added as a translation inhibitor. Scale bar: 10 μm. Graphs represent quartiles (boxes) and range (whiskers). Five independent experiments for b (circles represent each independent experiment; *** P < 0.001, one-way ANOVA), five independent experiments for c (circles represent each independent experiment; two-sided unpaired t-test), four independent experiments for d (circles represent each independent experiment; * P < 0.05, ** P < 0.01, one-way ANOVA), three independent experiments for f (circles represent GFP: n = 58, GFP+CLM 5 nM: n = 59, TDP-CTF: n = 61, TDP-43WT: n = 59 and TDP-43Q331K: n = 57; *** P < 0.001, one-way ANOVA), three independent experiments for h (circles represent GFP: n = 70, TDP-CTF: n = 72, TDP-43WT: n = 70, TDP-43Q331K: n = 70, TDP-43M337V: n = 70, TDP-43mtNLS : n = 61; ** P < 0.01, *** P < 0.001, one-way ANOVA), three independent experiments for i (circles represent DMSO: n = 46, IPZ 2.5 μM: n = 45, IPZ 5 μM: n = 45, STS 50 nM: n = 46, STS 250 nM: n = 47; ** P < 0.01, *** P < 0.001, one-way ANOVA), four independent experiments for j (circles represent shCtrl: n = 77, shTDP-43: n = 80; *** P < 0.001, two-sided unpaired t-test), three independent experiments for k (circles represent GFP: n = 43, TDP-CTF: n = 44, TDP-43WT: n = 36, TDP-43Q331K: n = 51, TDP-43M337V: n = 46, TDP-43mtNLS : n = 48; one-way ANOVA), three independent experiments for m (circles represent GFP: n = 46, TDP-CTF: n = 61, TDP-43WT: n = 49, TDP-43Q331K: n = 51, TDP-43M337V: n = 60, TDP-43mtNLS : n = 58; *** P < 0.001, one-way ANOVA), five independent experiments for n (circles represent GFP: n = 58, TDP-43WT: n = 58, TDP-CTF: n = 63, GFP+aniso: n = 59, TDP-43WT+aniso: n = 55, TDP-CTF+aniso: n = 53; *** P < 0.001, † P < 0.001, two-way ANOVA). Bonferroni’s post hoc test. Full statistical details are provided in Supplementary Table 4.
Figure 5
Figure 5. Human cells from ALS patients exhibit defects in NPC and nuclear lamina morphology and nucleocytoplasmic transport
a, Super-resolution immunofluorescence (IF) imaging of endogenous FG-Nups (mAb414, green) and lamin B (red) in fibroblasts from healthy control (Ctrl) and TDP-ALS. This was repeated independently three times with similar results. Scale bar: 10 μm. b, IF and quantification of mean anti-γH2AX intensity. c, d, IF of endogenous Nup205 (green) and lamin B (red) (c) and quantification of cells with abnormal lamin B staining in fibroblasts from three Ctrl, C9-ALS, TDP-ALS and sALS cases (d). Scale bar: 10 μm. e, f, IF and quantification of N-to-C ratio of a transport reporter. Scale bar: 10 μm. g, h, IF and quantification of N-to-C ratio of poly(A) RNA. Scale bar: 10 μm. i, j, IF and quantification of cells with abnormal FG-Nups and lamin B staining in iPSC-derived motor neurons from Ctrl and TDP-ALS. Scale bar: 10 μm. Graphs represent quartiles (boxes) and range (whiskers). Five independent experiments for b (circles represent Ctrl: n = 51, TDP-ALS: n = 62; * P < 0.05, two-sided unpaired t-test), four independent experiments for d (symbols represent each independent experiment per cell line; * P < 0.05, *** P < 0.001, one-way ANOVA), four independent experiments for f (symbols represent Ctrl: n = 178, C9-ALS: n = 175, TDP-ALS: n = 183, sALS: n = 180; *** P < 0.001, one-way ANOVA), four independent experiments for h (symbols represent Ctrl: n = 186, C9-ALS: n = 180, TDP-ALS: n = 190, sALS: n = 181; *** P < 0.001, one-way ANOVA) and triplicates for each group for j (symbols represent each independent experiment; *** P < 0.001, two-sided unpaired t-test). Bonferroni’s post hoc test. Full statistical details are provided in Supplementary Table 4.
Figure 6
Figure 6. Identification of genetic suppression of TDP-43 toxicity in Drosophila disease models of ALS
a, b, Overexpression of human TDP-43WT and TDP-43G298S in Drosophila leads to neurodegeneration in the adult retina (a) and impairment in larval locomotor function (b). GMR GAL4 and D42 GAL4 driver lines were used for expression in the retina and motor neurons, respectively. W1118 was used as a control fly line. Loss-of-function mutations in several Drosophila Nup genes rescue the phenotypes caused by TDP-43 pathology. Graph represents quartiles (boxes) and range (whiskers) of b (dots represent D42 × w1118: n = 26, others: n = 30 animals; * P < 0.05, *** P < 0.001, two-way ANOVA), Bonferroni’s post hoc test. Full statistical details are provided in Supplementary Table 4.
Figure 7
Figure 7. Nuclear pore pathology is present in brain tissue of fALS and sALS cases with pTDP-43-positive inclusions
a, Immunohistochemical staining of Nup205 in human motor cortex was done once on five control, ten sALS, seven C9-ALS, and the SOD1-ALS and TDP-ALS cases, with similar results within groups. Scale bar: 100 μm. b, Double staining of pTDP-43 (blue) and Nup205 (brown) in motor cortex of TDP-ALS. Arrow indicates co-localization. Scale bar: 50 μm. c, pTDP-43 (left), and double staining of pTDP-43 (blue) and Nup205 (brown) (right) in hippocampus of TDP-ALS. Arrow indicates co-localization. Scale bar: 50 μm. d, Immunohistochemical staining of Nup205 in motor cortex and cerebellum was done once on five control, five sALS, and the TDP-ALS cases, with similar results within groups. Scale bar: 100 μm.
Figure 8
Figure 8. Pharmacological inhibition of TDP-43 toxicity rescues nucleocytoplasmic transport function caused by TDP-43 pathology
a, Overexpression of TDP-CTF or mutant TDP-43Q331K increases cell death in transfected cortical neurons compared to GFP. Treatment of 50 nM KPT-335 for 24 hours reduced cell death in both TDP-CTF and TDP-43 Q331K. b, Abnormal nuclear morphology with lamin B staining in neurons expressing TDP-CTF or TDP-43Q331K is rescued via the treatment of 50 nM KPT-335. c, Locomotion defects in larva expressing human TDP-43WT and TDP-43G298S is ameliorated by treatment with 1 μM but not 5 μM PT-335 or KPT-276. Graphs represent quartiles (boxes) and range (whiskers). Five independent experiments for a (circles represent each independent experiment; * P < 0.05, ** P < 0.01, *** P < 0.001, two-way ANOVA), four independent experiments for b (circles represent each independent experiment; * P < 0.05, *** P < 0.001, two-way ANOVA) and c (circles represent n = 30 animals; ** P < 0.01, *** P < 0.001, two-way ANOVA). Bonferroni’s post hoc test. Full statistical details are provided in Supplementary Table 4.

Comment in

References

    1. Ling SC, Polymenidou M, Cleveland DW. Converging mechanisms in ALS and FTD: disrupted RNA and protein homeostasis. Neuron. 2013;79:416–438. - PMC - PubMed
    1. Neumann M, et al. Ubiquitinated TDP-43 in frontotemporal lobar degeneration and amyotrophic lateral sclerosis. Science. 2006;314:130–133. - PubMed
    1. Igaz LM, et al. Enrichment of C-terminal fragments in TAR DNA-binding protein-43 cytoplasmic inclusions in brain but not in spinal cord of frontotemporal lobar degeneration and amyotrophic lateral sclerosis. Am J Pathol. 2008;173:182–194. - PMC - PubMed
    1. Buratti E, et al. TDP-43 binds heterogeneous nuclear ribonucleoprotein A/B through its C-terminal tail: an important region for the inhibition of cystic fibrosis transmembrane conductance regulator exon 9 splicing. J Biol Chem. 2005;280:37572–37584. - PubMed
    1. Gitcho MA, et al. TDP-43 A315T mutation in familial motor neuron disease. Ann Neurol. 2008;63:535–538. - PMC - PubMed

Publication types

MeSH terms