. 2017 Dec 19:11:717.
doi: 10.3389/fnins.2017.00717. eCollection 2017.

Hippocampal Neurodegenerative Pathology in Post-stroke Dementia Compared to Other Dementias and Aging Controls

Affiliations

Hippocampal Neurodegenerative Pathology in Post-stroke Dementia Compared to Other Dementias and Aging Controls

Rufus O Akinyemi et al. Front Neurosci. .

Abstract

Neuroimaging evidence from older stroke survivors in Nigeria and Northeast England showed medial temporal lobe atrophy (MTLA) to be independently associated with post-stroke cognitive impairment and dementia. Given the hypothesis ascribing MTLA to neurodegenerative processes, we assessed Alzheimer pathology in the hippocampal formation and entorhinal cortex of autopsied brains from of post-stroke demented and non-demented subjects in comparison with controls and other dementias. We quantified markers of amyloid β (total Aβ, Aβ-40, Aβ-42, and soluble Aβ) and hyperphosphorylated tau in the hippocampal formation and entorhinal cortex of 94 subjects consisting of normal controls (n = 12), vascular dementia, VaD (17), post-stroke demented, PSD (n = 15), and post-stroke non-demented, PSND (n = 23), Alzheimer's disease, AD (n = 14), and mixed AD and vascular dementia, AD_VAD (n = 13) using immunohistochemical techniques. We found differential expression of amyloid and tau across the disease groups, and across hippocampal sub-regions. Among amyloid markers, the pattern of Aβ-42 immunoreactivity was similar to that of total Aβ. Tau immunoreactivity showed highest expression in the AD and mixed AD and vascular dementia, AD_VaD, which was higher than in control, post - stroke and VaD groups (p < 0.05). APOE ε4 allele positivity was associated with higher expression of amyloid and tau pathology in the subiculum and entorhinal cortex of post-stroke cases (p < 0.05). Comparison between PSND and PSD revealed higher total Aβ immunoreactivity in PSND compared to PSD in the CA1, subiculum and entorhinal cortex (p < 0.05) but no differences between PSND and PSD in Aβ-42, Aβ-40, soluble Aβ or tau immunoreactivities (p > 0.05). Correlation of MMSE and CAMCOG scores with AD pathological measures showed lack of correlation with amyloid species although tau immunoreactivity demonstrated correlation with memory scores (p < 0.05). Our findings suggest hippocampal AD pathology does not necessarily differ between demented and non-demented post-stroke subjects. The dissociation of cognitive performance with hippocampal AD pathological burden suggests more dominant roles for non-Alzheimer neurodegenerative and / or other non-neurodegenerative substrates for dementia following stroke.

Keywords: Alzheimer's disease; cerebrovascular disease; mixed dementia; post-stroke dementia; stroke; vascular dementia.


Figures

Figure 1
Figure 1
Illustrative images of amyloid pathology in the CA1 sub-region across different markers and across disease groups and aging controls. There is higher expression of amyloid in the AD and AD_VaD groups compared with the VaD, PSD, and PSND and control groups. The level of amyloid immunoreactivity is similar between 4G8 and T-42 but much lower in T-40 and NU-1.
Figure 2
Figure 2
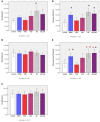
Bar graphs showing the distribution of total Aβ IR across hippocampal sub-regions (A) CA1, (B) CA2, (C) CA3, (D) Subiculum, (E) Entorhinal cortex in Controls, PSND, PSD, VaD, AD and AD_VaD. Bars show ± 2 SEM *Mann Whitney U-test was used to compare means of each group. *p < 0.05; + p < 0.1 (in comparison with the control group). *(red) showed significant difference from PSD group. IR (immunoreactivity).
Figure 3
Figure 3
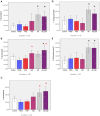
Bar graphs showing the distribution of Aβ-42 IR across hippocampal sub-regions (A) CA1, (B) CA2, (C) CA34, (D) Subiculum, (E) Entorhinal cortex in Controls, PSND, PSD, AD, VaD, and AD_VaD. Bars show ± 2 SEM *Mann Whitney U-test was used to compare means of each group. *p < 0.05; + p < 0.1 (in comparison with control group). *(red) showed significant difference from PSND group. IR (immunoreactivity).
Figure 4
Figure 4
Bar graphs showing the distribution of Aβ-40 IR across hippocampal sub-regions (A) CA1, (B) CA2, (C) Entorbinal cortex in Controls, PSND, PSD, AD, VaD and AD_VaD. Bars show ± 2 SEM *Mann Whitney U–test was used to compare means of each group. *p < 0.05; + p < 0.1 (in comparison with the control group). *(red) showed significant difference from PSD group. lR (immunoreactivity).
Figure 5
Figure 5
Bar graph shows percentage area and immunoreactivity of soluble Aβ (IR) across the CA1 region (A,B) and Entorhinal cortex (C,D) respectively in Control PSND, PSD, VaD, AD, and AD_VaD. Bars show ± 2 SEM *Mann Whitney U-test was used to compare means of each group. *p < 0.05 (in comparison with the *control group and *PSD group). There were no significant differences across groups in the CA1, CA2, and CA3 regions (p > 0.05, Kruskal–Wallis Test).
Figure 6
Figure 6
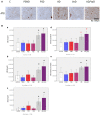
(A) Hyperphosphorylated tau (AT8) immunoreactivities showing neuropil threads, pretangles and tangles in hippocampal sub-region CAl. AT8 immunoreactivity is relatively higher in AD and AD_VaD compared to other groups. (B) Bar graph showing the distribution of AT8 IR across hippocampal sub-region. (a) CA1, (b) CA2, (c) CA3, (d) Subiculum (e) Entorhinal cortex in Controls. PSND. PSD. AD. VaD and AD_ VaD. Bars show ± 2 SEM *Mann Whitney U-test was used to compare means of each group. *p < 0.05; (in comparison with the control group). *(red) showed significant difference from PSND group.
Figure 7
Figure 7
(A) Box Plots showing the influence of Apo E ε4 on total amyloid deposition across hippocampal sub-regions (a) CA1, (b) CA2, (c) CA3, (d) Subicuhun, and [e] Emorlrinal conex in the post-stroke sub-cohort Mann–Whitney U-test was used to compare the mean 4G8 total immunoreactivity between the Apo E ε4 positive and negative groups respectively. *p < 0.05. (B) Box Plot showing the influence of Apo E ε4 on total tau (AT8) deposition across hippocampal sub-regions (a) CA1 (b) CA2 (c) CA3 (d) Subiculum and (e) Entorhinol cortex in the post-stroke sub-cohort. Mann Whitney U-test was used to compare mean AT8 total immunoreactivity between the Apo E ε4 positive and negative groups respectively. *p < 0.05.

References

    1. Aho L., Jolkkonen J., Alafuzoff I. (2006). Beta-amyloid aggregation in human brains with cerebrovascular lesions. Stroke 37, 2940–2945. 10.1161/01.STR.0000248777.44128.93 - DOI - PubMed
    1. Aizenstein H. J., Nebes R. D., Saxton J. A., Price J. C., Mathis C. A., Tsopelas N. D., et al. . (2008). Frequent amyloid deposition without significant cognitive impairment among the elderly. Arch. Neurol. 65, 1509–1517. 10.1001/archneur.65.11.1509 - DOI - PMC - PubMed
    1. Akinyemi R. O., Allan L., Owolabi M. O., Akinyemi J. O., Ogbole G., Ajani A., et al. . (2014). Profile and determinants of vascular cognitive impairment in African stroke survivors: the CogFAST Nigeria Study. J. Neurol. Sci. 346, 241–249. 10.1016/j.jns.2014.08.042 - DOI - PubMed
    1. Akinyemi R. O., Firbank M., Ogbole G. I., Allan L. M., Owolabi M. O., Akinyemi J. O., et al. . (2015). Medial temporal lobe atrophy, white matter hyperintensities and cognitive impairment among Nigerian African stroke survivors. BMC Res. Notes 8, 625. 10.1186/s13104-015-1552-7 - DOI - PMC - PubMed
    1. Allan L. M., Rowan E. N., Firbank M. J., Thomas A. J., Parry S. W., Polvikoski T. M., et al. . (2011). Long term incidence of dementia, predictors of mortality and pathological diagnosis in older stroke survivors. Brain 134(Pt 12), 3716–3727. 10.1093/brain/awr273 - DOI - PMC - PubMed

LinkOut - more resources