. 2017 Dec 12:8:677.
doi: 10.3389/fneur.2017.00677. eCollection 2017.

A Perspective on Wearable Sensor Measurements and Data Science for Parkinson's Disease

Affiliations

A Perspective on Wearable Sensor Measurements and Data Science for Parkinson's Disease

Ricardo Matias et al. Front Neurol. .

Abstract

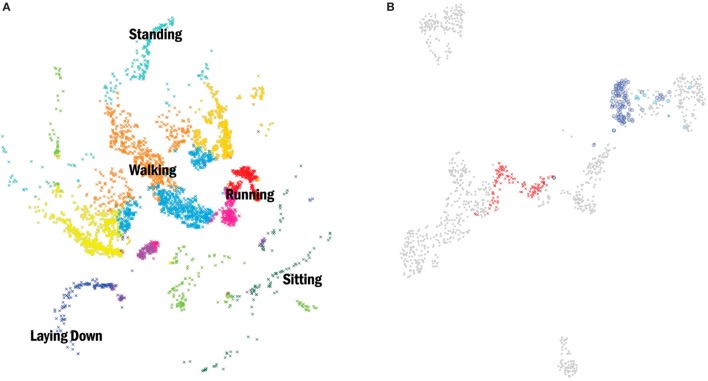
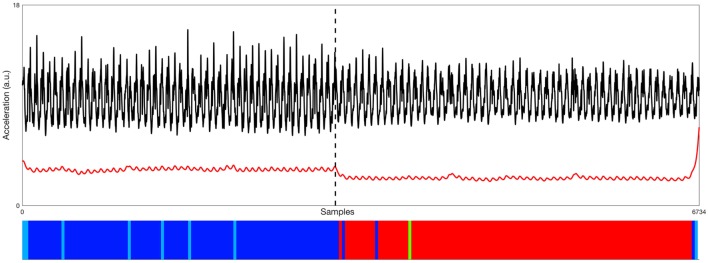
Miniaturized and wearable sensor-based measurements enable the assessment of Parkinson's disease (PD) motor-related features like never before and hold great promise as non-invasive biomarkers for early and accurate diagnosis, and monitoring the progression of PD. High-fidelity human movement reconstruction and simulation can already be conducted in a clinical setting with increasingly precise and affordable motion technology enabling access to high-quality labeled data on patients' subcomponents of movement (kinematics and kinetics). At the same time, body-worn sensors now allow us to extend some quantitative movement-related measurements to patients' daily living activities. This era of patient movement "cognification" is bringing us previously inaccessible variables that encode patients' movement, and that, together with measures from clinical examinations, poses new challenges in data analysis. We present herein examples of the application of an unsupervised methodology to classify movement behavior in healthy individuals and patients with PD where no specific knowledge on the type of behaviors recorded is needed. We are most certainly leaving the early stage of the exponential curve that describes the current technological evolution and soon will be entering its steep ascent. But there is already a benefit to be derived from current motion technology and sophisticated data science methods to objectively measure parkinsonian impairments.

Keywords: Parkinson’s disease; biomarkers; biomechanics; clinical decision-making; data science; decision support; motor symptoms fluctuations; wearable sensors.


Figures

Figure 1
Figure 1
(A) (Left) two-dimensional embedding (t-Distributed Stochastic Neighbor Embedding) (50) of acceleration data points from nine healthy subjects performing several daily activities. Data were collected with one inertial measurement unit (IMU) placed over the pelvis with a sample rate of 120 Hz. Each point corresponds to a discretized behavior block obtained with a change-point detection algorithm. Colors correspond to clusters obtained by affinity propagation (51). A subset of clusters was labeled according to the dominant feature (standing, walking, sitting, etc.). (B) (Right) shows an example of the same methodology now applied to six patients diagnosed with idiopathic Parkinson’s disease (PD) and a Hoehn and Yahr stage less than or equal to 2. Movement data were collected with one IMU placed over the pelvis (sample rate 120 Hz) while patients walked a 10-m corridor, first in their OFF state (“x”) and later in their best ON state defined by the Movement Disorder Society Unified Parkinson’s disease rating scale (“o”). The gray dots represent all the recorded blocks of behavior from the six PD patients and the color dots the groups related to one patient. Clusters represented in both left and right images are from two independent experiments, thus, the resultant embeddings are not comparable.
Figure 2
Figure 2
Representative example of data processed from the accelerometer (black signal—raw vertical acceleration; red signal—low-pass filtered posterior–anterior acceleration) used by one of the six Parkinson’s disease (PD) patients during two 10-m walk trials, first in his OFF state and later in his best ON state. Time series are two collated non-consecutive segments of data recorded OFF (left) and best ON (right) states of one PD patient, as indicated by the black dashed line. Bottom: the distinction between the OFF and ON states is very clear with this methodology, where the clusters’ organization (showed by the color bar) perfectly aligns with the transition of the signals above. Different colors represent found behavioral blocks (same color code as Figure 1B).

References

    1. Kalia LV, Lang AE. Parkinson’s disease. Lancet (2015) 386:896–912.10.1016/S0140-6736(14)61393-3 - DOI - PubMed
    1. Keus S, Munneke M, Graziano M, Paltamaa J, Pelosin E, Domingos J, et al. European Physiotherapy Guideline for Parkinson’s Disease. Netherlands: KNGF/ParkinsonNet; (2014).
    1. Sveinbjornsdottir S. The clinical symptoms of Parkinson’s disease. J Neurochem (2016) 139(Suppl 1):318–24.10.1111/jnc.13691 - DOI - PubMed
    1. Coelho M, Ferreira JJ. The natural history of Parkinson’s disease [Internet]. In: Falup-Pecurariu C, Ferreira J, Martinez-Martin P, Chaudhuri KR, editors. Movement Disorders Curricula. Vienna: Springer; (2017). p. 129–37. Available from: http://link.springer.com/10.1007/978-3-7091-1628-9
    1. Rascol O, Payoux P, Ory F, Ferreira JJ, Brefel-Courbon C, Montastruc J-L. Limitations of current Parkinson’s disease therapy. Ann Neurol (2003) 53(Suppl 3):S3–12.10.1002/ana.10513 - DOI - PubMed

LinkOut - more resources