. 2017 Dec 12:8:2489.
doi: 10.3389/fmicb.2017.02489. eCollection 2017.

Physiological and Pathological Transcriptional Activation of Endogenous Retroelements Assessed by RNA-Sequencing of B Lymphocytes

Affiliations

Physiological and Pathological Transcriptional Activation of Endogenous Retroelements Assessed by RNA-Sequencing of B Lymphocytes

Jan Attig et al. Front Microbiol. .

Abstract

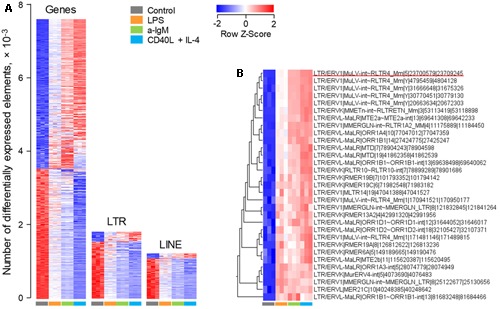
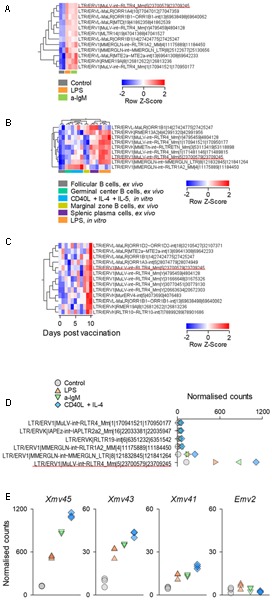
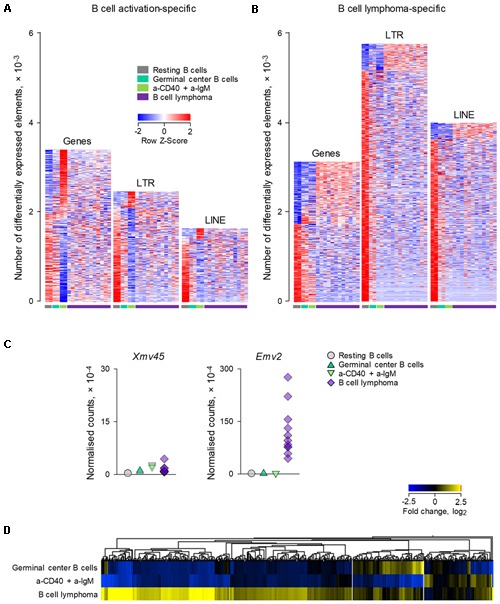
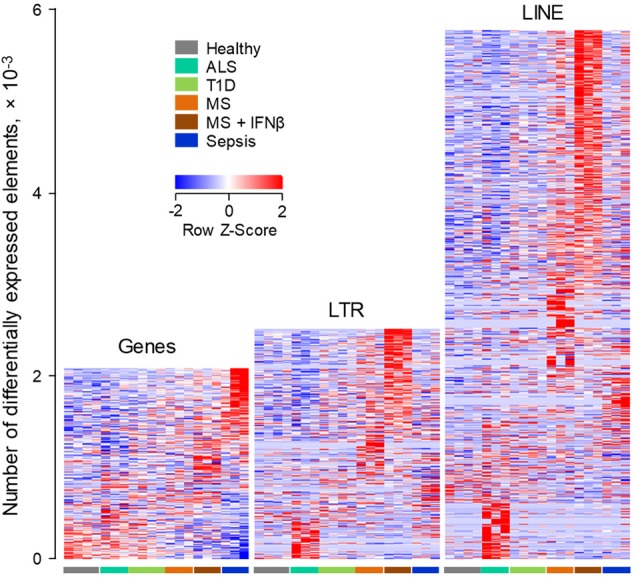
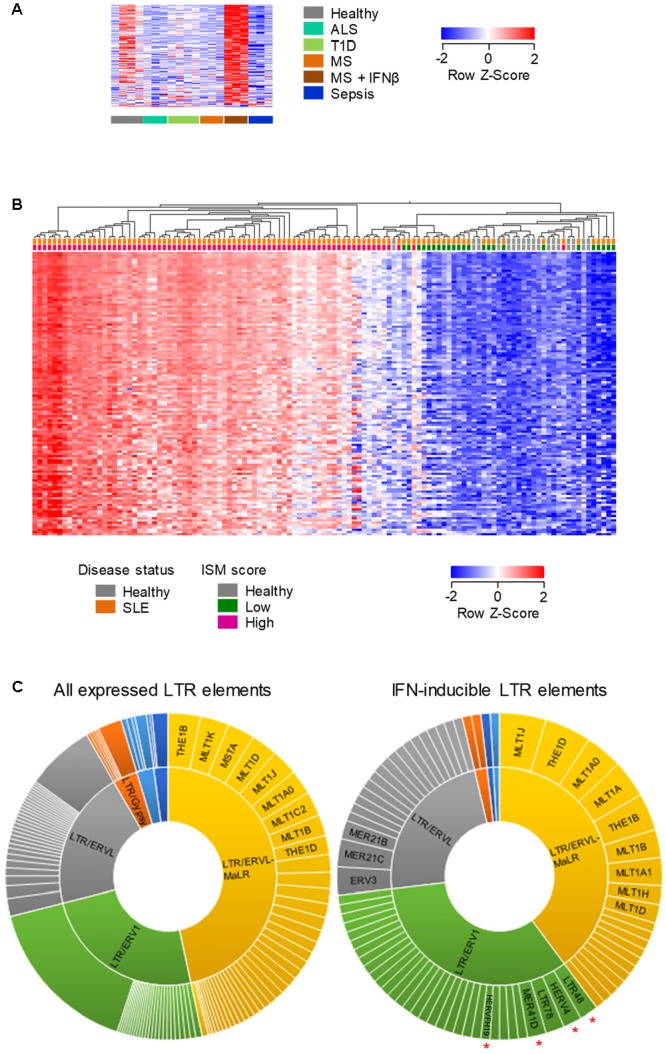
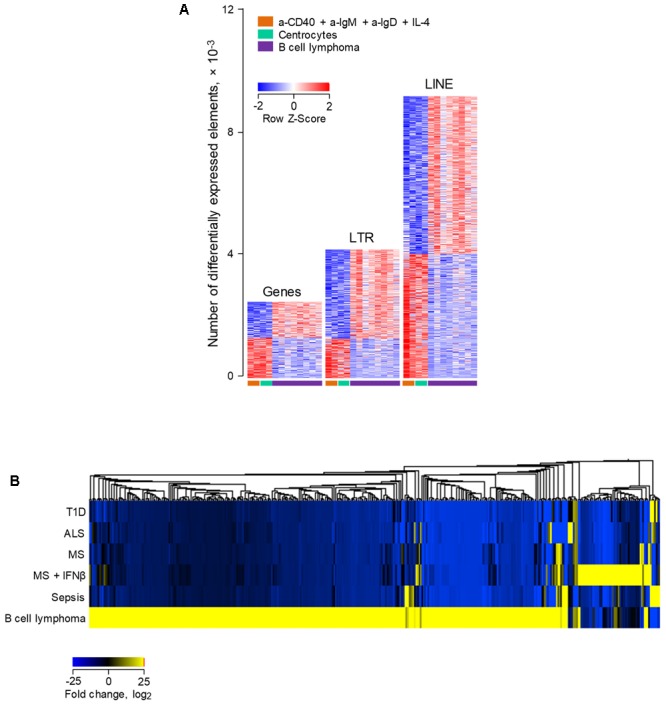
In addition to evolutionarily-accrued sequence mutation or deletion, endogenous retroelements (EREs) in eukaryotic genomes are subject to epigenetic silencing, preventing or reducing their transcription, particularly in the germplasm. Nevertheless, transcriptional activation of EREs, including endogenous retroviruses (ERVs) and long interspersed nuclear elements (LINEs), is observed in somatic cells, variably upon cellular differentiation and frequently upon cellular transformation. ERE transcription is modulated during physiological and pathological immune cell activation, as well as in immune cell cancers. However, our understanding of the potential consequences of such modulation remains incomplete, partly due to the relative scarcity of information regarding genome-wide ERE transcriptional patterns in immune cells. Here, we describe a methodology that allows probing RNA-sequencing (RNA-seq) data for genome-wide expression of EREs in murine and human cells. Our analysis of B cells reveals that their transcriptional response during immune activation is dominated by induction of gene transcription, and that EREs respond to a much lesser extent. The transcriptional activity of the majority of EREs is either unaffected or reduced by B cell activation both in mice and humans, albeit LINEs appear considerably more responsive in the latter host. Nevertheless, a small number of highly distinct ERVs are strongly and consistently induced during B cell activation. Importantly, this pattern contrasts starkly with B cell transformation, which exhibits widespread induction of EREs, including ERVs that minimally overlap with those responsive to immune stimulation. The distinctive patterns of ERE induction suggest different underlying mechanisms and will help separate physiological from pathological expression.

Keywords: B cell lymphoma; B lymphocyte activation; autoimmunity; cancer; endogenous retroelements; endogenous retroviruses; genetic; transcription.


Figures

FIGURE 1
FIGURE 1
Modulation of LTR element and LINE expression upon murine B cell stimulation in vitro. Transcriptional analysis of purified splenic follicular B cells before and after 6-h in vitro stimulation with a-IgM (10 μg/ml), LPS (10 μg/ml) or a combination of CD40L (1 μg/ml) and IL-4 (0.1 μg/ml) (E-MTAB-2499). (A) Number of gene, LTR and LINE transcripts that are differentially expressed (≥2-fold change; p < 0.05) between in vitro activated and directly ex vivo isolated B cells. (B) The top 31 LTR EREs induced by 6-h B cell activation. In (A,B) each column is an independent sample. The underlined element in (B) is Xmv45.
FIGURE 2
FIGURE 2
Xmv45 induction during in vitro and in vivo murine B cell stimulation. Expression pattern of the 31 includible LTR elements identified in Figure 1B in three independent datasets. Significantly induced LTR elements were identified in each study separately (≥2-fold change; p < 0.05, and the elements shared with in vitro stimulated cells (Figure 1B) are shown. (A) Transcriptional analysis of purified splenic follicular B cells before and after 2-h in vitro stimulation with a-IgM (10 μg/ml) or LPS (25 μg/ml) (GSE61608), depicting the significantly induced LTR elements. (B) Transcriptional analysis of purified splenic follicular B cells before and after in vitro stimulation with LPS for 3 days or a combination of CD40L, IL-4 and IL-5 for 4 days (GSE60927). Also included in the comparison are ex vivo analyzed splenic germinal center B cells, marginal zone B cells and plasma cells. The heat map depicts the significantly induced LTR elements and unsupervised hierarchical clustering of samples according to their expression. (C) Mice were primed by intramuscular injection of inactivated influenza A/New Caledonia/20/99 virus and were boosted with intramuscular injection of seasonal (2006–2007) trivalent inactivated influenza vaccine 30 days later (GSE68769). The figure shows the transcriptional analysis of purified lymph node B cells, pooled from 3 mice for each of the indicated time-points after boost, depicting the significantly induced LTR elements. In (A–C) each column is an independent pool and the underlined element is Xmv45. (D) Normalized counts for the 6 LTR elements with the highest expression in dataset described in Figure 1A. Symbols represent the mean values of triplicate samples. The underlined element is Xmv45. (E) Normalized counts of the indicated proviruses in the same dataset described in Figure 1A. Each symbol is an independent sample.
FIGURE 3
FIGURE 3
Modulation of LTR and LINE EREs following B cell transformation. (A) Number of gene, LTR and LINE transcripts that are differentially expressed (≥2-fold change; p < 0.05) between resting B cells and B cells activated in vitro with a-CD40 and a-IgM antibodies for 24 h (GSE65422). Also shown for comparison are germinal center B cells from wild-type mice and B cell lymphomas from mice with germinal center B cell-specific deregulation of BCL6 and NIK. (B) Number of gene, LTR and LINE transcripts that are differentially expressed (≥2-fold change; p < 0.05) in B cell lymphomas in the same dataset described above in (A). Each column is an independent sample. (C) Normalized counts of Xmv45 and Emv2 transcripts in the same samples described above in (A). Symbols represent individual samples. (D) Hierarchical clustering of LTR elements that are significantly induced in either in vitro activated B cells (53 transcripts) or B cell lymphomas (606 transcripts) in the same dataset as in (A), in comparison with resting B cells. Mean fold changes from resting B cells are plotted.
FIGURE 4
FIGURE 4
ERE modulation in human B cells from infectious, degenerative or autoimmune disease. Transcriptional analysis by RNA-seq of peripheral blood B cells isolated from healthy individuals, from patients with Sepsis, ALS or T1D and from MS patients before and 24 h after the first treatment with IFNβ (GSE60424). Heat-maps show the number of gene, LTR and LINE transcripts that are differentially expressed (p < 0.05) between the groups. Each column is an independent sample.
FIGURE 5
FIGURE 5
Human LTR elements induced by IFN I in whole-blood. (A) Expression profile of 131 LTR elements that are transcriptionally induced specifically by IFNβ treatment of MS patients, in whole-blood RNA-seq data (GSE60424). (B) Hierarchical clustering of healthy individuals and SLE patients according to the expression of 219 LTR elements that were induced in B cells by IFNβ treatment of MS patients and were also upregulated in RNA-seq data (GSE72420) from whole-blood samples from SLE patients as a group, compared with those from healthy individuals (≥2-fold change; p < 0.05). In (A,B) each column is an independent sample. (C) Diversity of the LTR elements that are expressed in peripheral blood cells (left) and of the 108 IFN I-inducible LTR elements that were common between purified B cells and whole-blood samples from IFNβ-treated MS patients and SLE patients. Slice widths are proportional to the frequency of each member. Significantly enriched groups (p < 0.05, χ2 with multiple comparison correction) are indicated by red asterisks.
FIGURE 6
FIGURE 6
Differential modulation of LTR and LINE EREs following human B cell activation or transformation. (A) Number of gene, LTR and LINE transcripts that are differentially expressed (≥2-fold change; p < 0.01) between ex vivo isolated follicular lymphoma B cells and either peripheral blood B cells activated in vitro with IL-4, a-CD40, a-IgM, and a-IgD antibodies or ex vivo isolated tonsillar centrocytes (GSE62241). Each column is an independent sample. (B) Hierarchical clustering of a total of 395 LTR elements that are significantly induced in either ex vivo isolated follicular lymphoma B cells or peripheral blood B cells from infectious, degenerative or autoimmune diseases described in Figure 4. Mean fold changes from the respective B cell control are plotted.

References

    1. Bao W., Kojima K. K., Kohany O. (2015). Repbase update, a database of repetitive elements in eukaryotic genomes. Mob. DNA 6:11. 10.1186/s13100-015-0041-9 - DOI - PMC - PubMed
    1. Bolger A. M., Lohse M., Usadel B. (2014). Trimmomatic: a flexible trimmer for Illumina sequence data. Bioinformatics 30 2114–2120. 10.1093/bioinformatics/btu170 - DOI - PMC - PubMed
    1. Brudek T., Christensen T., Aagaard L., Petersen T., Hansen H. J., Moller-Larsen A. (2009). B cells and monocytes from patients with active multiple sclerosis exhibit increased surface expression of both HERV-H Env and HERV-W Env, accompanied by increased seroreactivity. Retrovirology 6:104. 10.1186/1742-4690-6-104 - DOI - PMC - PubMed
    1. Burns K. H., Boeke J. D. (2012). Human transposon tectonics. Cell 149 740–752. 10.1016/j.cell.2012.04.019 - DOI - PMC - PubMed
    1. Chuong E. B., Elde N. C., Feschotte C. (2016). Regulatory evolution of innate immunity through co-option of endogenous retroviruses. Science 351 1083–1087. 10.1126/science.aad5497 - DOI - PMC - PubMed