

doi: 10.1155/2017/7518035.
Epub 2017 Sep 20.
Estimating and Interpreting Effects from Nonlinear Exposure-Response Curves in Occupational Cohorts Using Truncated Power Basis Expansions and Penalized Splines
Affiliations
- PMID: 29312462
- PMCID: PMC5632483
- DOI: 10.1155/2017/7518035
Item in Clipboard
Estimating and Interpreting Effects from Nonlinear Exposure-Response Curves in Occupational Cohorts Using Truncated Power Basis Expansions and Penalized Splines
Comput Math Methods Med.
2017.
Abstract
Truncated power basis expansions and penalized spline methods are demonstrated for estimating nonlinear exposure-response relationships in the Cox proportional hazards model. R code is provided for fitting models to get point and interval estimates. The method is illustrated using a simulated data set under a known exposure-response relationship and in a data application examining risk of carpal tunnel syndrome in an occupational cohort.
Figures

True exposure-response relationship used to simulate data (a). Histogram of the simulated exposure data (b). Kaplan-Meier estimates of the survival functions for five exposure groups (c).
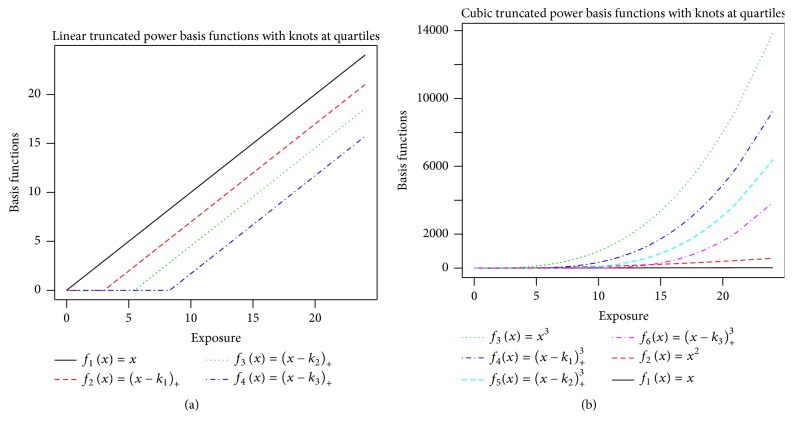
Linear spline (a) and cubic spline (b) basis functions using knots at quartiles of the case exposures (k1 = 3.0, k2 = 5.5, and k3 = 8.3).
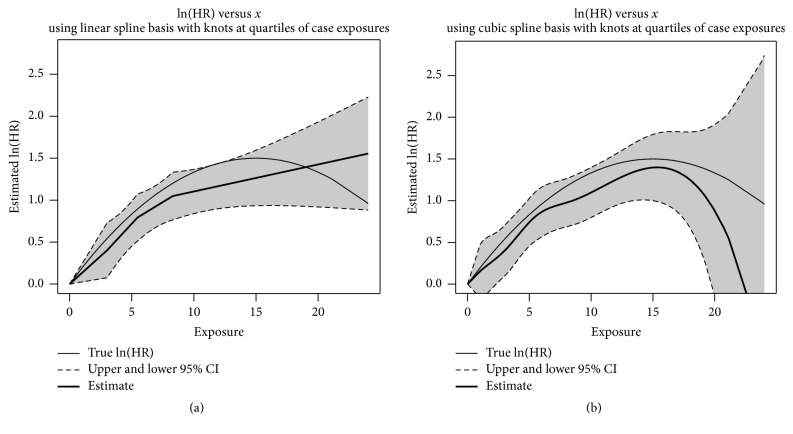
Estimated ln(HR) and corresponding pointwise 95% confidence intervals using linear spline (a) and cubic spline (b) basis functions with knots at quartiles of the case exposures (k1 = 3.0, k2 = 5.5, and k3 = 8.3).
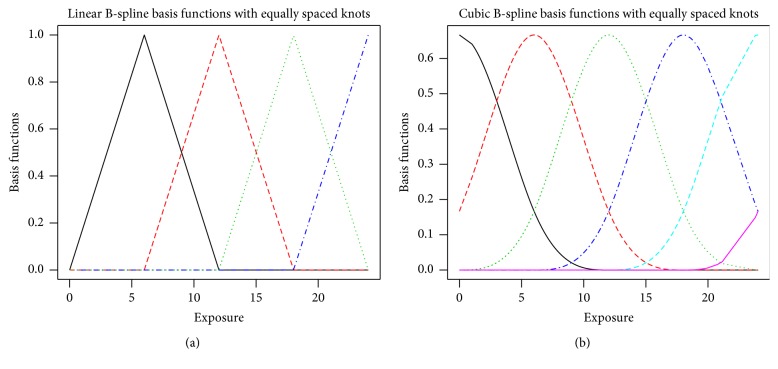
Linear B-spline (a) and cubic B-spline (b) basis functions using equally spaced knots.
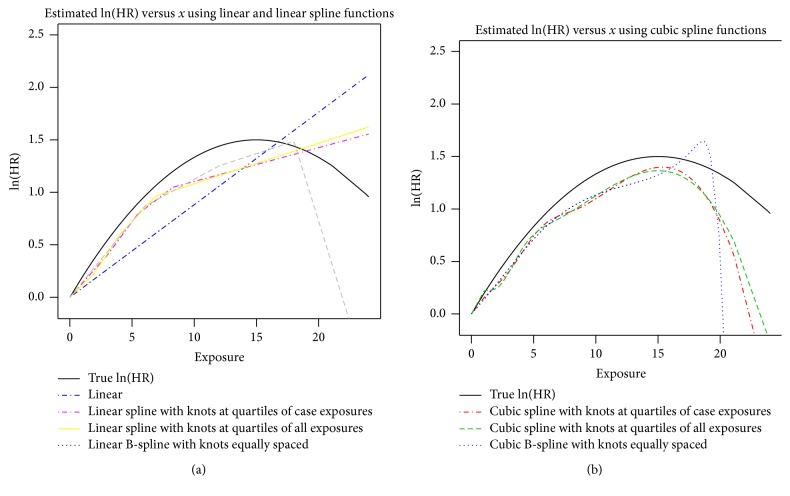
Estimated exposure-response curves on the natural logarithmic scale (logarithm of the hazard ratio) using truncated power basis functions and B-spline basis functions.
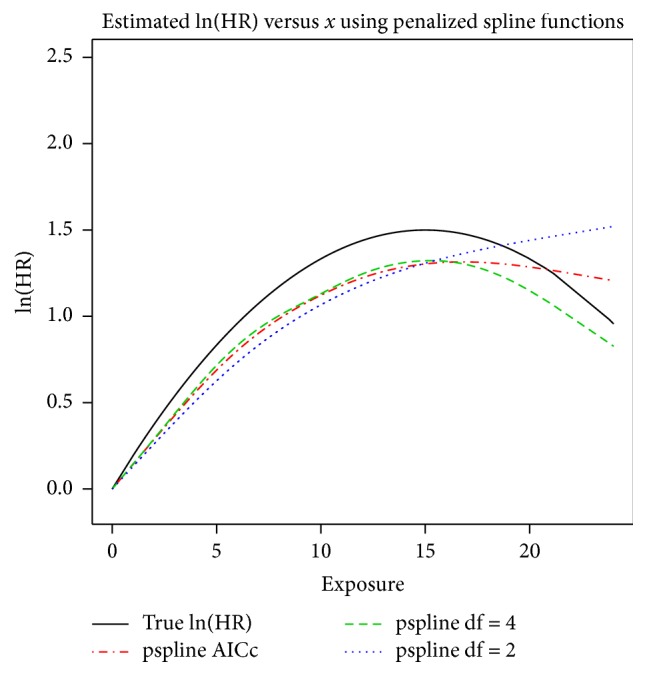
Estimated exposure-response curves on the natural logarithmic scale (logarithm of the hazard ratio) using penalized splines.
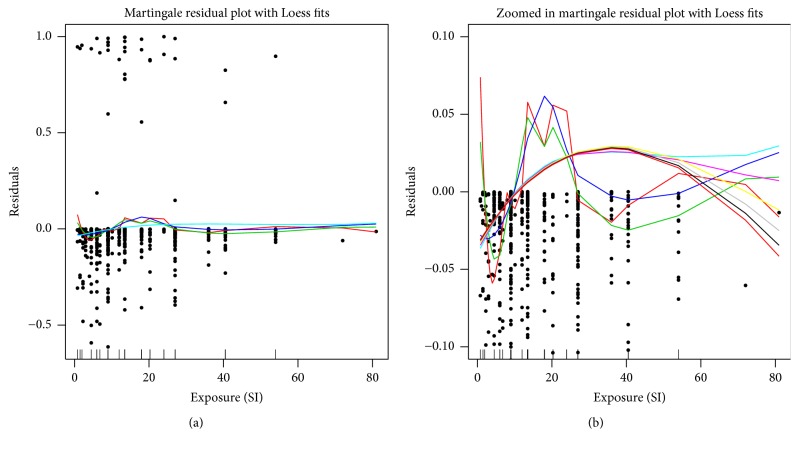
Unscaled (a) and scaled (b) plots of the martingale residuals versus exposure (SI) with Loess curves using various degrees of smoothing (0.4 to 2.0) from a Cox proportional hazards model with all covariates excluding the exposure variable. (b) is scaled to focus on the Loess curves. The distribution of the exposure variable is given in the rug plot on the x-axis.

Estimated exposure-response curves for carpal tunnel syndrome and strain index in a cohort of 569 workers. Rug plot is of cases.
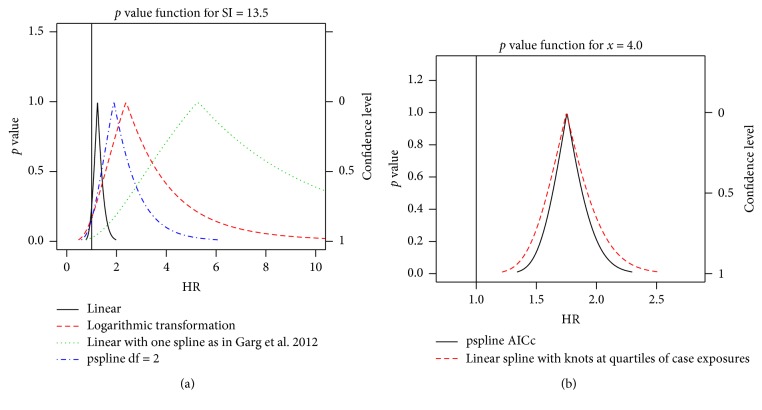
p value functions for the risk of carpal tunnel syndrome at an exposure of 13.5 strain index units versus unexposed (a) and for the simulated cohort data at an exposure of x = 4.0 versus unexposed (b).

Estimated exposure-response curves on the natural logarithmic scale (logarithm of the hazard ratio) for simulated data with 41 cases in 500 observations (a, b, c) and with 40 cases in 5000 observations (d, e, f) using linear, linear splines, and linear B-splines (a, d), cubic spline and cubic B-splines (b, e), and penalized splines (c, f).
Similar articles
-
The comparison of alternative smoothing methods for fitting non-linear exposure-response relationships with Cox models in a simulation study.Int J Biostat. 2009 Jan 7;5(1):Article 2. doi: 10.2202/1557-4679.1104. Int J Biostat. 2009. PMID: 20231865 Free PMC article.
-
Comparing smoothing techniques in Cox models for exposure-response relationships.Stat Med. 2007 Sep 10;26(20):3735-52. doi: 10.1002/sim.2848. Stat Med. 2007. PMID: 17538974
-
Personal risk factors for carpal tunnel syndrome in female visual display unit workers.Int J Occup Med Environ Health. 2016 Nov 18;29(6):927-936. doi: 10.13075/ijomeh.1896.00781. Epub 2016 Oct 6. Int J Occup Med Environ Health. 2016. PMID: 27869243
-
Carpal tunnel syndrome.Occup Med. 1992 Oct-Dec;7(4):741-63. Occup Med. 1992. PMID: 1411857 Review.
-
[Occupational and non-occupational aspects of carpal tunnel syndrome].Med Pr. 2002;53(5):417-22. Med Pr. 2002. PMID: 12577811 Review. Polish.
Cited by
-
Methodology to standardize heterogeneous statistical data presentations for combining time-to-event oncologic outcomes.PLoS One. 2022 Feb 24;17(2):e0263661. doi: 10.1371/journal.pone.0263661. eCollection 2022. PLoS One. 2022. PMID: 35202406 Free PMC article.
-
The high-risk features among patients undergoing mitral valve operation for ischemic mitral regurgitation: The 3-strike score.JTCVS Open. 2024 Mar 5;18:52-63. doi: 10.1016/j.xjon.2024.02.017. eCollection 2024 Apr. JTCVS Open. 2024. PMID: 38690412 Free PMC article.
-
Performance of 8 Smoking Metrics for Modeling Survival in Head and Neck Squamous Cell Carcinoma.JAMA Otolaryngol Head Neck Surg. 2025 Apr 1;151(4):360-370. doi: 10.1001/jamaoto.2024.5392. JAMA Otolaryngol Head Neck Surg. 2025. PMID: 39976935
-
Polypharmacy and antidepressant acceptability in comorbid depression and type 2 diabetes: a cohort study using UK primary care data.Br J Gen Pract. 2023 Apr 27;73(730):e392-e398. doi: 10.3399/BJGP.2022.0295. Print 2023 May. Br J Gen Pract. 2023. PMID: 37105749 Free PMC article.
-
Long-term exposure to particulate matter is associated with elevated blood pressure: Evidence from the Chinese plateau area.J Glob Health. 2024 Mar 15;14:04039. doi: 10.7189/jogh.14.04039. J Glob Health. 2024. PMID: 38483442 Free PMC article.
References
-
- Cox D. R. Regression models and life-tables. Journal of the Royal Statistical Society. 1972;34(Series B):187–220.
-
- Kapellusch J. M., Harris-Adamson C., Gerr F., et al. Exposure-response relationships for force and repetition, and CTS. Proceedings of the HFES Annual Meeting. October 2015;59(1):11–15. doi: 10.1177/1541931215591195. - DOI
MeSH terms
Grants and funding
LinkOut - more resources
Full Text Sources
Other Literature Sources
Medical
