

RA and ω-3 PUFA co-treatment activates autophagy in cancer cells
- PMID: 29312596
- PMCID: PMC5752509
- DOI: 10.18632/oncotarget.22629
RA and ω-3 PUFA co-treatment activates autophagy in cancer cells
Abstract
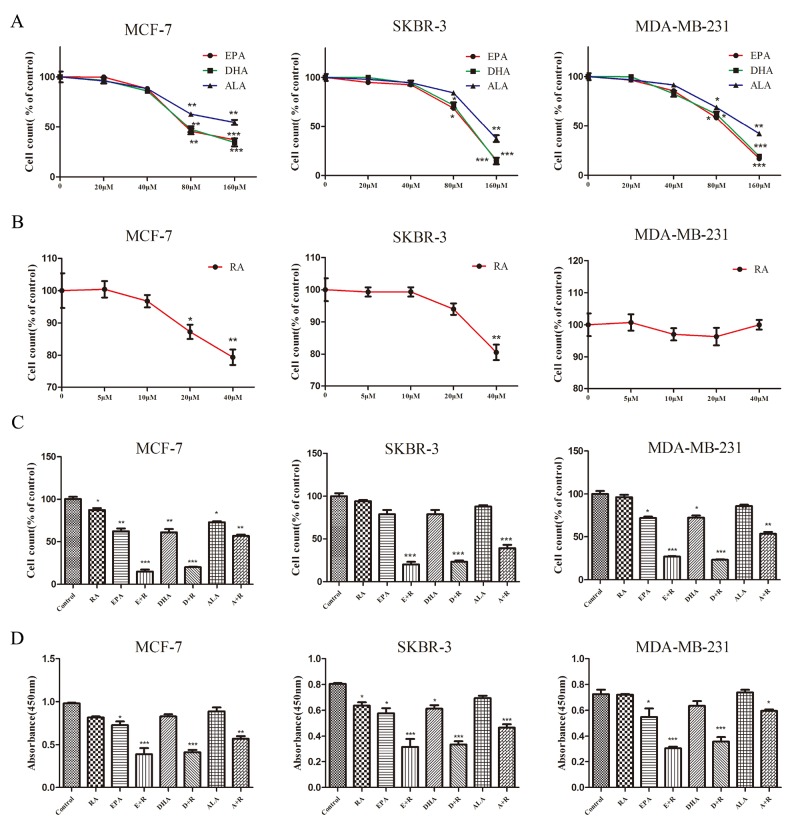
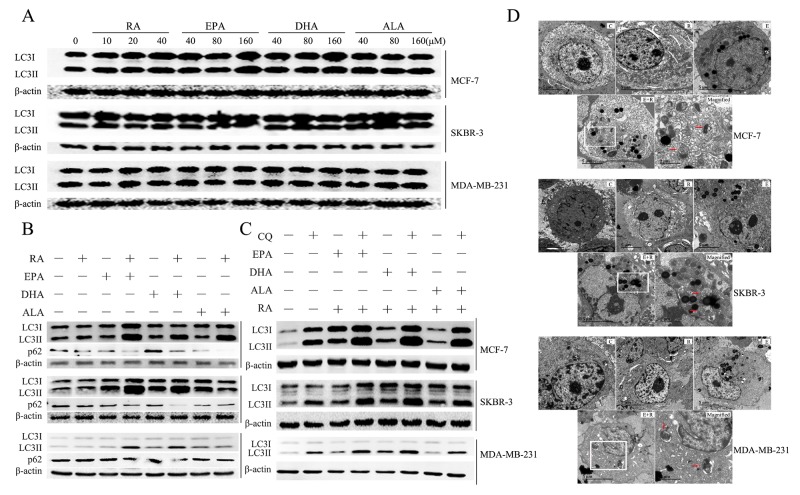
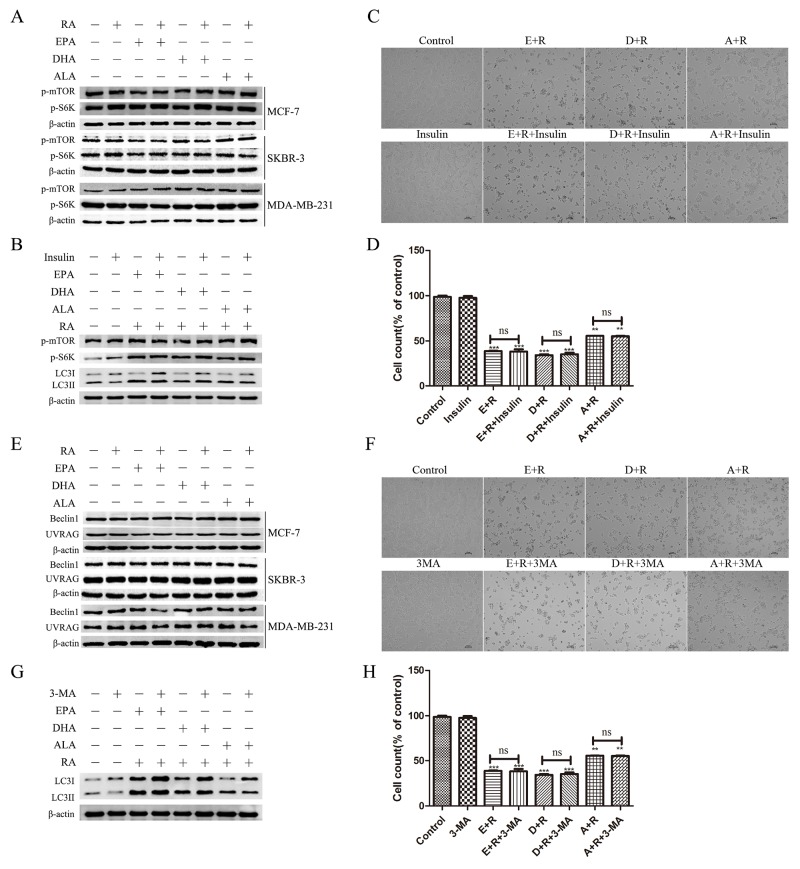
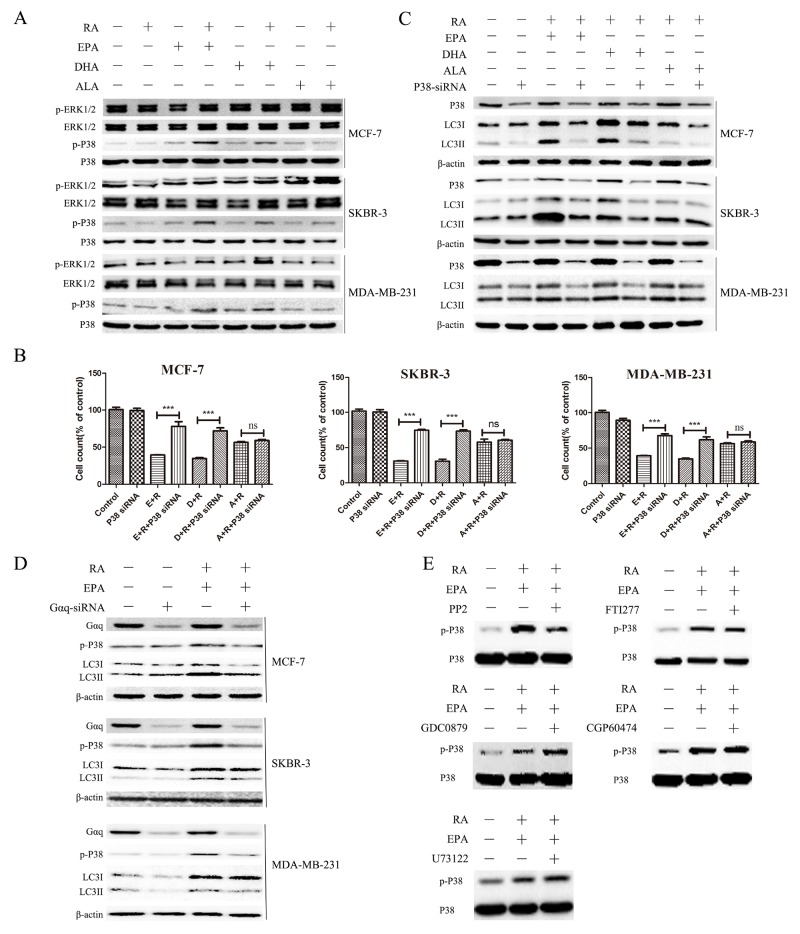
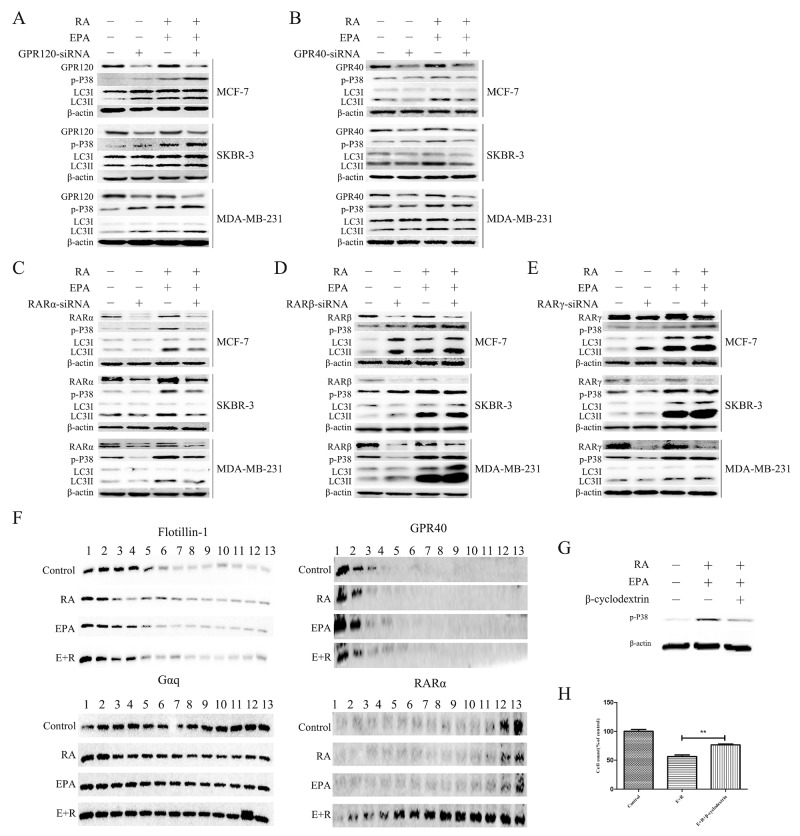
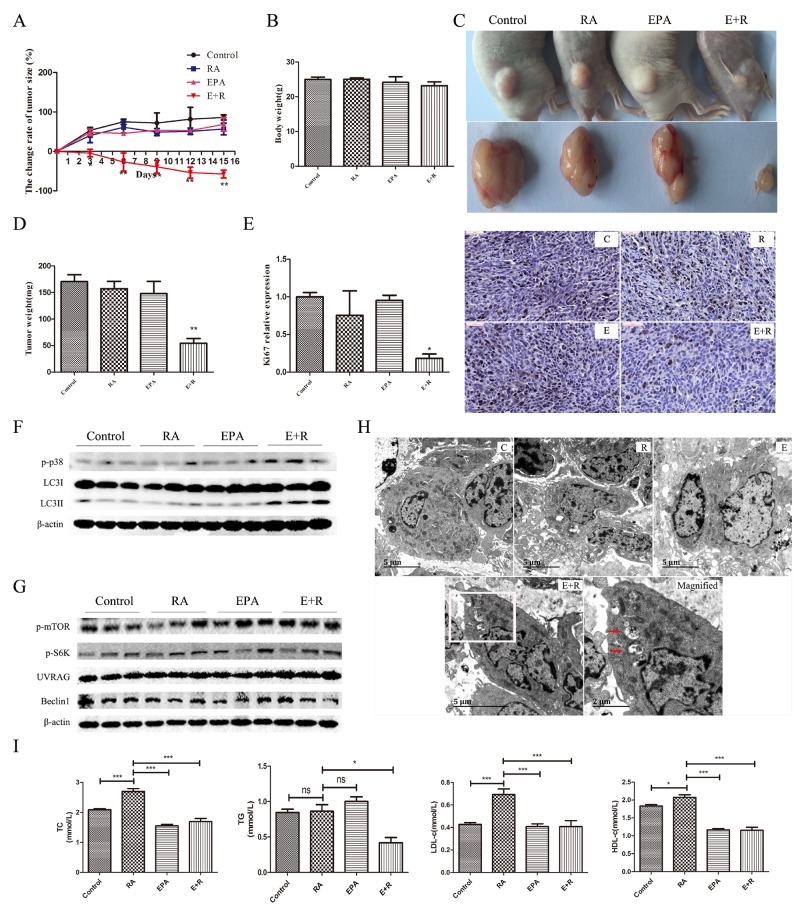
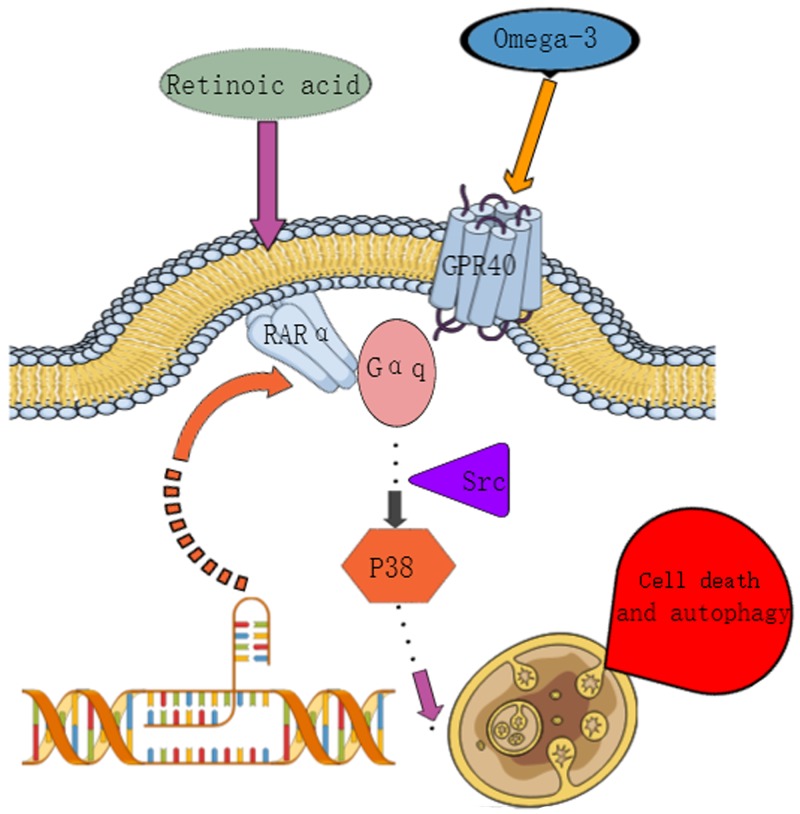
Retinoic acid (RA), is a promising therapeutic agent for the treatment of breast cancer. However, metabolic disorders and drug resistance reduce the efficacy of RA. In this study, we found that RA and ω-3 polyunsaturated fatty acids (ω-3 PUFAs) synergistically induced cell death in vitro and in vivo and autophagy activation. Moreover, RA-induced hypercholesterolemia was completely corrected by ω-3 PUFA supplementation. In addition, we demonstrated that the effects of this combination on the autophagic flux were independent of the two major canonic regulatory complexes controlling autophagic vesicle formation. The treatment activated Gαq-p38 MAPK signaling pathways, which resulted in autophagy of breast cancer cells. Knockdown of Gαq or P38 expression prevented RA and ω-3 PUFAs from inducing autophagy. Data indicated that Gαq-p38activation was mediated by the co-activation of GPR40 and RARα in lipid rafts, rather than by the activation of GPR120, RARβ, or RARγ. The results of this study suggest that hyperlipidemic drug side effects may be ameliorated by the administration of ω-3 PUFAs. Thus, the therapeutic indexes of the corresponding drugs may be increased.
Keywords: autophagy; breast cancer; retinoic acid; ω-3 PUFAs.
Conflict of interest statement
CONFLICTS OF INTEREST The authors declare no competing financial interest.
Figures
Similar articles
-
Metabolic Shift Induced by ω -3 PUFAs and Rapamycin Lead to Cancer Cell Death.Cell Physiol Biochem. 2018;48(6):2318-2336. doi: 10.1159/000492648. Epub 2018 Aug 16. Cell Physiol Biochem. 2018. PMID: 30114709
-
Overexpression and hyperactivity of breast cancer-associated fatty acid synthase (oncogenic antigen-519) is insensitive to normal arachidonic fatty acid-induced suppression in lipogenic tissues but it is selectively inhibited by tumoricidal alpha-linolenic and gamma-linolenic fatty acids: a novel mechanism by which dietary fat can alter mammary tumorigenesis.Int J Oncol. 2004 Jun;24(6):1369-83. Int J Oncol. 2004. PMID: 15138577
-
A retinoic acid receptor RARα pool present in membrane lipid rafts forms complexes with G protein αQ to activate p38MAPK.Oncogene. 2012 Jul 12;31(28):3333-45. doi: 10.1038/onc.2011.499. Epub 2011 Nov 7. Oncogene. 2012. PMID: 22056876
-
Role of diets rich in omega-3 and omega-6 in the development of cancer.Bol Med Hosp Infant Mex. 2016 Nov-Dec;73(6):446-456. doi: 10.1016/j.bmhimx.2016.11.001. Epub 2016 Nov 30. Bol Med Hosp Infant Mex. 2016. PMID: 29421289 Review.
-
Protective Effects of Omega-3 Fatty Acids in Cancer-Related Complications.Nutrients. 2019 Apr 26;11(5):945. doi: 10.3390/nu11050945. Nutrients. 2019. PMID: 31035457 Free PMC article. Review.
Cited by
-
[Role of cytoplasmic p53-mediated suppression of autophagy in heat stress-induced injury of cultured mouse aortic endothelial cells].Nan Fang Yi Ke Da Xue Xue Bao. 2018 Jul 30;38(7):787-793. doi: 10.3969/j.issn.1673-4254.2018.07.03. Nan Fang Yi Ke Da Xue Xue Bao. 2018. PMID: 33168505 Free PMC article. Chinese.
-
Omega-3PUFA Attenuates MNU-Induced Colorectal Cancer in Rats by Blocking PI3K/AKT/Bcl-2 Signaling.Onco Targets Ther. 2020 Mar 5;13:1953-1965. doi: 10.2147/OTT.S241298. eCollection 2020. Onco Targets Ther. 2020. PMID: 32184629 Free PMC article.
-
PA and OA induce abnormal glucose metabolism by inhibiting KLF15 in adipocytes.Nutr Metab (Lond). 2021 Nov 21;18(1):100. doi: 10.1186/s12986-021-00628-2. Nutr Metab (Lond). 2021. PMID: 34802421 Free PMC article.
-
Targeting Autophagy with Natural Products as a Potential Therapeutic Approach for Cancer.Int J Mol Sci. 2021 Sep 10;22(18):9807. doi: 10.3390/ijms22189807. Int J Mol Sci. 2021. PMID: 34575981 Free PMC article. Review.
-
Retraction Note: ω-3 free fatty acids and all-trans retinoic acid synergistically induce growth inhibition of three subtypes of breast cancer cell lines.Sci Rep. 2024 Nov 5;14(1):26769. doi: 10.1038/s41598-024-77048-8. Sci Rep. 2024. PMID: 39500938 Free PMC article. No abstract available.
References
-
- di Masi A, Leboffe L, De Marinis E, Pagano F, Cicconi L, Rochette-Egly C, Lo-Coco F, Ascenzi P, Nervi C. Retinoic acid receptors: from molecular mechanisms to cancer therapy. Mol Aspects Med. 2015;41:1–115. https://doi.org/10.1016/j.mam.2014.12.003. - DOI - PubMed
-
- Ribeiro MP, Santos AE, Custodio JB. Interplay between estrogen and retinoid signaling in breast cancer--current and future perspectives. Cancer Lett. 2014;353:17–24. https://doi.org/10.1016/j.canlet.2014.07.009. - DOI - PubMed
-
- Bitzur R, Brenner R, Maor E, Antebi M, Ziv-Baran T, Segev S, Sidi Y, Kivity S. Metabolic syndrome, obesity, and the risk of cancer development. Eur J Intern Med. 2016;34:89–93. https://doi.org/10.1016/j.ejim.2016.08.019. - DOI - PubMed
-
- Cowey S, Hardy RW. The metabolic syndrome: a high-risk state for cancer? Am J Pathol. 2006;169:1505–22. https://doi.org/10.2353/ajpath.2006.051090. - DOI - PMC - PubMed
-
- Saidi SA, Holland CM, Charnock-Jones DS, Smith SK. In vitro and in vivo effects of the PPAR-alpha agonists fenofibrate and retinoic acid in endometrial cancer. Mol Cancer. 2006;5:13. https://doi.org/10.1186/1476-4598-5-13. - DOI - PMC - PubMed
LinkOut - more resources
Full Text Sources
Other Literature Sources
