. 2018 Feb;28(2):204-220.
doi: 10.1038/cr.2018.1. Epub 2018 Jan 9.

Histone H3 lysine 4 monomethylation modulates long-range chromatin interactions at enhancers

Affiliations

Histone H3 lysine 4 monomethylation modulates long-range chromatin interactions at enhancers

Jian Yan et al. Cell Res. 2018 Feb.

Erratum in

Abstract

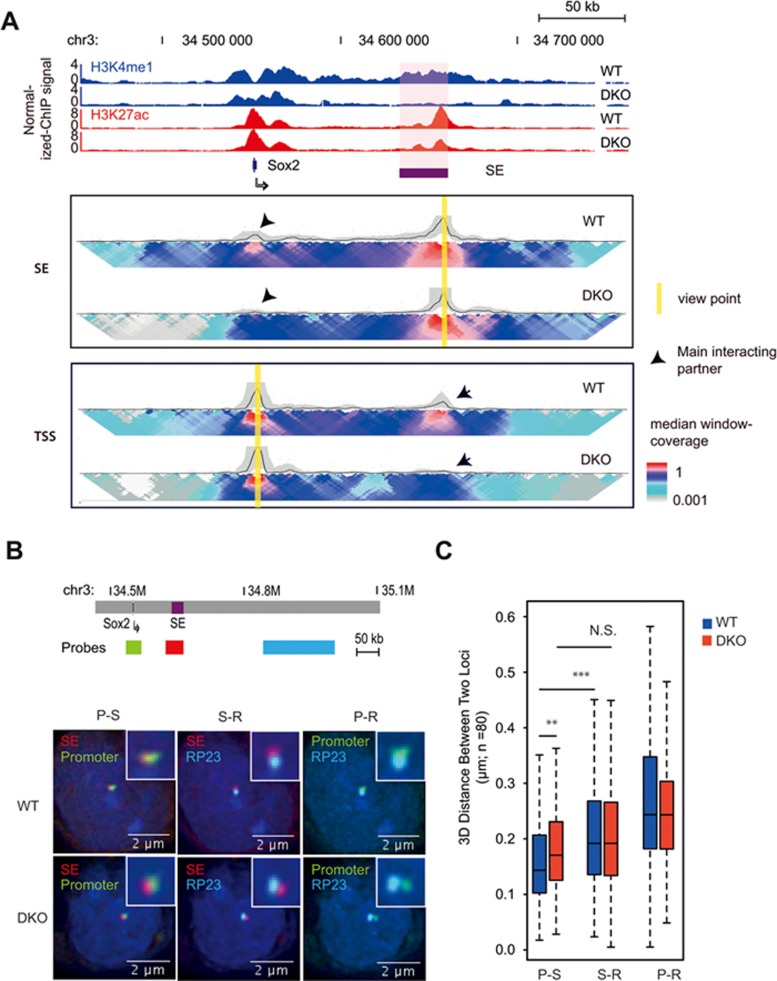
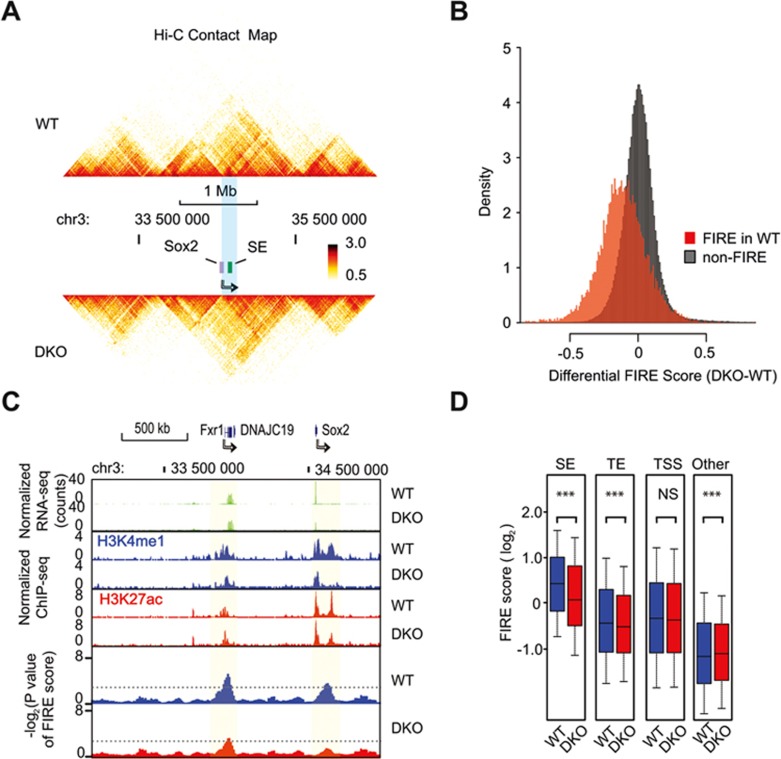
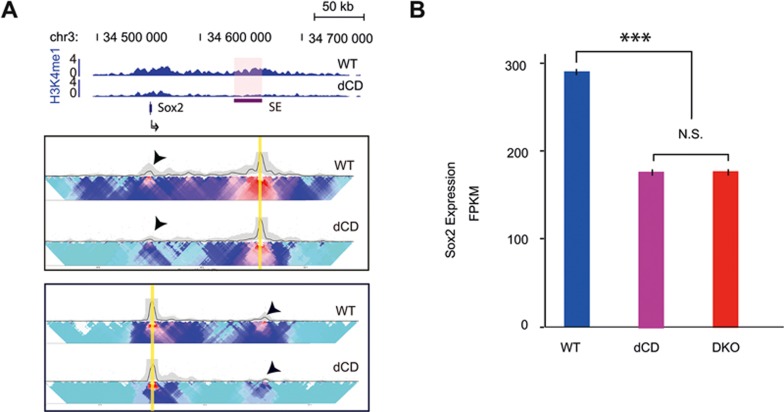
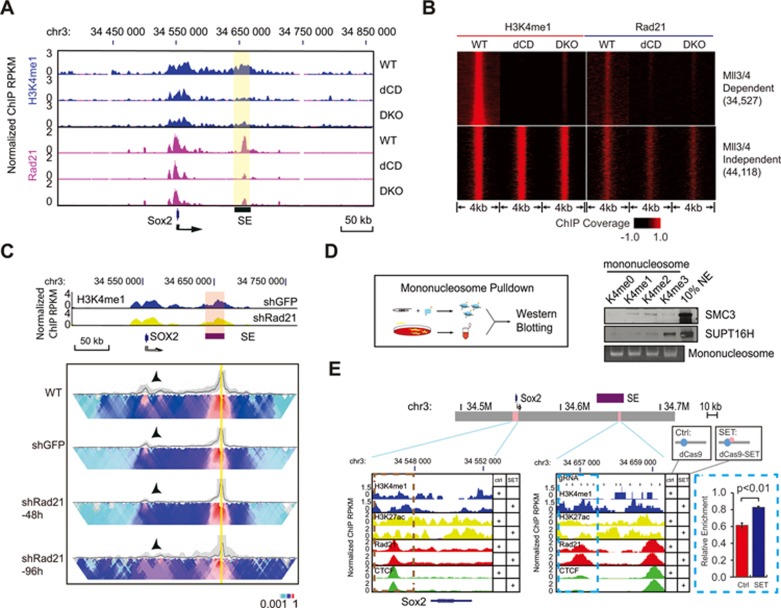
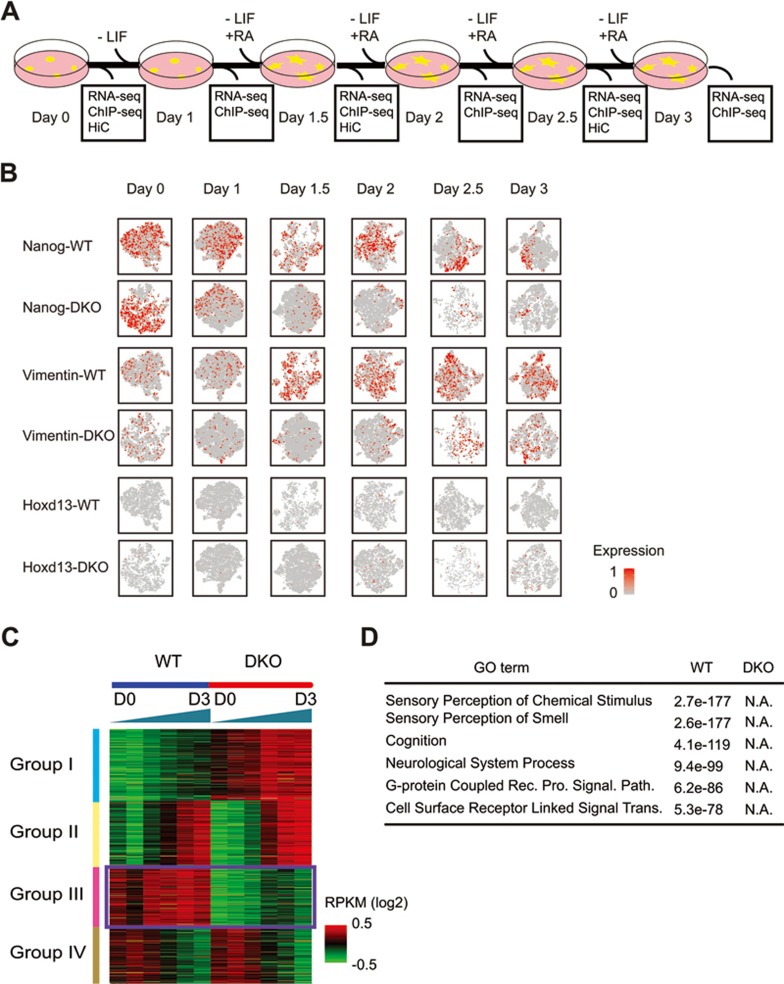
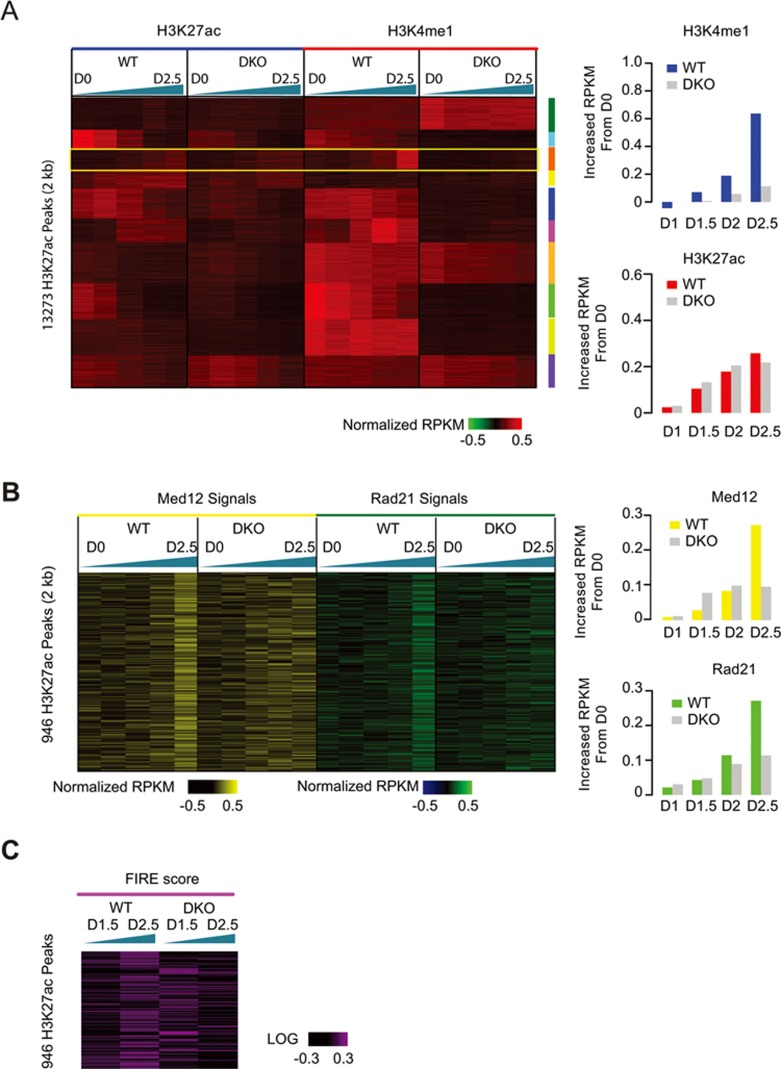
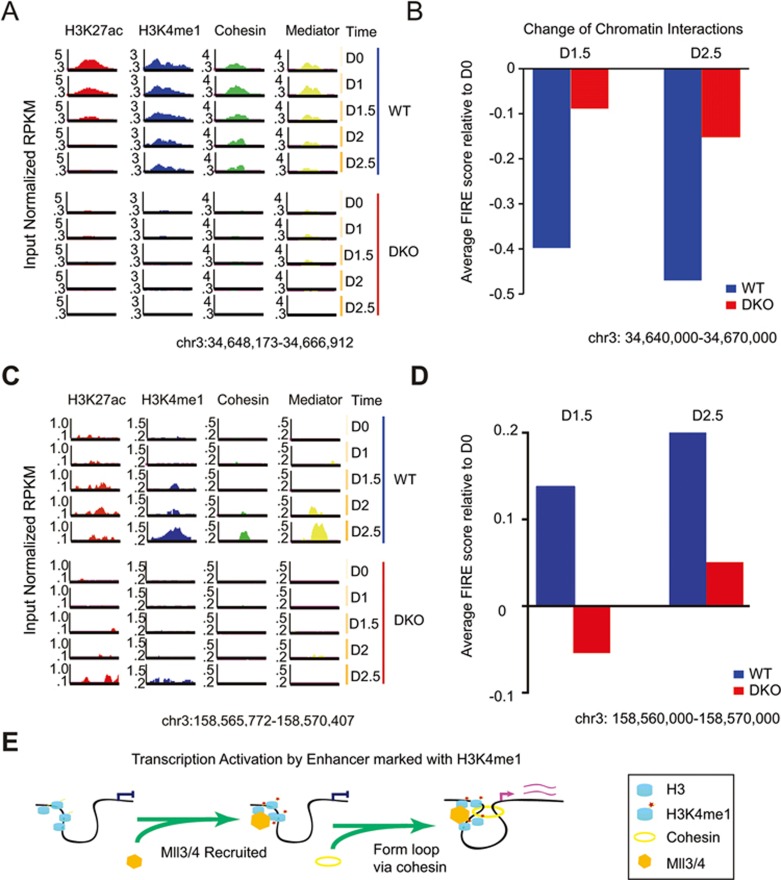
Long-range chromatin interactions between enhancers and promoters are essential for transcription of many developmentally controlled genes in mammals and other metazoans. Currently, the exact mechanisms that connect distal enhancers to their specific target promoters remain to be fully elucidated. Here, we show that the enhancer-specific histone H3 lysine 4 monomethylation (H3K4me1) and the histone methyltransferases MLL3 and MLL4 (MLL3/4) play an active role in this process. We demonstrate that in differentiating mouse embryonic stem cells, MLL3/4-dependent deposition of H3K4me1 at enhancers correlates with increased levels of chromatin interactions, whereas loss of this histone modification leads to reduced levels of chromatin interactions and defects in gene activation during differentiation. H3K4me1 facilitates recruitment of the Cohesin complex, a known regulator of chromatin organization, to chromatin in vitro and in vivo, providing a potential mechanism for MLL3/4 to promote chromatin interactions between enhancers and promoters. Taken together, our results support a role for MLL3/4-dependent H3K4me1 in orchestrating long-range chromatin interactions at enhancers in mammalian cells.


Figures

Figure 1
Figure 1
MLL3/4 and H3K4me1 are required for chromatin interactions at the Sox2 enhancer. (A) ChIP-seq and 4C-Seq analysis of Sox2 locus in wild type, MLL3/4 double-knockout mESCs. Top, genome browser snapshot of ChIP-seq data showing loss of H3K4me1 at Sox2 SE in MLL3/4 double-knockout mESCs. WT, wild type mouse ES cell line E14. DKO, MLL3/4 double-knockout mouse ES cell line. y-axis shows input normalized ChIP-seq RPKM. Sox2 SE is indicated in red shade. Sox2 gene locus is indicated by arrow. Bottom, 2D-heat map of 4C-seq analysis showing significant reduction in contact frequency between Sox2 TSS and Sox2-SE in DKO cells relative to WT cells. The same genomic position is aligned with genome browser snapshot for ChIP-seq analysis. Panel SE, 4C-seq with viewpoint at Sox2 SE locus, highlighted by yellow bar. Panel TSS, 4C-seq viewpoint at Sox2 TSS locus, highlighted by yellow bar. Black arrows emphasize the main interacting partner with the viewpoint. Heatmap shows the median genomic coverage using different sizes of sliding windows between 2 kb (top row) and 50 kb (bottom row). The gray shade above the heatmap shows the genomic coverage between 20th and 80th percentile values using a slide window of 5 kb. The black trend line indicates the median genomic coverage using a slide window of 5 kb. (B) 3D FISH microscopy images showing that physical distance between Sox2 SE and promoter becomes larger in DKO mESC, relative to WT. Top, schematic showing relative genomic positions for 3D FISH probes. Bottom, 3D FISH images showing overlay signals for probe set combinations in representative WT and DKO mESC. Nucleus was stained with DAPI. Insets show the zoom in of probe-detected foci for clearance. Red color, probes hybrid to SE locus, Green color, probes detecting promoter locus; Cyan color, probes detecting a region (RP23) that is located 100 kb downstream from SE. Note that Promoter is ∼100 kb upstream of SE. (C) Summary of FISH data from approximately 80 individual cells for both WT and DKO cell types. y-axis shows the distance between the centers of two foci represented by two colors. Scale bar is shown at the bottom right corner of each image. Note that distance between promoter and SE was significantly larger in DKO than WT. S-R, distance between RP23 and SE; P-R, distance between RP23 and Promoter; P-S, distance between Promoter and SE. Stars indicate statistical significance tested with Mann-Whitney U test (**P < 0.01; ***P < 0.005). RPKM, reads per kilobase pair per million total reads; SE, super enhancer. See also Supplementary information, Figures S1 and S2.
Figure 2
Figure 2
MLL3/4-dependent H3K4me1 shows reduced chromatin interactions in DKO mESC. (A) Heatmap showing the chromosomal contacts near the Sox2 locus, as determined in in situ Hi-C experiments. The upper panel shows the WT cells and lower panel shows the DKO cells. Sox2 gene is indicated by the violet box and an arrow. Color key shows the normalized contact frequency. (B) Histogram showing the distribution of differential FIRE scores across 10 kb bins (DKO-WT). Red, bins classified as FIRE regions in WT cells; Grey, non-FIRE bins in WT cells. (C) Genome browser track shows correlation between the change of FIRE scores (bottom) and changes of H3K4me1 ChIP-seq RPKM (middle) upon MLL3/4 knockout. Partial loss of SOX2 expression is also shown (top). For comparison, FXR1 or DNAJC19 expression is stable, consistent with the stable FIRE structure. The light green shades indicate the FIRE regions. Dashed lines label the cutoff for FIRE. (D) Boxplots comparing log2 value of FIRE scores in WT (blue) and DKO (red) for bins containing different classes of cis-regulatory elements (TE, SE and TSS). Other, bins with increased FIRE scores in DKO relative to WT. The P value below each category was computed by two-tail paired Welch t-test. Asterisk indicates that the difference is statistically significant. Note that SE displays the highest FIRE score among all elements tested here and SE, TE and TSS generally have higher FIRE score than the average genome. SE, super enhancer; TE, typical enhancer; TSS, transcription-starting site. See also Supplementary information, Table S1, Figures S3 and S4.
Figure 3
Figure 3
MLL3/4 methyltransferase activity is required for chromatin interactions and gene expression at the Sox2 enhancer. (A) ChIP-seq and 4C-Seq analysis of Sox2 locus in wild type and MLL3/4 catalytic mutant mESCs. Similar to DKO cells (Figure 1A), reduction of chromatin interactions between Sox2 SE and TSS was detected in dCD cells. (B) RNA-seq data shows that expression of Sox2 decreased in dCD and DKO cells compared with WT. FPKM is shown in y-axis. Error bars are derived from three biological replicates. See also Supplementary information, Figure S5.
Figure 4
Figure 4
MLL3/4-dependent H3K4me1 facilitates Cohesin binding to enhancers. (A) Genome browser tracks showing loss of Cohesin (Rad21) binding at the Sox2 gene and Sox2 SE (indicated in violet shade) in MLL3/4 DKO and dCD cells. Top, relative genomic positions of the Sox2 gene and Sox2 SE; Middle, RNA-seq tracks show Sox2 expression for reference, quantified in Figure 1D; Bottom, normalized ChIP-seq signals of H3K4me1, Rad21 and Med12 at the Sox2 locus. (B) ChIP-seq analysis showing binding of Cohesin to MLL3/4-dependent H3K4me1 peaks in DKO and dCD cells. ChIP-seq signals are centered around H3K4me1 peaks and extended 2 kb upstream and downstream along the genome. x-axis indicates relative coordinates to peaks center. Heatmap shows ChIP-seq coverage value. Note that Cohesin (Rad21) is affected at MLL3/4-dependent H3K4me1 regions in both dCD and DKO cells, coinciding with the loss of H3K4me1. (C) Genome browser tracks showing knockdown of Cohesin complex (shRad21) does not cause overt change of H3K4me1 signals and 4C interactions at the Sox2 locus. Top, normalized H3K4me1 ChIP-seq tracks for control and Rad21 knockdown cells. shGFP, control using shRNA against GFP sequences. SE, super enhancer, indicated also by violet shade. Bottom, 4C-seq analysis showing that chromatin interactions between Sox2 SE and promoter are reduced upon Rad21 depletion by shRNA. shRad21-48h, shRNA knockdown targeting RAD21 mRNA 48 h after lentivirus infection. shRad21-96h, shRNA knockdown targeting RAD21 mRNA 96 h after lentivirus infection. Black arrows emphasize the main interacting partner with the viewpoint. Heatmap shows the median genomic coverage of the indicated position using different sizes of sliding windows between 2 kb (top row) and 50 kb (bottom row). The gray shade above the heatmap shows the genomic coverage between 20th and 80th quantile values using a slide window of 5 kb. The black trend line indicates the median genomic coverage using a slide window of 5 kb. Note that the interaction between Sox2 SE and gene body is dramatically lost at 96 h post knock-down via lentivirus. (D) The in vitro pull-down assay showing that Cohesin (Smc3) preferentially associate to H3K4me1 and H3K4me2 mononucleosomes. Top, schematic showing assay workflow. Modified H3 histones are assembled into biotinylated DNA-bound nucleosomes in vitro. Nucleosomes were then incubated with HeLa nuclear lysate and the Streptavidin pull-down fractions were assayed for binding factors with Western blotting. Bottom, Western blots showing binding of SMC3 and SUPTH binding to H3K4 unmodified (K4me0), mono- (K4me1), di- (K4me2) and tri- (K4me3) methylated nucleosomes. The FACT complex subunit SUPT16H is used as a control to show that FACT binds preferentially to H3K4me3 mono-nucleosomes. Agarose gel staining for 601λ DNA was used as loading control for mononucleosomes. (E) Genome browser tracks showing increased H3K4me1 and Cohesin (RAD21 subunit) binding in the Sox2 SE locus in DKO cells expressing dCas9-MLL3SET. DKO cells were transfected with vectors co-expressing tiling CRIPSR guides targeting Sox2 SE and dCas9 proteins with or without MLL3SET domain fusion. Top, schematic of the Sox2 loci assayed. Pink boxes indicate genomic regions of interest. SE (purple), Sox2 SE. Bottom panels, genome browser tracks showing normalized ChIP-seq coverage in RPKM for H3K4me1, H3K27ac, RAD21 and CTCF at control region (Sox2 promoter, encircled by brown dashed box) and the guide RNA targeted region of Sox2 SE (encircled by blue dashed box). y-axis, relative RPKM coverage was calculated by normalizing to the constant, CTCF-overlapping major peak right to the dashed box. The bar plot shows the quantification of RAD21 ChIP-qPCR enrichment at the blue dash box indicated region in control cells (red) and cells transfected with dCas9-MLL3SET (blue). Ctrl, dCas9 without MLL3SET domain. SET, dCas9-MLL3SET fusion protein. SE, super enhancer. See also Supplementary information, Figure S5.
Figure 5
Figure 5
Characterization of gene expression during NPC differentiation in WT and DKO mESC. (A) Scheme of differentiation protocol. Data was collected for RNA-seq and ChIP-seq at every 12-h time points and Hi-C at every 24-h time points. (B) Single-cell RNA analysis of NPC differentiation. Each panel represents 2-D t-SNE (stochastic neighbor embedding) projection of the cells colored by the total UMI counts per cell. x-axis represents t-SNE-1 and y-axis shows t-SNE-2. Red color indicates high expression of the gene that is noted on the left of each row. Each column represents a time point indicated by A. Expression patterns of Nanog and Vimentin showed that the cell population was well synchronized and no overt subgroup was observed. Nanog, pluripotency marker in embryonic stem cells. Hoxd13 had slight increase in expression in DKO cells. Vimentin, marker for neural progenitor. Hoxd13, posterior HOX transcription factor normally expressed in the posterior part of the body plan during development. (C) Clustering analysis of bulk RNA-seq from WT and DKO cells showing that genes could be clustered to four different groups depending on the panel of change along differentiation. Note that Group I and Group III genes are mostly MLL3/4-dependent and they behave differentially between WT and DKO cells. Group II and Group IV are MLL3/4-independent genes and they are expressed in the same pattern in two cell types. (D) Gene ontology analysis showing that genes induced only in WT cells are mostly related to neuron function. Note that no GO terms could be detected in genes that are induced only in DKO cells. See also Supplementary information, Figure S5 and Table S7.
Figure 6
Figure 6
Characterization of H3K4me1, Cohesin and chromatin interactions during NPC differentiation of WT and DKO mESC. (A) Clustering analysis showing that H3K27ac peaks could be classified to 10 different groups per change in both H3K27ac and H3K4me1 signals in WT and DKO cells during differentiation. The color key shows the log2 value of transformed input normalized RPKM value of each peak. Green triangle shows the differentiation time with the thicker side representing later time points. Yellow box emphasizes the group that shows induced H3K27ac and H3K4me1 signal in WT cells along differentiation. The right bar charts show the averaged signal of H3K4me1 (top) and H3K27ac (bottom) of group III at D0, Day1, D2 and D2.5. (B) Heatmap showing the change of input normalized Mediator subunit Med12 (left) and Cohesin subunit Rad21 RPKM (right) at Group III H3K4me1 peaks emphasized in A. Note that Cohesin and Mediator binding also tends to increase in WT cells but not in DKO cells. The right bar charts show the averaged signal of H3K4me1 (top) and H3K27ac (bottom) of group III. (C) Heatmap showing the change of FIRE score at Group III H3K4me1 peaks emphasized in A. Note that FIRE score tends to increase in WT cells but not in DKO cells. See also Supplementary information, Figure S6 and Table S3.
Figure 7
Figure 7
Dynamic histone modification, Cohesin occupancy and changes in chromatin interactions at representative loci. (A) Genome browser track showing that at Sox2 SE locus, H3K27ac and H3K4me1 signals were enriched in WT cells but not in DKO cells on Day 0. Along cellular differentiation, H3K27ac and H3K4me1 signals gradually decreased, while Mediator and Cohesin binding were also alleviated. Note that Cohesin and Mediator started decreasing at Day 1.5 while both H3K27ac and H3K4me1 started decreasing at Day 1. By contrast, none of the factors could be detected in DKO. y-axis shows input normalized ChIP-seq RPKM. (B) Bar chart showing change of chromatin interactions (FIRE score). Blue bars indicate FIRE score at each time point relative to Day 0. The 30 kb regions are enclosing the entire Sox2 SE in A. The change of FIRE score in DKO (red bars) was mild compared to WT. (C) Genome browser track showing at a representative locus, H3K27ac and H3K4me1 signals gradually increased along cellular differentiation, starting from Day 1.5. Meanwhile, Mediator and Cohesin are also detected to be initiated at Day 2. By contrast, in DKO cells, none of the factors could be detected until Day 2.5. y-axis shows input normalized ChIP-seq RPKM. (D) Bar chart showing change of chromatin interactions enclosed in C (FIRE score). Blue bars indicate FIRE score at each time point relative to Day 0. The 10 kb regions are enclosing the entire 5 kb region shown in panel A. Less change in FIRE score was observed in DKO (red bars) than in WT. (E) A model depicting MLL3/4 and H3K4me1's role in establishment of chromatin interactions at enhancers. When H3K4 is not methylated at distal enhancer, the promoter is physically separated in different nuclear territory (left). MLL3/4 are recruited to distal enhancers, leading to monmethylation of lysine 4 of histone H3 (middle). Subsequently, the Cohesin complex is recruited to mediate the looping interaction between gene promoter and enhancer. RPKM, reads per kilobase pair per million total reads; SE, super enhancer. See also Supplementary information, Figure S7 and Table S4

References

    1. Lee TI, Young RA. Transcriptional regulation and its misregulation in disease. Cell 2013; 152:1237–1251. - PMC - PubMed
    1. Levine M. Transcriptional enhancers in animal development and evolution. Curr Biol 2010; 20:R754–763. - PMC - PubMed
    1. Levine M, Cattoglio C, Tjian R. Looping back to leap forward: transcription enters a new era. Cell 2014; 157:13–25. - PMC - PubMed
    1. Makova KD, Hardison RC. The effects of chromatin organization on variation in mutation rates in the genome. Nat Rev Genet 2015; 16:213–223. - PMC - PubMed
    1. Ong CT, Corces VG. Enhancer function: new insights into the regulation of tissue-specific gene expression. Nat Rev Genet 2011; 12:283–293. - PMC - PubMed

MeSH terms