. 2018 May 1;596(9):1639-1657.
doi: 10.1113/JP274986. Epub 2018 Jan 24.

Layer-specific excitation/inhibition balances during neuronal synchronization in the visual cortex

Affiliations

Layer-specific excitation/inhibition balances during neuronal synchronization in the visual cortex

Hillel Adesnik. J Physiol. .

Abstract

Key points: Understanding the balance between synaptic excitation and inhibition in cortical circuits in the brain, and how this contributes to cortical rhythms, is fundamental to explaining information processing in the cortex. This study used cortical layer-specific optogenetic activation in mouse cortex to show that excitatory neurons in any cortical layer can drive powerful gamma rhythms, while inhibition balances excitation. The net impact of this is to keep activity within each layer in check, but simultaneously to promote the propagation of activity to downstream layers. The data show that rhythm-generating circuits exist in all principle layers of the cortex, and provide layer-specific balances of excitation and inhibition that affect the flow of information across the layers.

Abstract: Rhythmic activity can synchronize neural ensembles within and across cortical layers. While gamma band rhythmicity has been observed in all layers, the laminar sources and functional impacts of neuronal synchronization in the cortex remain incompletely understood. Here, layer-specific optogenetic stimulation demonstrates that populations of excitatory neurons in any cortical layer of the mouse's primary visual cortex are sufficient to powerfully entrain neuronal oscillations in the gamma band. Within each layer, inhibition balances excitation and keeps activity in check. Across layers, translaminar output overcomes inhibition and drives downstream firing. These data establish that rhythm-generating circuits exist in all principle layers of the cortex, but provide layer-specific balances of excitation and inhibition that may dynamically shape the flow of information through cortical circuits. These data might help explain how excitation/inhibition (E/I) balances across cortical layers shape information processing, and shed light on the diverse nature and functional impacts of cortical gamma rhythms.

Keywords: E/I balance; V1; balance of excitation and inhibition; cortical circuits; cortical layers; gamma oscillations; optogenetics; visual cortex.


Figures

Figure 1
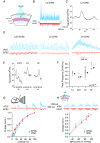
Figure 1. Visually and optogenetically evoked gamma rhythms in the primary visual cortex in vivo
A, top: experimental schematic diagram. Bottom: example local field potential (LFP) response recorded in layer 2/3 of V1 to a full field drifting grating. B, top: experimental schematic diagram. Bottom: LFP response in the same mouse in a subsequent trial to optogenetic stimulation of excitatory neurons. The blue ramp indicates the time and shape of the optogenetic stimulus. C, average power spectra (±SEM) computed for the visual stimulus and optogenetic stimulus conditions. D, left: average peak frequency (20–80 Hz) of the LFP power spectrum during visual and optogenetic stimulation. Right: mean power in the same spectra. Error bars are SEM. E, scatter plot of the peak power in the gamma band between visually induced and optogenetically induced gamma oscillations on interleaved trials (n = 8 mice; P < 0.05, signed rank test). F, example synaptic current traces recorded in a L2/3 neuron in voltage clamp in vivo during visual stimulation. G, as in F, but during optogenetic activation of L4 in the same cell. The blue ramp indicates the time and shape of the optogenetic stimulus.
Figure 2
Figure 2. Characterization of gamma rhythms induced by excitatory neurons in different cortical layers
A, left: example LFP traces recorded in vivo in response to a slow ramp of blue light in three different mice expressing ChR2 in L2/3, L5 or L6. B, example average power spectra (± SEM) for the LFP when photo‐stimulating neurons in the indicated layers. C, scatter plot of the frequency of the gamma band peak (20‐80 Hz) measured for in vivo photo‐stimulation of excitatory neurons in each layer (P < 0.05, one‐way ANOVA). D, scatter plot of peak gamma band power (power at the peak frequency) for the same experiments (P = 0.51, one‐way ANOVA). E, example polar histogram of the computed phased of detected spikes in an example L4‐ChR2 unit recording. F, top: low‐pass filtered (0–200 Hz, black) and high‐pass filtered (500–5000 Hz, grey) trace from an example trial during photo‐stimulation of L4 (light is on during the entire trace). Bottom: extracted phase vector (green) and detected spike times (asterisks) from the traces above. G, plot of the average phase of detected spikes during photo‐stimulation versus electrode depth in V1 for L4 photo‐stimulation (left) and L5 photo‐stimulation (right) (n = 5 L4‐ChR2 mice, n = 6 L5‐ChR2 mice, P < 0.005, rank sum test). H, scatter plot of computed pairwise phase consistency (PPC) for detected spikes in L4‐ChR2 experiments (left), and those for L5‐ChR2 experiments (right).
Figure 3
Figure 3. Gamma rhythms can be generated by excitatory cells in any cortical layer in vitro
A, schematic diagram of a brain slice expressing ChR2 in L4 excitatory neurons (red shading) prepared for optogenetic activation. B, example excitatory (red) and inhibitory (blue) synaptic currents recorded in a L2/3 pyramidal cell during optogenetic activation of L4. C, example average power spectrum (±SEM) of the inhibitory currents for a L4 cell. D, left: example excitatory (red) and inhibitory (blue) synaptic current traces recorded in ChR2‐negative neurons in brain slices from mice expressing ChR2 in L2/3 (left), in L5 (middle), or in L6 (right). E, example average power spectra (±SEM) for the inhibitory currents in mice where L23, L5, or L6 was photo‐stimulated. Spectra come from a ChR2 cell in the expressing layer. F, average peak frequencies (20–80 Hz) for the power spectra of the LFP from mice expressing ChR2 in L4, L2/3, L5, and L6 (P < 10−8, one‐way ANOVA). G, contrast–response functions of synaptic excitation and inhibition in L2/3 neurons recorded in vivo (n = 6 cells). Top: experimental schematic diagram and example traces. H, light dose–response functions from L2/3 neurons recorded in brain slices as the slope of the light ramp was systematically increased (n = 7 cells). Top: experimental schematic diagram and example traces. Error bars are SEM.
Figure 4
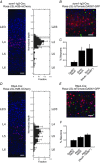
Figure 4. Histological characterization of scnn1‐tg3‐ and Rpb4‐Cre lines
A, left: confocal image of a vertical strip of V1 from an scnn1‐tg3‐Cre mouse crossed to a Rosa‐LSL‐H2B‐mCherry reporter, and immunostained for the neuron‐specific marker, NeuN (blue). Right: quantification of mCherry‐expressing neurons versus cortical depth (normalized across brain sections to correct for variations in cortical thickness). Horizontal dashed lines indicate the approximate L4 boundaries (grey area is SEM) B, example image from a triple transgenic mouse labelling Cre‐expressing cells with tdTomato and inhibitory neurons with GFP; NeuN is blue. C, quantification of the fraction of layer 4 neurons expressing GAD67‐GFP (GFP+/NeuN+, left bar), Cre (mCherry+/NeuN+, middle bar), and the total estimated fraction of excitatory neurons in layer 4 expressing Cre (mCherry+/NeuN+‐GFP+ right bar). No overlap was seen between GFP and tdTomato. DF, as in AC but for the Rbp4‐Cre line in layer 5. All error bars are SEM.
Figure 5
Figure 5. Layer 4 induced gamma rhythms suppress L4 but facilitate L2/3 and L5
A, left: recording schematic diagram. A simultaneous triple whole cell recording is obtained from a L4, a L2/3, and a L5 excitatory neuron along the same vertical axis of V1. ChR2 is expressed specifically in L4 excitatory neurons (indicated by red shading) in an scnn1‐tg3‐Cre mouse injected with a Cre‐dependent ChR2‐tdTomato virus. Right: example image from an scnn1‐tg3‐Cre mouse crossed to a Rosa‐LSL‐tdTomato reporter strain. B, example synaptic excitatory (red) and inhibitory (blue) currents recorded simultaneously in a L4 (left), a L2/3 (middle), and a L5 excitatory neuron. C, left: average E/I ratio of the synaptic charge in L4, L2/3 and L5 excitatory neurons across 10 triple and an additional 10 paired whole cell recordings. Middle: average net excitatory charge, normalized to the charge measured in the L4 neuron. Right: average normalized net inhibitory charge. D, average coherence spectra (± 95% confidence intervals) of the EPSCs (E‐E, red) and IPSCs (I‐I, blue) recorded across the pair of cells indicated at the top of each plot. E, example membrane potential traces from a ChR2‐negative L4 excitatory neuron (left), a L2/3 pyramidal cell (middle), and a L5 pyramidal cell (right) driven to spike with a square current pulse through the patch electrode (left) and with the addition of the optogenetic activation of L4 (right). Red dashed lines are to aid in the visual comparison of the V m between the presence and absence of photo‐stimulation. Left inset: scatter plot of mean membrane potential changes in the L4 cell during photo‐stimulation (P < 0.005, signed rank test). F, left: scatter plot of the change in spike rate for all recorded neurons during optogenetic activation of L4. Right: plot of the mean change in firing rate during photo‐induced gamma activity across the three layers. All error bars are SEM.
Figure 6
Figure 6. L5 induced gamma rhythms suppress L5 but facilitate L2/3
A, left: recording schematic diagram. A simultaneous triple whole cell recording is obtained from a L4, a L2/3, and a L5 excitatory neuron along the same vertical axis of V1. ChR2 is expressed specifically in L5 excitatory neurons (indicated by red shading) in an Rbp4‐Cre mouse injected with a Cre‐dependent ChR2‐tdTomato virus. Right: example image from an Rbp4‐Cre mouse crossed to a Rosa‐LSL‐tdTomato reporter strain. B, example synaptic excitatory (red) and inhibitory (blue) currents recorded simultaneously in a L4 (left), a L2/3 (middle), and a L5 (right) excitatory neuron. C, left: average E/I ratio of the synaptic charge in L4, L2/3 and L5 excitatory neurons across 11 multiple whole cell recordings. Middle: average net excitatory charge, normalized to the charge measured in the L5 neuron. Right: average normalized net inhibitory charge. D, average coherence spectra (± 95% confidence intervals) of the EPSCs (E‐E, red) and IPSCs (I‐I, blue) recorded across the pair of cells indicated at the top of each plot. E, example membrane potential traces from a L4 cell (left), a L2/3 cell (middle) and a ChR2‐negative L5 cell (right) driven to spike with a square current pulse through the patch electrode (left) and with the addition of the optogenetic activation of L5 (right). Red dashed lines are to aid in the visual comparison of the V m between the presence and absence of photo‐stimulation. F, left: scatter plot of the change in spike rate for all recorded neurons during optogenetic activation of L5. Right: plot of the mean change in firing rate during photo‐induced gamma activity across the three layers. All error bars are SEM.
Figure 7
Figure 7. L2/3 induced gamma oscillations suppress L2/3 but facilitate L5
A, left: recording schematic diagram. A simultaneous triple whole cell recording is obtained from a L4, a L2/3, and a L5 excitatory neuron along the same vertical axis of V1. ChR2 is expressed specifically in L2/3 pyramidal neurons (indicated by red shading) via timed in utero electroporation of a ChR2‐expressing plasmid. Right: example image from a mouse electroporated in utero with ChR2. B, example synaptic excitatory (red) and inhibitory (blue) currents recorded simultaneously in a L4 (left), a L2/3 (middle), and a L5 (right) excitatory neuron. C, left: average excitatory/inhibitory ratio of the synaptic charge in L4, L2/3 and L5 excitatory neurons across 11 multiple whole cell recordings. Middle: average net excitatory charge, normalized to the charge measured in the L2/3 neuron. Right: average normalized net inhibitory charge. D, average coherence spectra (± 95% confidence intervals) of the EPSCs (E‐E, red) and IPSCs (I‐I, blue) recorded across the pair of cells indicated at the top of each plot. E, example membrane potential traces from a ChR2‐negative L2/3 cell (left), and a L5 cell (right) driven to spike with a square current pulse through the patch electrode (left) and with the addition of the optogenetic activation of L2/3 (right). Red dashed lines are to aid in the visual comparison of the V m between the presence and absence of photo‐stimulation. F, left: scatter plot of the change in spike rate for all recorded neurons during optogenetic activation of L2/3. Right: plot of the mean change in firing rate during photo‐induced gamma activity across L2/3 and L5. All error bars are SEM.

Comment in

References

    1. Adesnik H (2017). Synaptic mechanisms of feature coding in the visual cortex of awake mice. Neuron 95, 1147–1159. - PMC - PubMed
    1. Adesnik H, Bruns W, Taniguchi H, Huang ZJ & Scanziani M (2012). A neural circuit for spatial summation in visual cortex. Nature 490, 226–231. - PMC - PubMed
    1. Adesnik H & Scanziani M (2010). Lateral competition for cortical space by layer‐specific horizontal circuits. Nature 464, 1155–1160. - PMC - PubMed
    1. Ainsworth M, Lee S, Cunningham MO, Roopun AK, Traub RD, Kopell NJ & Whittington MA (2011). Dual gamma rhythm generators control interlaminar synchrony in auditory cortex. J Neurosci 31, 17040–17051. - PMC - PubMed
    1. Atallah BV & Scanziani M (2009). Instantaneous modulation of gamma oscillation frequency by balancing excitation with inhibition. Neuron 62, 566–577. - PMC - PubMed

Publication types

MeSH terms

LinkOut - more resources