

What does the dot-probe task measure? A reverse correlation analysis of electrocortical activity
- PMID: 29314050
- PMCID: PMC5940518
- DOI: 10.1111/psyp.13058
What does the dot-probe task measure? A reverse correlation analysis of electrocortical activity
Abstract
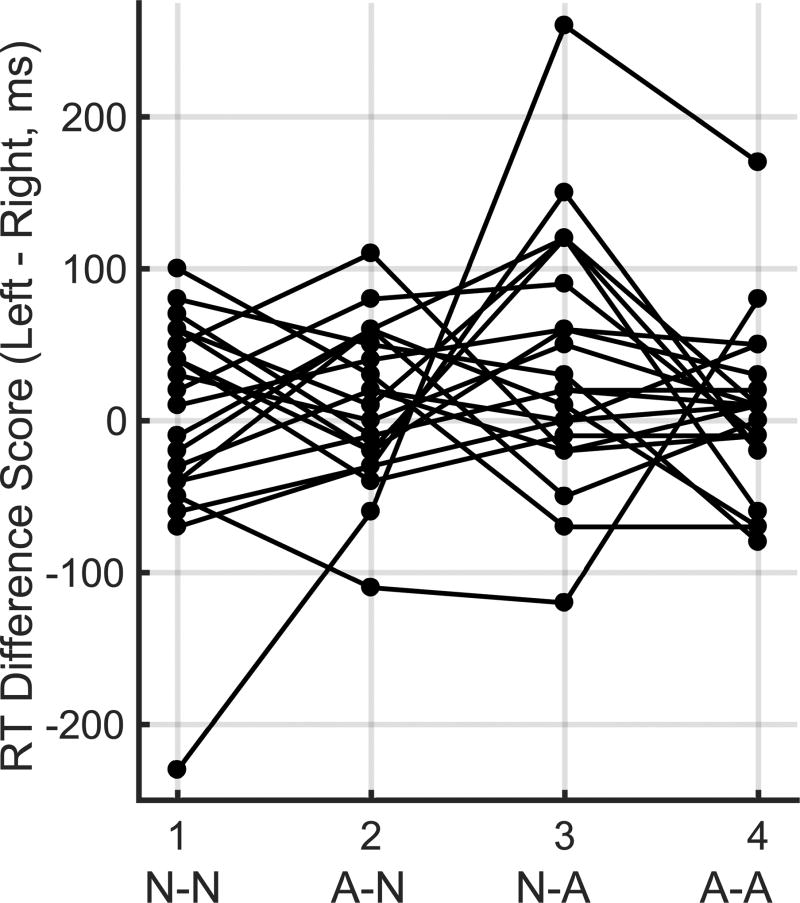
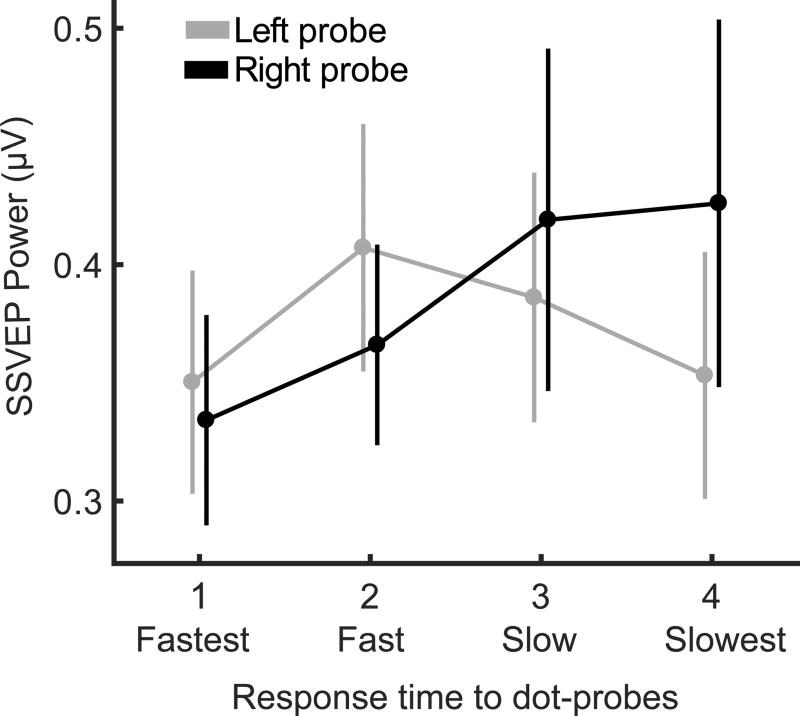
The dot-probe task is considered a gold standard for assessing the intrinsic attentive selection of one of two lateralized visual cues, measured by the response time to a subsequent, lateralized response probe. However, this task has recently been associated with poor reliability and conflicting results. To resolve these discrepancies, we tested the underlying assumption of the dot-probe task-that fast probe responses index heightened cue selection-using an electrophysiological measure of selective attention. Specifically, we used a reverse correlation approach in combination with frequency-tagged steady-state visual potentials (ssVEPs). Twenty-one participants completed a modified dot-probe task in which each member of a pair of lateralized face cues, varying in emotional expression (angry-angry, neutral-angry, neutral-neutral), flickered at one of two frequencies (15 or 20 Hz), to evoke ssVEPs. One cue was then replaced by a response probe, and participants indicated the probe orientation (0° or 90°). We analyzed the ssVEP evoked by the cues as a function of response speed to the subsequent probe (i.e., a reverse correlation analysis). Electrophysiological measures of cue processing varied with probe hemifield location: Faster responses to left probes were associated with weak amplification of the preceding left cue, apparent only in a median split analysis. By contrast, faster responses to right probes were systematically and parametrically predicted by diminished visuocortical selection of the preceding right cue. Together, these findings highlight the poor validity of the dot-probe task, in terms of quantifying intrinsic, nondirected attentive selection irrespective of probe/cue location.
Keywords: EEG; anxiety; attention; emotion; face processing; hemispheric differences/laterality.
© 2018 Society for Psychophysiological Research.
Figures


References
-
- Amir N, Beard C, Taylor CT, Klumpp H, Elias J, Burns M, Chen X. Attention training in individuals with generalized social phobia: A randomized controlled trial. J Consult Clin Psychol. 2009;77(5):961–73. https://doi.org/10.1037/a0016685. - DOI - PMC - PubMed
-
- Andersen SK, Fuchs S, Muller MM. Effects of Feature-selective and Spatial Attention at Different Stages of Visual Processing. J Cogn Neurosci. 2009 Retrieved from http://www.ncbi.nlm.nih.gov/entrez/query.fcgi?cmd=Retrieve&db=PubMed&dop.... - PubMed
-
- Andersen SK, Hillyard SA, Muller MM. Attention facilitates multiple stimulus features in parallel in human visual cortex. Curr Biol. 2008;18(13):1006–9. https://doi.org/10.1016/j.cub.2008.06.030. - DOI - PubMed
-
- Andersen SK, Muller MM, Hillyard SA. Color-selective attention need not be mediated by spatial attention. J Vis. 2009;9(6):2 1–7. https://doi.org/10.1167/9.6.2. - DOI - PubMed
-
- Anderson AK. Affective influences on the attentional dynamics supporting awareness. J Exp Psychol Gen. 2005;134(2):258–81. - PubMed
Publication types
MeSH terms
Grants and funding
LinkOut - more resources
Full Text Sources
Other Literature Sources
