. 2018 May;18(5):1247-1255.
doi: 10.1111/ajt.14645. Epub 2018 Feb 7.

Neutrophil derived CSF1 induces macrophage polarization and promotes transplantation tolerance

Affiliations

Neutrophil derived CSF1 induces macrophage polarization and promotes transplantation tolerance

Mounia S Braza et al. Am J Transplant. 2018 May.

Abstract

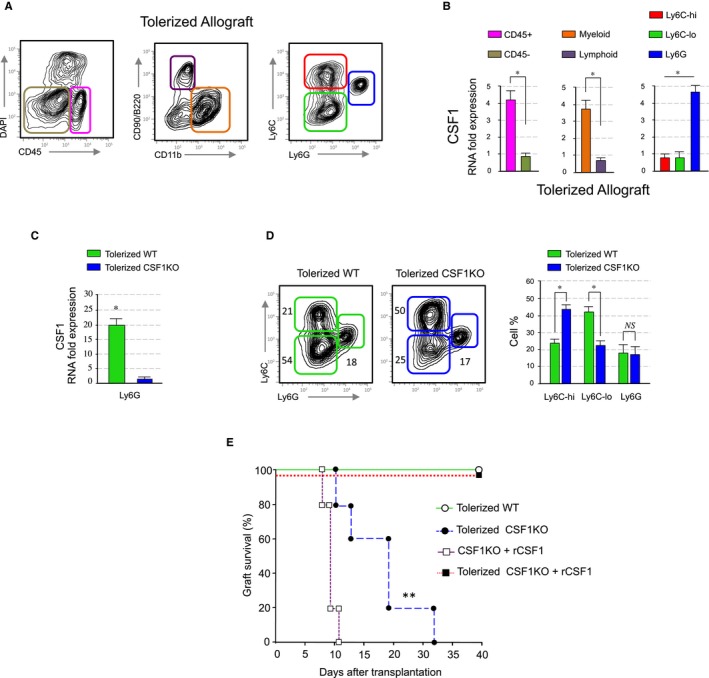
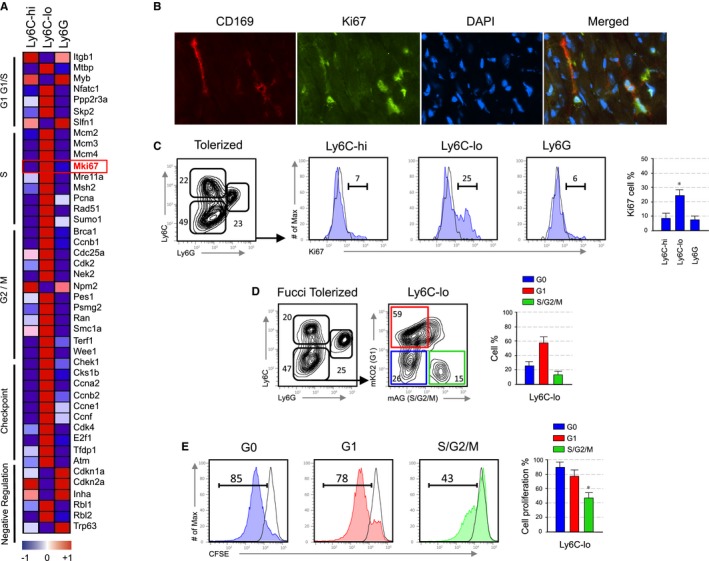
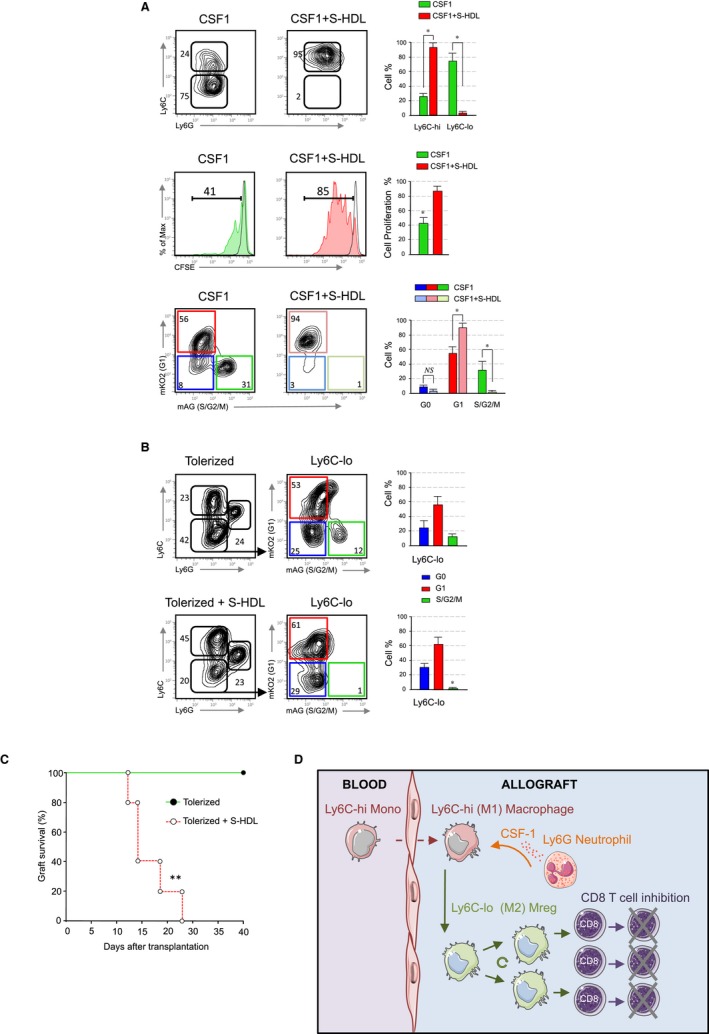
The colony-stimulating factor 1 (CSF1) regulates the differentiation and function of tissue macrophages and determines the outcome of the immune response. The molecular mechanisms behind CSF1-mediated macrophage development remain to be elucidated. Here we demonstrate that neutrophil-derived CSF1 controls macrophage polarization and proliferation, which is necessary for the induction of tolerance. Inhibiting neutrophil production of CSF1 or preventing macrophage proliferation, using targeted nanoparticles loaded with the cell cycle inhibitor simvastatin, abrogates the induction of tolerance. These results provide new mechanistic insights into the developmental requirements of tolerogenic macrophages and identify CSF1 producing neutrophils as critical regulators of the immunological response.

Keywords: basic (laboratory) research/science; immunobiology; macrophage/monocyte biology: differentiation/maturation; tolerance: mechanisms.


Figures

Figure 1
Figure 1
Neutrophil derived CSF1 mediates macrophage polarization. (A and B) CSF1 expression in the allografts. Heart allografts of CD40L mAb treated mice were isolated and single cells suspensions were made. CSF1 expression in distinct flow sorted cell subsets was investigated by qPCR. Results represent mean ± SEM of three independent experiments (unpaired Mann‐Whitney and Kruskal‐Walis with Dunn's multiple comparison test; *P ≤ .5). (C) CSF1 expression in the allografts of S100A8Cre CSFfl deficient recipient mice. Heart allografts of wt and S100A8Cre CSFfl recipients treated with CD40L mAb were analyzed for CSF1 expression by qPCR. Results represent mean ± SEM of three independent experiments (unpaired Mann‐Whitney test; *P ≤ .5). (D) Representative and quantitative flow cytometry results of graft infiltrating myeloid subsets from anti‐CD40L mAb treated wt and S100A8Cre CSFfl recipients at day 5 post‐transplantation. Results represent mean ± SEM (n = 4 mice per group of three independent experiments; unpaired Mann‐Whitney test; *P ≤ .5). (E) Graft survival of tolerized wt versus S100A8Cre CSFfl recipients. Tolerized S100A8Cre CSFfl recipient mice rejected their allografts despite anti‐CD40L mAb treatment. A third group of tolerized S100A8Cre CSFfl recipients received 2 × 105 U of recombinant CSF1 i.v. on the day of transplantation and on days 1‐5 post‐transplantation. Non‐tolerized S100A8Cre CSFfl recipients treated with 2 × 105 U of recombinant CSF1 were used as controls. Graft survival was assessed with Kaplan‐Meier analysis (MST 18 ± 8 days; ** P ≤ .01; n = 5 mice per group)
Figure 2
Figure 2
Suppressive function of polarized macrophages depends on cell proliferation. (A) Heatmap of cell cycle transcripts derived from microarray data with a P‐value P < .05 in the myeloid subsets obtained from the allografts of anti‐CD40L mAb treated recipients at day 5 post‐transplantation. Shown is an average of n = 3. (B) Representative immunofluorescent images of allograft tissue stained for CD169, Ki67, DAPI and a merge image depicting overlap obtained from an anti‐CD40L mAb treated recipients at day 5 post‐transplantation (magnification ×40). (C) Representative and quantitative flow cytometry results for Ki67 expression on myeloid subsets from the allografts of anti‐CD40L mAb treated recipients at day 5 post‐transplantation. Data are representative of three independent experiments. Results represent mean ± SEM (n = 3 mice per group of three independent experiments; Kruskal‐Walis with Dunn's multiple comparison test; *P ≤ .5). (D) Representative and quantitative flow cytometry results of myeloid subsets from the allografts of anti‐CD40L mAb treated Fucci recipients at day 5 post‐transplantation. Further evaluation of cell cycle fluorescent probes indicated that the majority of Ly6Clo macrophages from anti‐CD40L mAb‐treated Fucci recipients are in G1/S/G2/M phase. Results represent mean ± SEM (n = 3 mice per group of three independent experiments). (E) Suppressive function of Ly6Clo macrophages that are either proliferating (G1S/G2/M) or non‐proliferating (G0). Representative and quantitative flow cytometry results of CSFE + CD8+ T proliferation after 72 hours of culture. Results represent mean ± SEM (n = 3 mice per group of three independent experiments; Kruskal‐Walis with Dunn's multiple comparison test; *P ≤ .5)
Figure 3
Figure 3
Preventing macrophage cell cycle progression abrogates tolerance. (A) Top panel; representative and quantitative flow cytometry results of in vitro cultured bone marrow Ly6Chi monocytes with either CSF1 (10 ng/ml) or CSF1 plus simvastatin loaded HDL nanoparticles (S‐HDL) at 10 μM for 72 hours. Middle panel; suppressive function of bone marrow derived Ly6Chi monocytes after treatment with wither CSF1 or CSF1 + S‐HDL. Representative and quantitative flow cytometry results of CSFE + CD8+ T proliferation after 72 hours of culture. Bottom panel; representative and quantitative flow cytometry results of bone marrow derived Ly6Chi monocytes after treatment with wither CSF1 (10 ng/ml) or CSF1 + S‐HDL at 10 μM indicating cell cycle progression after 72 h of culture. Results represent mean ± SEM (n = 3 independent experiments; unpaired Mann‐Whitney test; *P ≤ .5). (B) Representative and quantitative flow cytometry results of myeloid subsets from the allografts of anti‐CD40L mAb treated Fucci recipients at day 5 post‐transplantation treated with S‐HDL (60 mg/kg). Further evaluation of cell cycle fluorescent probes indicated that the majority of Ly6Clo macrophages from anti‐CD40L mAb + S‐HDL treated Fucci recipients are arrested in G1. Results represent mean ± SEM (n = 3 mice per group of three independent experiments; Kruskal‐Walis with Dunn's multiple comparison test; *P ≤ .5). (C) Graft survival of tolerized recipients treated with or without S‐HDL (60 mg/kg) on days 0, 2, and 5 post‐transplantation. Tolerized S‐HDL recipient mice rejected their allografts despite anti‐CD40L mAb treatment. Graft survival was assessed with Kaplan‐Meier analysis (MST 20 ± 9 days; ** P ≤ .01; n = 5 mice per group). (D) Working hypothesis showing that neutrophil derived CSF1 controls polarization, proliferation, and suppressive function of tolerogenic macrophages that mediate transplantation tolerance

References

    1. Poulter LW, Bradley NJ, Turk JL. The role of macrophages in skin allograft rejection. I. Histochemical studies during first‐set rejection. Transplantation. 1971;12(1):40‐44. - PubMed
    1. Bergler T, Jung B, Bourier F, et al. Infiltration of macrophages correlates with severity of allograft rejection and outcome in human kidney transplantation. PLoS ONE. 2016;11(6):e0156900. - PMC - PubMed
    1. Wyburn KR, Jose MD, Wu H, Atkins RC, Chadban SJ. The role of macrophages in allograft rejection. Transplantation. 2005;80(12):1641‐1647. - PubMed
    1. Swirski FK, Wildgruber M, Ueno T, et al. Myeloperoxidase‐rich Ly‐6C+ myeloid cells infiltrate allografts and contribute to an imaging signature of organ rejection in mice. J Clin Invest. 2010;120(7):2627‐2634. - PMC - PubMed
    1. Conde P, Rodriguez M, van der Touw W, et al. DC‐SIGN(+) macrophages control the induction of transplantation tolerance. Immunity. 2015;42(6):1143‐1158. - PMC - PubMed

Publication types

Substances