Review
. 2018 Apr 17;19(8):895-906.
doi: 10.1002/cphc.201701253. Epub 2018 Feb 16.

Investigating Protein-Ligand Interactions by Solution Nuclear Magnetic Resonance Spectroscopy

Affiliations
Review

Investigating Protein-Ligand Interactions by Solution Nuclear Magnetic Resonance Spectroscopy

Walter Becker et al. Chemphyschem. .

Abstract

Protein-ligand interactions are of fundamental importance in almost all processes in living organisms. The ligands comprise small molecules, drugs or biological macromolecules and their interaction strength varies over several orders of magnitude. Solution NMR spectroscopy offers a large repertoire of techniques to study such complexes. Here, we give an overview of the different NMR approaches available. The information they provide ranges from the simple information about the presence of binding or epitope mapping to the complete 3 D structure of the complex. NMR spectroscopy is particularly useful for the study of weak interactions and for the screening of binding ligands with atomic resolution.

Keywords: chemical shift mapping; nuclear Overhauser effect; nuclear magnetic resonance; protein-ligand interactions; saturation-transfer difference.


Figures

Figure 1
Figure 1
Changes of protein peaks upon titration with a ligand are shown schematically for fast and slow exchange. For binding in fast exchange, the signal of the free‐protein peak at ω F is moving towards the fully ligand‐saturated protein peak ω B. In slow exchange, only the relative signal intensities of free and bound protein peaks change. Adapted from Ref. 2 with permission.
Figure 2
Figure 2
Overlap of six 1H–15N HSQC spectra of hen egg white lysozyme, titrated with increasing amounts of histamine. The ratios of lysozyme to histamine and the color code of each spectrum are indicated in the top left corner.
Figure 3
Figure 3
Chemical shift mapping of AD1 binding to TAZ2. Curved lines are indicative of two separate binding events with different K d values. Reproduced from Ref. 11 with permission.
Figure 4
Figure 4
Schematic representation of the FABS method. “S” represents a substrate and “P” a product peak in the 19F NMR spectrum. In a sample containing the free enzyme, the fluorine‐containing substrate and product peaks are visible, whereas the presence of an inhibitor suppresses the product peak.
Figure 5
Figure 5
Structure of horse cytochrome c with the residues protected from hydrogen/deuterium exchange in the presence of a monoclonal antibody drawn as line models.
Figure 6
Figure 6
A schematic representation of the STD experiment. Signals of the protein are selectively saturated by RF irradiation. This saturation (indicated in red) is then transferred to the whole protein by spin‐diffusion and further on to the bound ligand, which is in fast exchange with free ligand, where the saturated signals are finally detected.
Figure 7
Figure 7
Schematic representation of cross saturation.
Figure 8
Figure 8
The 1H‐13C HSQC of insulin before (left) and after (right) irradiation of the insulin receptor. TyrA14 revealed a significant intensity reduction and is therefore directly associated in the binding. B: Structure of insulin (PDB entry 1HUI), indicating the methyl groups and the aromatic residues which show the highest TCS effect. Adapted from Ref. 50 with permission.
Figure 9
Figure 9
Schematic representation of the transferred NOE experiment. Large negative NOEs build up for a ligand bound to a large protein. When the ligand is in fast exchange between free and bound form, the NOEs are transferred to the free ligand, where they can be observed with high resolution.
Figure 10
Figure 10
Conformations of GAC1 at the N‐glycosidic linkage (a) conformation A found by transferred NOEs (b) “inverted” conformation B, which is found in aqueous solution at the same buffer conditions. In c) the trNOESY spectrum is shown revealing the interglycosidic trNOEs which confirm conformation A in the complex. Reproduced from Ref. 54 with permission.
Figure 11
Figure 11
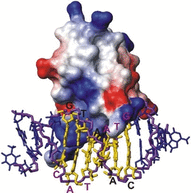
Solution structure of the bacterial antitoxin CcdA bound to its cognate DNA. 13C‐edited, 13C, 15N‐filtered NOESY spectra were used to distinguish intra‐ from intermolecular NOEs.
Figure 12
Figure 12
Analysis of ligand binding to stromelysin by using diffusion–editing. A diffusion‐edited spectrum of a mixture of nine compounds in the absence of stromelysin is shown in (A) and in the presence of stromelysin in (B). A difference spectrum, revealing signals of any binding ligand is seen in (C). (D) Reference spectrum of 4‐cyano‐4′ hydroxybiphenyl alone. Signals from impurities in the buffer are indicated by asterisks. Adapted from Ref. 59 with permission.

References

    1. Frederick K. K., Marlow M. S., Valentine K. G., Wand A. J., Nature 2007, 448, 325–329. - PMC - PubMed
    1. Gossert A. D., Jahnke W., Prog. Nucl. Magn. Reson. Spectrosc. 2016, 97, 82–125. - PubMed
    1. None
    1. Holzgrabe U., Prog Nucl Magn Reson Spectrosc 2010, 57, 229–240; - PubMed
    1. Lionta E., Spyrou G., Vassilatis D., Cournia Z., CTMC 2014, 14, 1923–1938. - PMC - PubMed

Publication types

LinkOut - more resources