. 2018 Mar;24(3):193-201.
doi: 10.1111/cns.12793. Epub 2018 Jan 3.

Transcriptome profiling of peripheral blood immune cell populations in multiple sclerosis patients before and during treatment with a sphingosine-1-phosphate receptor modulator

Affiliations

Transcriptome profiling of peripheral blood immune cell populations in multiple sclerosis patients before and during treatment with a sphingosine-1-phosphate receptor modulator

Ines C Angerer et al. CNS Neurosci Ther. 2018 Mar.

Abstract

Aims: Fingolimod is a sphingosine-1-phosphate (S1P) receptor modulator approved for the treatment of the relapsing form of multiple sclerosis (MS). It prevents the egress of lymphocyte subpopulations from lymphoid tissues into the circulation. Here, we explored the broad effects of fingolimod on gene expression in different immune cell subsets.

Methods: Utilizing 150 high-resolution microarrays from Affymetrix, we obtained the transcriptome profiles of 5 cell populations, which were separated from the peripheral blood of MS patients prior to and following oral administration of fingolimod.

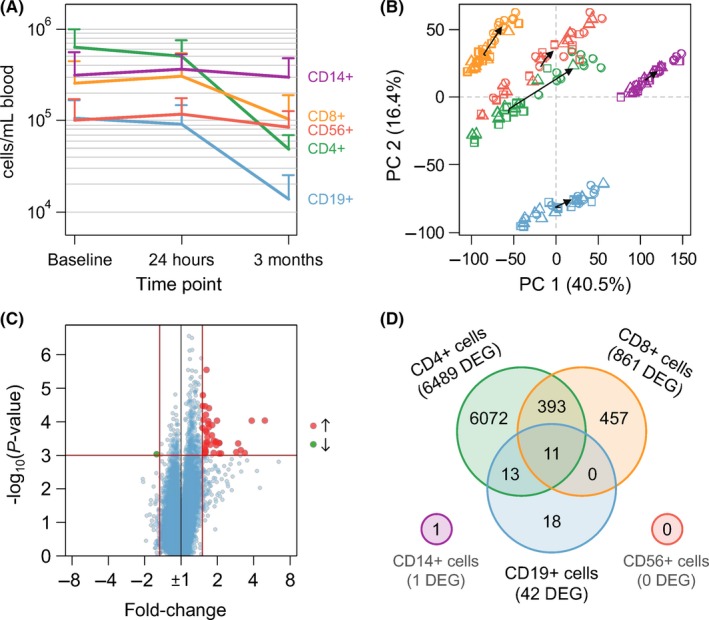
Results: After 3 months of treatment, significant transcriptome shifts were seen in CD4+ and CD8+ cells, which is mainly attributable to the selective homing of naive T cells and central memory T cells. Although the number of B cells was greatly reduced in the blood of fingolimod-treated MS patients, the analysis of differential expression in CD19+ cells identified only a small set of 42 genes, which indicated a slightly higher frequency of transitional B cells. The transcriptome signatures of CD14+ monocytes and CD56+ natural killer cells were not affected.

Conclusion: Our study corroborates changes in the composition of circulating immune cells in response to fingolimod and delineates the respective implications at the RNA level. Our data may be valuable for comparing the effects of novel S1P receptor modulating agents, which may be a therapeutic option for patients with secondary progressive MS as well.

Keywords: CD19+ B cells; fingolimod therapy; peripheral blood; relapsing-remitting multiple sclerosis; transcriptome microarray analysis.


Figures

Figure 1
Figure 1
Analysis of cellular and molecular effects of fingolimod therapy in the blood of RRMS patients. Microarray‐based transcriptome profiling was performed for monocytes and lymphocyte subpopulations, which are represented in the figure by different colors (CD4+ cells in green, CD8+ cells in orange, CD14+ cells in purple, CD19+ cells in blue, and CD56+ cells in red). A, Concentration of cells (mean plus standard deviation) for each of the 5 separated cell populations and each of the 3 study time points. After 3 mo of fingolimod therapy, the numbers of sorted CD4+ cells, CD8+ cells as well as CD19+ cells were significantly reduced (Student's t test P‐values <0.05). B, Principal component (PC) analysis of the complete dataset comprising 150 microarrays (10 patients × 3 time points × 5 cell populations). The samples were plotted in the first two dimensions explaining most of the variation in the normalized and mean‐centered gene‐level probe set signal intensities (n = 70 523 per array). Dark arrows connect the centers of each time point (depicted by rectangles for baseline, triangles for “24 h,” and circles for “3 mo”). C, Volcano plot of gene expression changes in CD19+ cells within 3 mo after initiation of fingolimod therapy. Red and green dots display probe sets for gene transcripts expressed at significantly higher or lower levels, respectively (n = 42). The red vertical and horizontal lines indicate the fold change and P‐value filtering criteria. D, Venn diagram summarizing for each cell population the sets and their intersections of differentially expressed genes (DEG) after 3 mo of fingolimod therapy relative to pretreatment levels. Eleven DEG were shared among CD4+ cells, CD8+ cells, and CD19+ cells
Figure 2
Figure 2
Gene expression dynamics of IQGAP2, MYBL1, and PTPN12 in the course of fingolimod therapy. Matrix of boxplots visualizing the mRNA expression of 3 selected genes (in columns) in 3 distinct immune cell populations (in rows). The cells were separated from the peripheral blood of relapsing‐remitting MS patients based on cell surface markers such as CD4 and CD8 for T cells and CD19 for B cells. Pretreatment expression values as well as levels after 24 h and 3 mo of fingolimod therapy are presented in log2 scale. Differently colored lines refer to each of the 10 individual patients per cell population. The P‐values above the brackets were calculated by Student's t test. In all 3 cell populations shown, IQGAP2, MYBL1, and PTPN12 were consistently expressed at significantly higher transcript levels in response to continued administration of fingolimod in comparison with baseline (P‐values <0.001 and fold changes >1.5)

References

    1. Dendrou CA, Fugger L, Friese MA. Immunopathology of multiple sclerosis. Nat Rev Immunol. 2015;15:545‐558. - PubMed
    1. Kuhlmann T, Ludwin S, Prat A, Antel J, Brück W, Lassmann H. An updated histological classification system for multiple sclerosis lesions. Acta Neuropathol. 2017;133:13‐24. - PubMed
    1. Denic A, Wootla B, Rodriguez M. CD8(+) T cells in multiple sclerosis. Expert Opin Ther Targets. 2013;17:1053‐1066. - PMC - PubMed
    1. Crotty S. A brief history of T cell help to B cells. Nat Rev Immunol. 2015;15:185‐189. - PMC - PubMed
    1. von Büdingen HC, Palanichamy A, Lehmann‐Horn K, Michel BA, Zamvil SS. Update on the autoimmune pathology of multiple sclerosis: B‐cells as disease‐drivers and therapeutic targets. Eur Neurol. 2015;73:238‐246. - PMC - PubMed

Publication types

MeSH terms

Substances