. 2018 Jun;66(6):850-856.
doi: 10.1097/MPG.0000000000001887.

Factors Influencing Time-to-diagnosis of Biliary Atresia

Affiliations

Factors Influencing Time-to-diagnosis of Biliary Atresia

Sanjiv Harpavat et al. J Pediatr Gastroenterol Nutr. 2018 Jun.

Abstract

Objectives: Diagnosing biliary atresia (BA) quickly is critical, because earlier treatment correlates with delayed or reduced need for liver transplantation. However, diagnosing BA quickly is also difficult, with infants usually treated after 60 days of life. In this study, we aim to accelerate BA diagnosis and treatment, by better understanding factors influencing the diagnostic timeline.

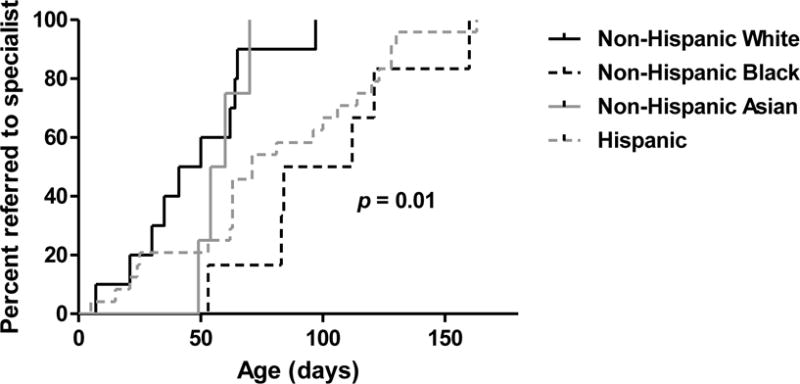
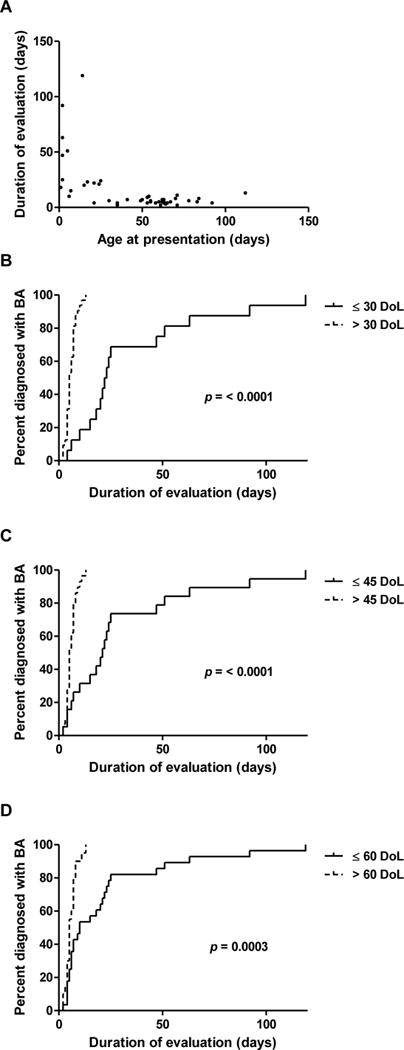
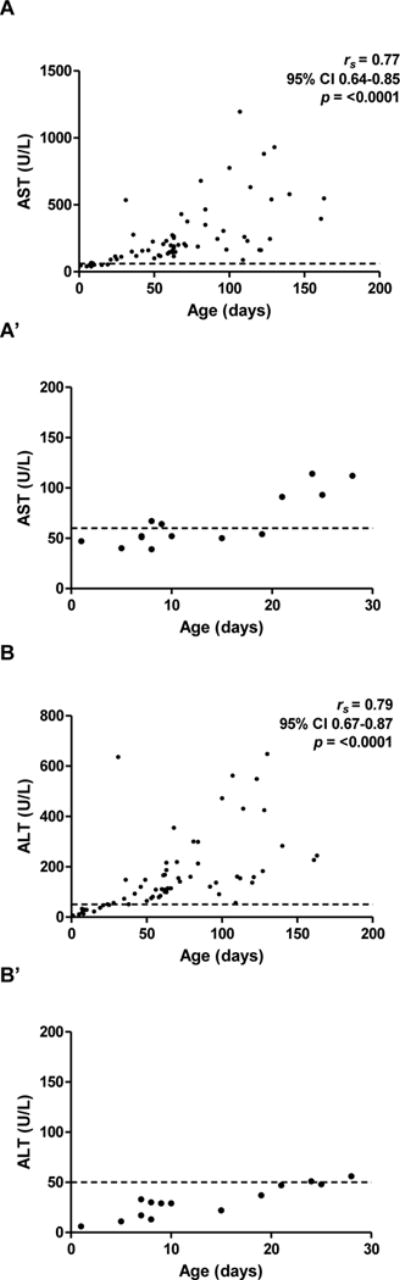
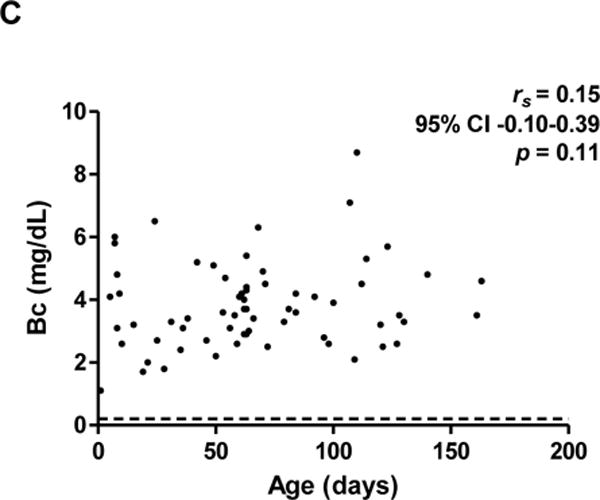
Methods: Infants born between 2007 and 2014 and diagnosed with BA at our institution were included (n = 65). Two periods were examined retrospectively: P1, the time from birth to specialist referral, and P2, the time from specialist referral to treatment. How sociodemographic factors associate with P1 and P2 were analyzed with Kaplan-Meier curves and Cox proportional hazard models. In addition, to better characterize P2, laboratory results and early tissue histology were studied.

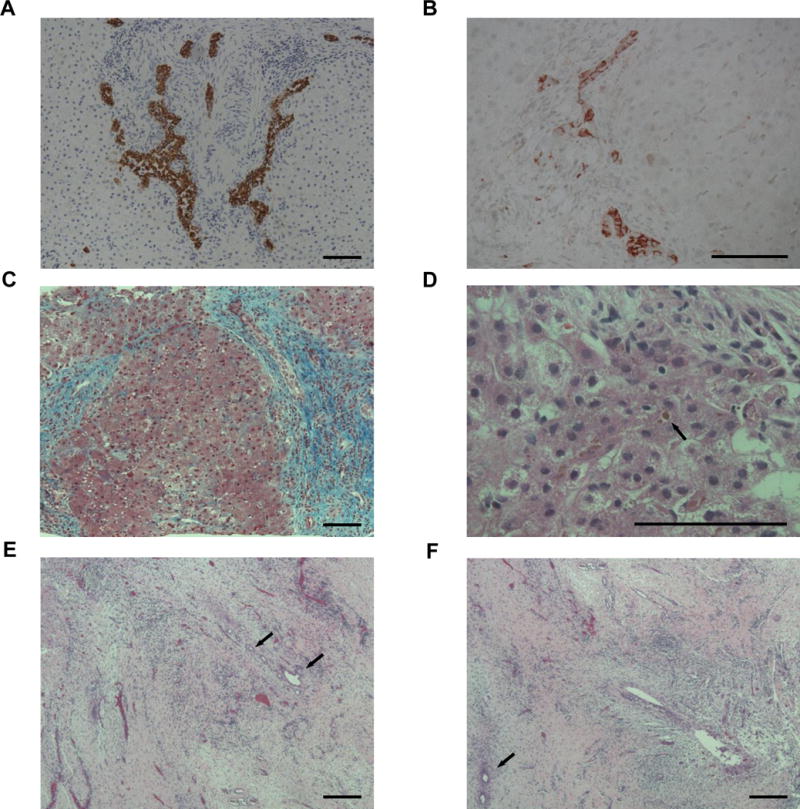
Results: P1 associated with race/ethnicity, with shorter times in non-Hispanic white infants compared to non-Hispanic black and Hispanic infants (P = 0.007 and P = 0.004, respectively). P2 associated with referral age, with shorter times in infants referred after 30, 45, or 60 days of life (P < 0.001, P < 0.001, and P = 0.001, respectively). One potential reason for longer P2 in infants referred ≤30 days is that aminotransferase levels were normal or near-normal. However, despite reassuring laboratory values, tissue histology in early cases showed key features of BA.

Conclusions: Our findings suggest 2 opportunities to accelerate BA diagnosis and treatment. First, to achieve prompt referrals for all races/ethnicities, universal screening strategies should be considered. Second, to ensure efficient evaluations independent of age, algorithms designed to detect early features of BA can be developed.


Conflict of interest statement

Conflicts of Interest: The authors have no conflicts of interest or financial relationships relevant to this article to disclose.

Figures

Figure 1
Figure 1. Later referrals for non-Hispanic black and Hispanic subjects
Kaplan-Meier curves for time to referral based on race/ethnicity. Differences among groups were calculated using the log-rank test.
Figure 2
Figure 2. Evaluation times vary inversely with age at referral
(A) Scatter plot of P2 times and age at presentation demonstrating an inverse relationship. (B-D) Kaplan-Meier curves for time to KP after specialist referral, based on age at presentation. Differences between groups were calculated using the log-rank test.
Figure 3
Figure 3. Normal/near-normal transaminases, but elevated Bc, in first 30 DoL
Initial AST (A) and ALT (B) levels, with insets (A′) and (B′) highlighting first 30 DoL. (C) Initial Bc levels. Dashed lines denote upper limits of normal (reference intervals: AST 20-60 U/L; ALT 6-50 U/L; Bc 0-0.2 mg/dL).
Figure 4
Figure 4. Abnormal early histology in liver and biliary remnants
(A-D) Liver. (A) Duct proliferation (brown) at DoL 15 (case 1, 100X, anti-CK7). (B) Reactive ducts/ductules (red) at DoL 30 (case 6, 200X, anti-CD56). (C) Bridging fibrosis (blue) at DoL 21 (case 4, 100X, trichrome). (D) Canalicular bile plugging (arrow) at DoL 24 (case 5, 400X, H&E). (E-F) Biliary remnants. Areas of left (E) and right (F) hepatic duct tissue devoid of large, epithelial-lined ducts at DoL 16. Some small duct branches with epithelial cells loss, distorted lumens, and circumferential fibrosis are seen (arrows) (case 2, 100X, H&E). Bar=100 uM.

References

    1. Sokol RJ, Shepherd RW, Superina R, Bezerra JA, Robuck P, Hoofnagle JH. Screening and outcomes in biliary atresia: summary of a National Institutes of Health workshop. Hepatology. 2007;46(2):566–581. doi: 10.1002/hep.21790. - DOI - PMC - PubMed
    1. Jimenez-Rivera C, Jolin-Dahel KS, Fortinsky KJ, Gozdyra P, Benchimol EI. International incidence and outcomes of biliary atresia. J Pediatr Gastroenterol Nutr. 2013;56(4):344–354. doi: 10.1097/MPG.0b013e318282a913. - DOI - PubMed
    1. Schreiber RA, Barker CC, Roberts EA, et al. Biliary atresia: the Canadian experience. J Pediatr. 2007;151(6):659–65, 665.e1. doi: 10.1016/j.jpeds.2007.05.051. - DOI - PubMed
    1. Serinet M-O, Wildhaber BE, Broué P, et al. Impact of age at Kasai operation on its results in late childhood and adolescence: a rational basis for biliary atresia screening. Pediatrics. 2009;123(5):1280–1286. doi: 10.1542/peds.2008-1949. - DOI - PubMed
    1. Wildhaber BE, Majno P, Mayr J, et al. Biliary atresia: Swiss national study, 1994-2004. J Pediatr Gastroenterol Nutr. 2008;46(3):299–307. doi: 10.1097/MPG.0b013e3181633562. - DOI - PubMed

Publication types