

Spatial and Seasonal Dynamics of Water Environmental Capacity in Mountainous Rivers of the Southeastern Coast, China
- PMID: 29315265
- PMCID: PMC5800198
- DOI: 10.3390/ijerph15010099
Spatial and Seasonal Dynamics of Water Environmental Capacity in Mountainous Rivers of the Southeastern Coast, China
Abstract
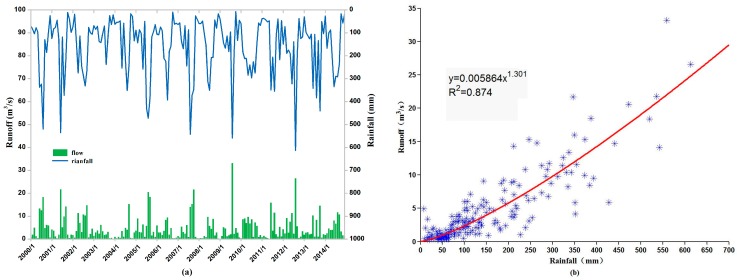
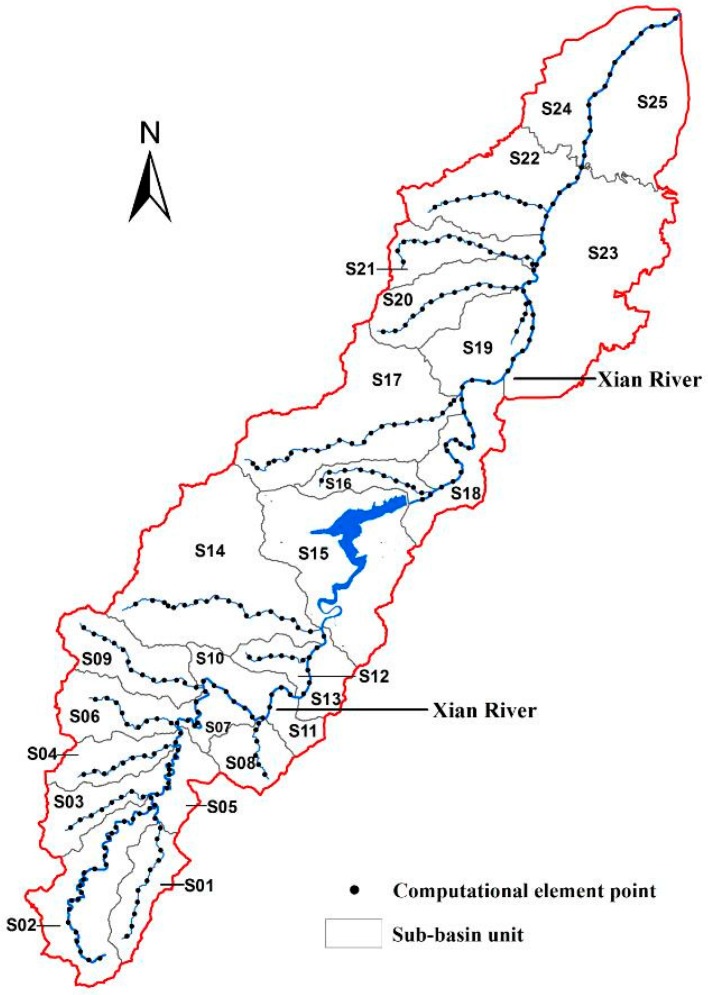
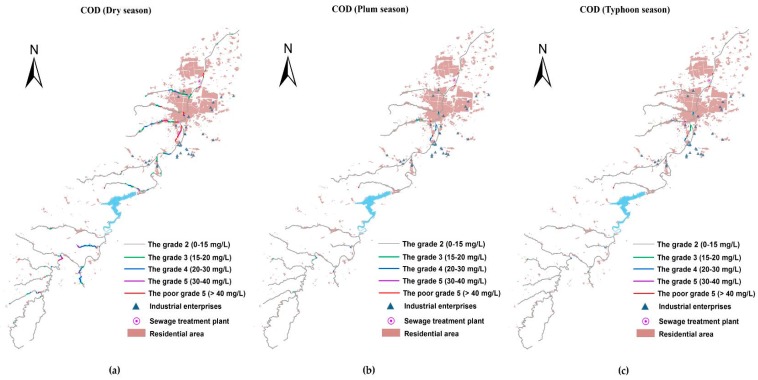
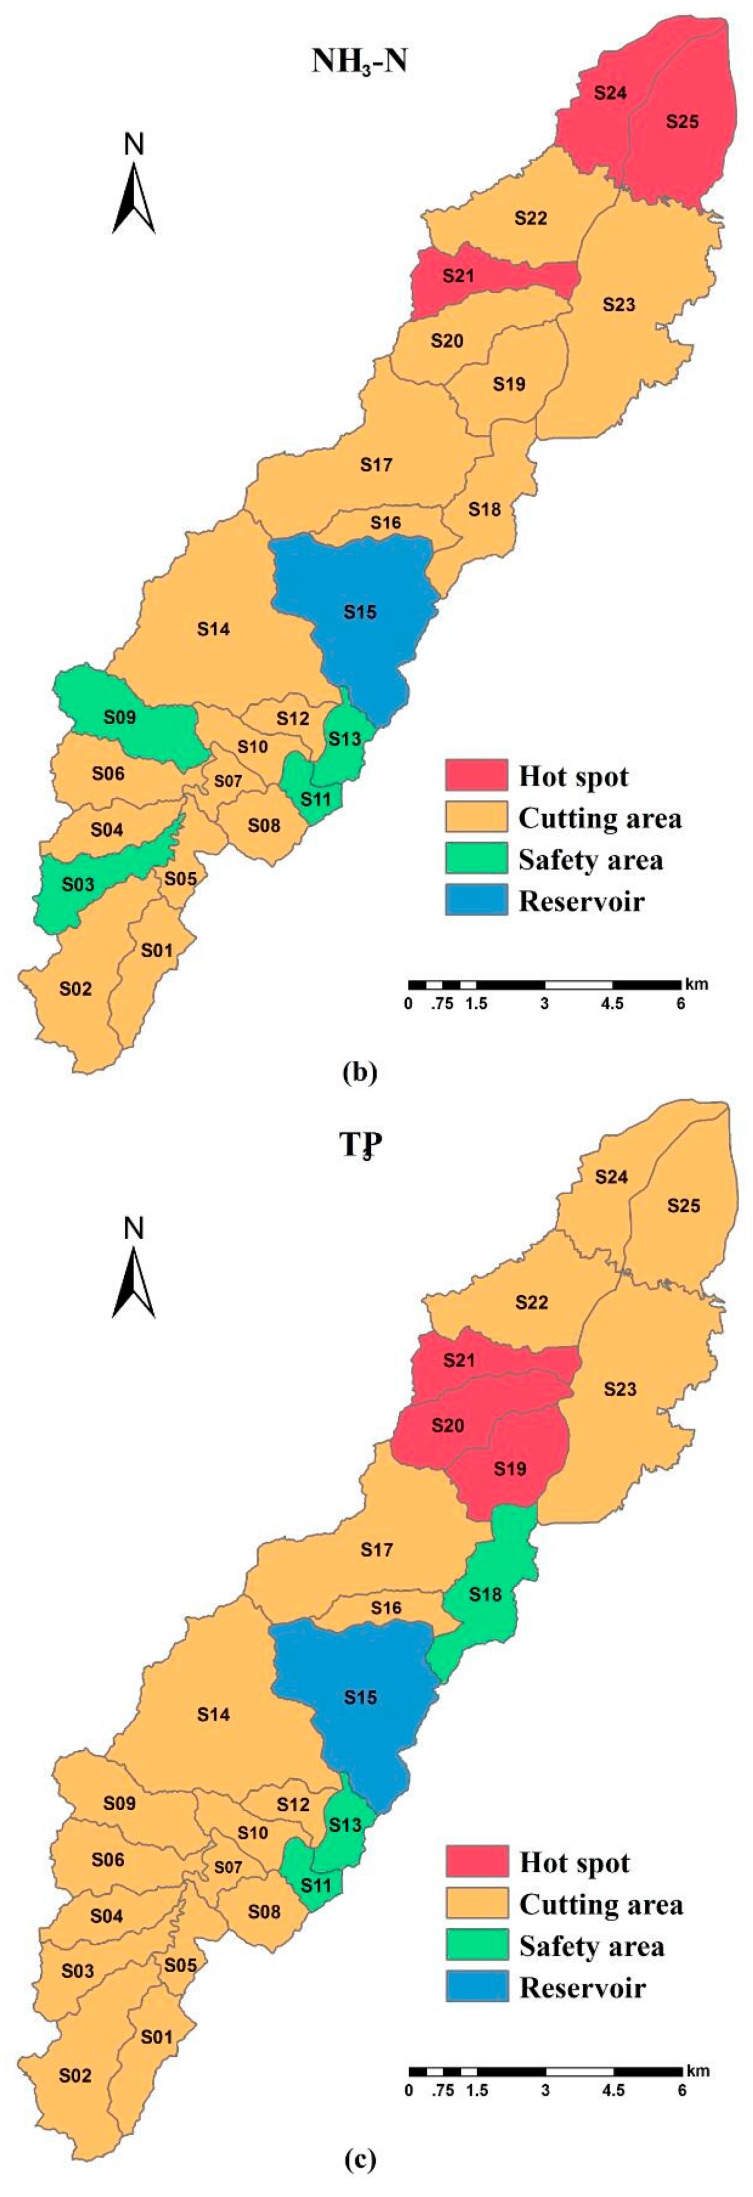
The south-east littoral is one of the most populous and developed regions in China suffering from serious water pollution problems, and the Xian-Jiang Basin in the mid of this region is among the most polluted watersheds. Critical information is needed but lacking for improved pollution control and water quality assessment, among which water environmental capacity (WEC) is the most important variable but is difficult to calculate. In this study, a one-dimensional water quality model combined with a matrix calculation algorithm was first developed and calibrated with in-situ observations in the Xian-Jiang basin. Then, the model was applied to analyze the spatial and temporal patterns of WEC of the entire basin. The results indicated that, in 2015, the total pollutant discharges into the river reached 6719.68 t/yr, 488.12 t/yr, and 128.57 t/yr for COD, NH₃-N and TP, respectively. The spatial pattern suggested a strong correlation between these water contaminants and industrial enterprises, residential areas, and land-use types in the basin. Furthermore, it was noticed that there was a significant seasonal pattern in WEC that the dry season pollution is much greater than that in the plum season, while that in the typhoon season appears to be the weakest among all seasons. The WEC differed significantly among the 24 sub-basins during the dry season but varied to a smaller extent in other seasons, suggesting differential complex spatial-temporal dependency of the WEC.
Keywords: WEC spatial and seasonal patterns; one-dimensional WEC model; pollution load distribution; water environmental capacity; water quality.
Conflict of interest statement
The authors declare no conflict of interest.
Figures


Similar articles
-
[Uncertainty analysis of water environmental capacity in the nonpoint source polluted river].Huan Jing Ke Xue. 2010 May;31(5):1215-9. Huan Jing Ke Xue. 2010. PMID: 20623854 Chinese.
-
Combined multivariate statistical techniques, Water Pollution Index (WPI) and Daniel Trend Test methods to evaluate temporal and spatial variations and trends of water quality at Shanchong River in the Northwest Basin of Lake Fuxian, China.PLoS One. 2015 Apr 2;10(3):e0118590. doi: 10.1371/journal.pone.0118590. eCollection 2015. PLoS One. 2015. PMID: 25837673 Free PMC article.
-
Temporal and spatial characteristics of the water pollutant concentration in Huaihe River Basin from 2003 to 2012, China.Environ Monit Assess. 2016 Sep;188(9):522. doi: 10.1007/s10661-016-5503-0. Epub 2016 Aug 16. Environ Monit Assess. 2016. PMID: 27531013
-
Water Quality Planning in Rivers: Assimilative Capacity and Dilution Flow.Bull Environ Contam Toxicol. 2017 Nov;99(5):531-541. doi: 10.1007/s00128-017-2182-7. Epub 2017 Sep 26. Bull Environ Contam Toxicol. 2017. PMID: 28951956 Review.
-
The impacts of spatio-temporal variation of natural and agricultural influences on the environmental water quality in a fluvial-lacustrine watershed in China.Environ Sci Pollut Res Int. 2023 Jul;30(31):76387-76404. doi: 10.1007/s11356-023-27978-z. Epub 2023 Jun 2. Environ Sci Pollut Res Int. 2023. PMID: 37266778 Review.
Cited by
-
New Framework for Dynamic Water Environmental Capacity Estimation Integrating the Hydro-Environmental Model and Load-Duration Curve Method-A Case Study in Data-Scarce Luanhe River Basin.Int J Environ Res Public Health. 2022 Jul 9;19(14):8389. doi: 10.3390/ijerph19148389. Int J Environ Res Public Health. 2022. PMID: 35886241 Free PMC article.
-
Spatio-temporal scale identification of LUCC based on remote sensing images in Shenyang Economic Zone.Sci Rep. 2025 Jul 1;15(1):21249. doi: 10.1038/s41598-025-94770-z. Sci Rep. 2025. PMID: 40595020 Free PMC article.
-
Predicting non-point source of pollution in Maithon reservoir using a semi-distributed hydrological model.Environ Monit Assess. 2019 Jul 29;191(8):522. doi: 10.1007/s10661-019-7674-y. Environ Monit Assess. 2019. PMID: 31359154
References
-
- Miao M. Model and Enlightenment of economic development in coastal areas of China and Abroad. Econ. Rev. 2009;8:111–113. doi: 10.16528/j.cnki.22-1054/f.2009.08.019. (In Chinese) - DOI
-
- State Environmental Protection Administration of the China (SEPA) Environmental Quality Standards for Surface Water (GB3838-2002) China Environmental Science Press; Beijing, China: 2002. (In Chinese)
-
- Zhang R.B., Qian X., Zhu W.T., Gao H.L., Hu W., Wang J.H. Simulation and Evaluation of Pollution Load Reduction Scenarios for Water Environmental Management: A Case Study of Inflow River of Taihu Lake, China. Int. J. Environ. Res. Public Health. 2014;11:9306–9324. doi: 10.3390/ijerph110909306. - DOI - PMC - PubMed
Publication types
MeSH terms
Substances
LinkOut - more resources
Full Text Sources
Other Literature Sources
Medical
