. 2018 Feb;59(2):333-344.
doi: 10.1111/epi.13990. Epub 2018 Jan 5.

Neonatal phenobarbital exposure disrupts GABAergic synaptic maturation in rat CA1 neurons

Affiliations

Neonatal phenobarbital exposure disrupts GABAergic synaptic maturation in rat CA1 neurons

Nour Al-Muhtasib et al. Epilepsia. 2018 Feb.

Abstract

Objective: Phenobarbital is the most commonly utilized drug for the treatment of neonatal seizures. The use of phenobarbital continues despite growing evidence that it exerts suboptimal seizure control and is associated with long-term alterations in brain structure, function, and behavior. Alterations following neonatal phenobarbital exposure include acute induction of neuronal apoptosis, disruption of synaptic development in the striatum, and a host of behavioral deficits. These behavioral deficits include those in learning and memory mediated by the hippocampus. However, the synaptic changes caused by acute exposure to phenobarbital that lead to lasting effects on brain function and behavior remain understudied.

Methods: Postnatal day (P)7 rat pups were treated with phenobarbital (75 mg/kg) or saline. On P13-14 or P29-37, acute slices were prepared and whole-cell patch-clamp recordings were made from CA1 pyramidal neurons.

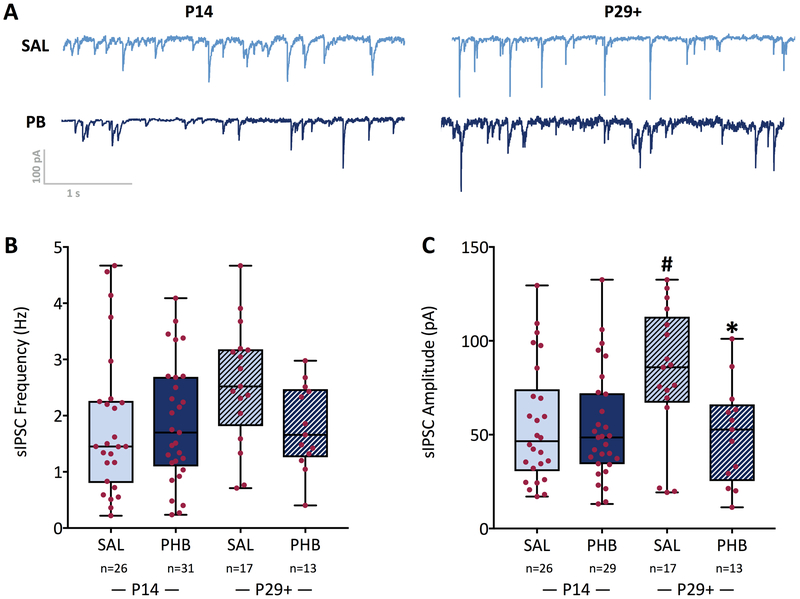
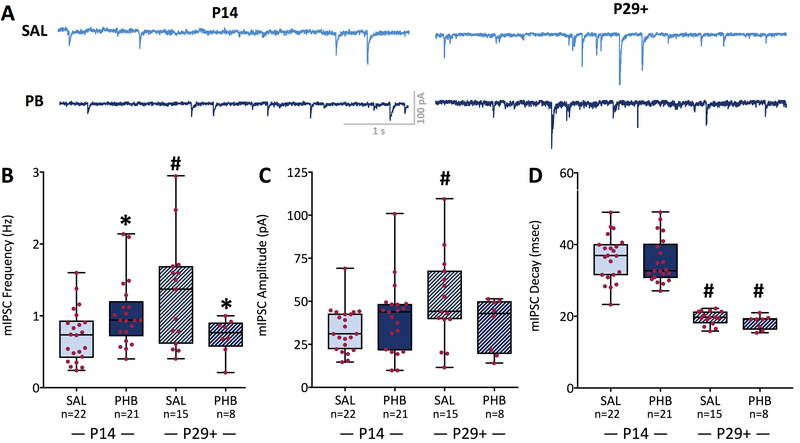
Results: At P14 we found an increase in miniature inhibitory postsynaptic current (mIPSC) frequency in the phenobarbital-exposed as compared to the saline-exposed group. In addition to this change in mIPSC frequency, the phenobarbital group displayed larger bicuculline-sensitive tonic currents, decreased capacitance and membrane time constant, and a surprising persistence of giant depolarizing potentials. At P29+, the frequency of mIPSCs in the saline-exposed group had increased significantly from the frequency at P14, typical of normal synaptic development; at this age the phenobarbital-exposed group displayed a lower mIPSC frequency than did the control group. Spontaneous inhibitory postsynaptic current (sIPSC) frequency was unaffected at either P14 or P29+.

Significance: These neurophysiological alterations following phenobarbital exposure provide a potential mechanism by which acute phenobarbital exposure can have a long-lasting impact on brain development and behavior.

Keywords: apoptosis; cell death; gestational; neonatal; patch-clamp; teratogen.


Conflict of interest statement

Disclosure. No authors report conflicts of interest. We confirm that we have read the Journal’s position on issues involved in ethical publication and affirm that this report is consistent with those guidelines.

Figures

Figure 1.
Figure 1.. Properties of CA1 neurons recorded from phenobarbital and saline-treated pups.
(A) Representative traces showing action potentials fired by CA1 neurons to depolarizing current steps in current-clamp configuration Mean number of action potentials in CA1 neurons in response to depolarizing current steps are quantified in (B), from the P14 time point. (C) Input resistance, individual cell values are overlaid on the box and whisker plots. (D) Membrane time constant * = significantly different than saline, P<0.05; # = significantly different P14 to P29+, P<0.05. (E) Membrane capacitance * = significantly different than saline at P14, P<0.05.
Figure 2.
Figure 2.. Spontaneous IPSCs are unaltered by developmental exposure to phenobarbital.
(A) Representative sIPSCs from cells from a saline and a phenobarbital treated animal at each age (B) sIPSC frequency and (C) amplitude did not differ between treatment groups at P14. From P14 to P29+, a developmental increase in sIPSC amplitude was evident in the saline exposed group, but not in the phenobarbital exposed group. This resulted in a significantly smaller sIPSC amplitude in phenobarbital, as compared to saline-exposed animals at P29+ (P<0.05). * = significantly different than saline within age group, P<0.05; # significantly difference between P14 and P29+ for a given drug treatment, P<0.05.
Figure 3.
Figure 3.. The developmental maturation of miniature IPSC frequency is disrupted following early-life exposure to phenobarbital.
(A) Representative mIPSCs in CA1 pyramidal neurons at different ages and treatements. (B) Frequency of mIPSC was increased in the phenobarbital exposed group at P14 (P<0.05). From P14 to P29+ there was a significant increase in mIPSC frequency in the saline group (P<0.05). The phenobarbital exposed group did not display the expected developmental increase in mIPSC frequency between P14 and P29+, and the mIPSC frequency in this group was thus significantly less than that in the saline group at P29+ (P<0.05). Neither mIPSC amplitude (C) nor decay (D) differed between treatment groups. However, mIPSC amplitude was significantly greater in the saline-exposed at P29+ compared to P14 (P<0.05). Moreover, mIPSC decay was significantly faster in both the saline and phenobarbital groups at P29+ as compared to P14 (Ps<0.05). * = significantly different than saline within age group, P<0.05; # significantly difference between P14 and P29+ for a given drug treatment, P<0.05.
Figure 4.
Figure 4.. Developmental exposure to phenobarbital increases tonic GABA current.
A) Representative recordings (at P14) showing the shift in holding current after the application of bicuculline methobromide (BMR) indication the present of a tonic GABA current. (B) Tonic GABA current was significantly increased as compared to saline at P14; at P29+, tonic current did not differ between treatments, and was significantly (P<0.05) reduced compared to P14. (* = significantly different than saline within age group, P<0.05; # significantly difference between P14 and P29+ for a given drug treatment, P<0.05.
Figure 5.
Figure 5.. Developmental exposure to phenobarbital results in increased occurrence of giant depolarizing potentials.
(A) Representative current clamp trace recorded from a neuron in the phenobarbital exposed group; the frequency of GDP occurrence in this cell was ~0.1 Hz. (B) Expanded view of a GDP from (E). (C) GDP frequency tabulated on an animal-by-animal basis; * = significantly different than saline, P<0.05. (D, E) GDP frequency tabulated as a function of total cells recorded from the saline (D) and phenobarbital (E) treated groups. (E) GDP amplitude did not differ between groups n.s. = not significantly different.

References

    1. Glass HC, Kan J, Bonifacio SL, et al. Neonatal seizures: treatment practices among term and preterm infants. Pediatr Neurol. 2012;46:111–5. - PMC - PubMed
    1. Painter MJ, Scher MS, Stein AD, et al. Phenobarbital compared with phenytoin for the treatment of neonatal seizures. N Engl J Med. 1999;341:485–9. - PubMed
    1. Farwell JR, Lee YJ, Hirtz DG, et al. Phenobarbital for febrile seizures--effects on intelligence and on seizure recurrence. N Engl J Med. 1990;322:364–9. - PubMed
    1. Dobbing J, Sands J. Comparative aspects of the brain growth spurt. Early Hum Dev. 1979;3:79–83. - PubMed
    1. Bittigau P, Sifringer M, Genz K, et al. Antiepileptic drugs and apoptotic neurodegeneration in the developing brain. Proc Natl Acad Sci U A. 2002;99:15089–94. - PMC - PubMed

Publication types

MeSH terms