. 2018 Jan 8;33(1):108-124.e5.
doi: 10.1016/j.ccell.2017.12.001.

Hedgehog Pathway Drives Fusion-Negative Rhabdomyosarcoma Initiated From Non-myogenic Endothelial Progenitors

Affiliations

Hedgehog Pathway Drives Fusion-Negative Rhabdomyosarcoma Initiated From Non-myogenic Endothelial Progenitors

Catherine J Drummond et al. Cancer Cell. .

Abstract

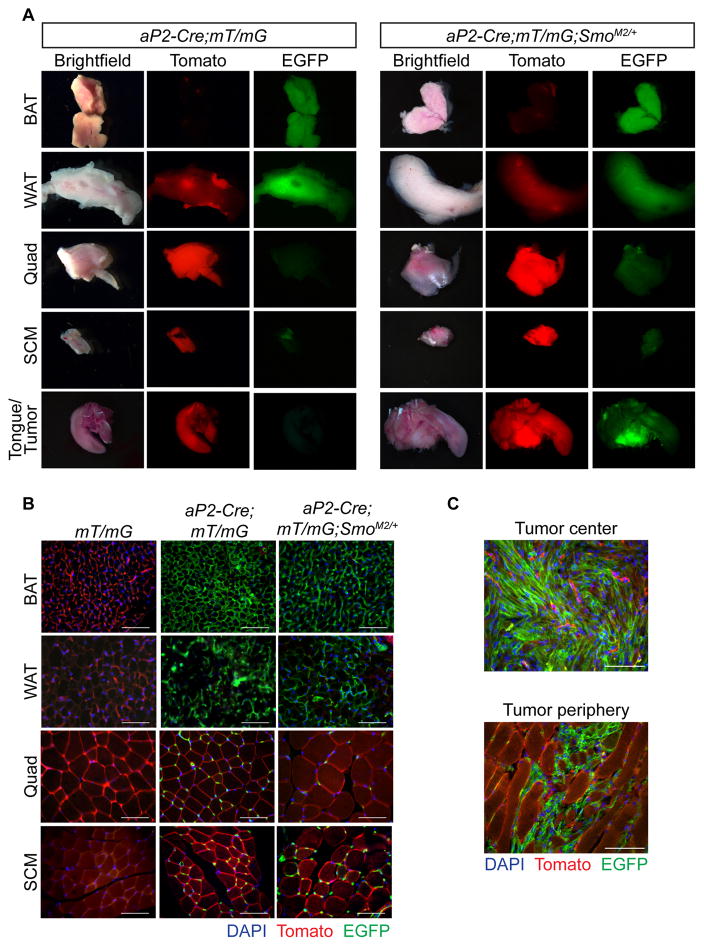
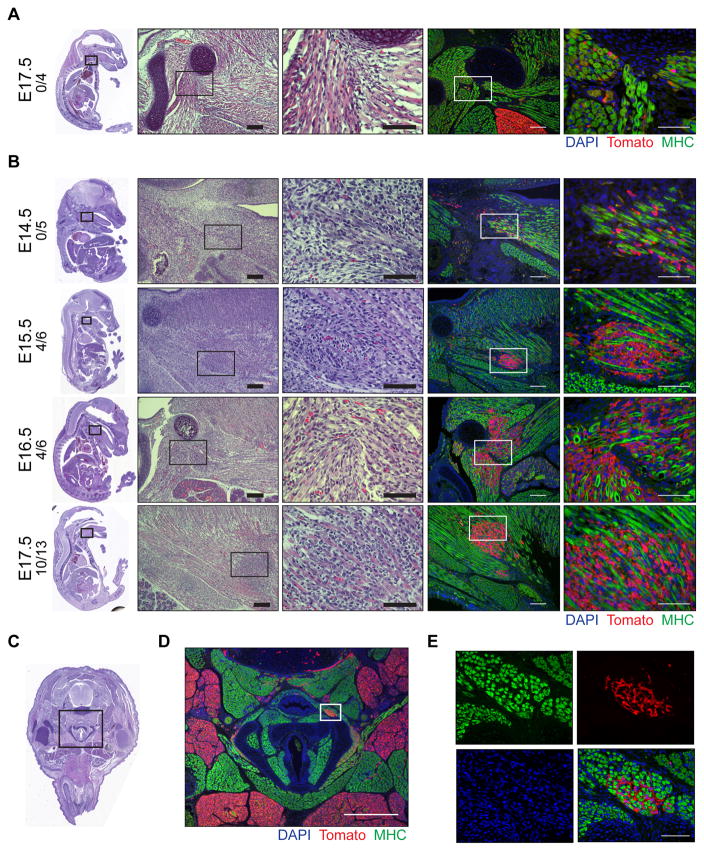
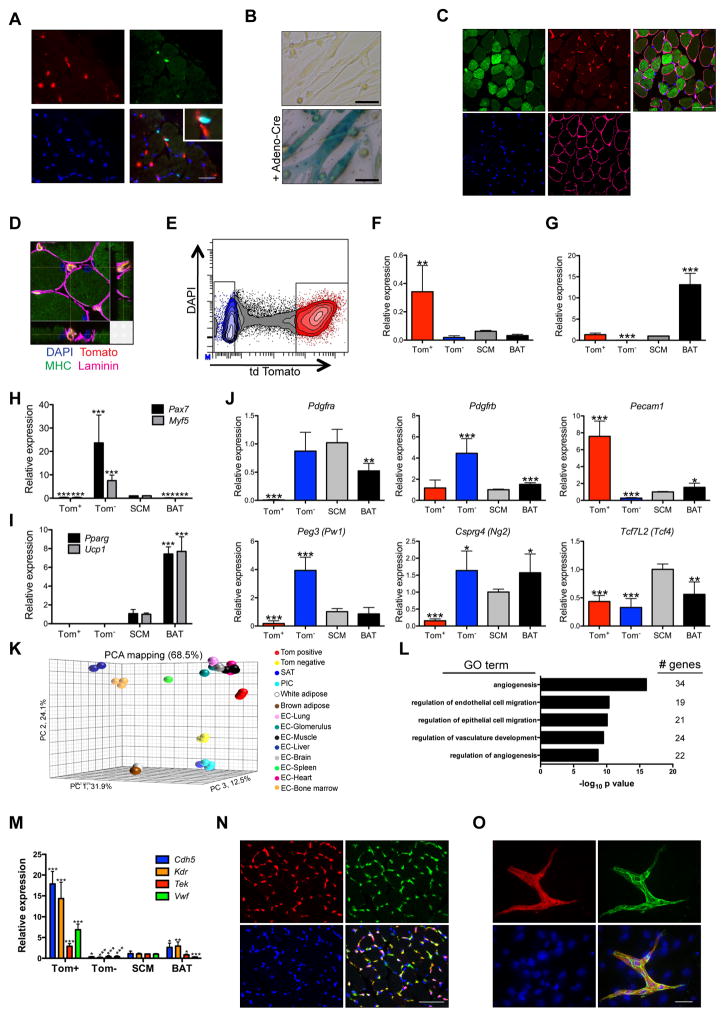
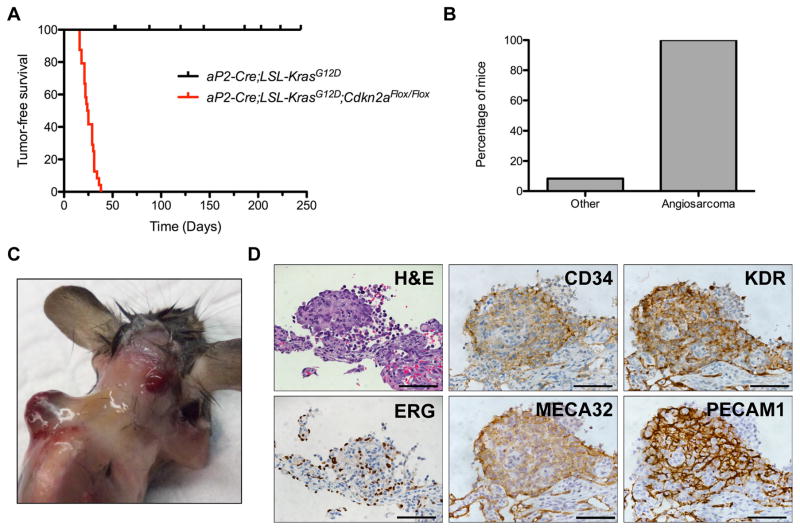
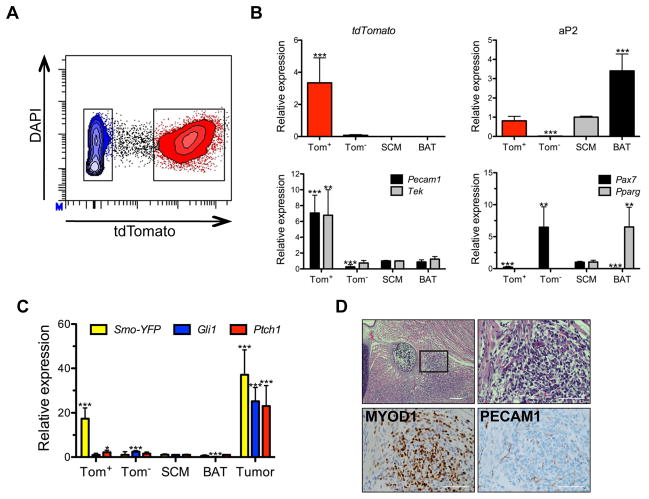
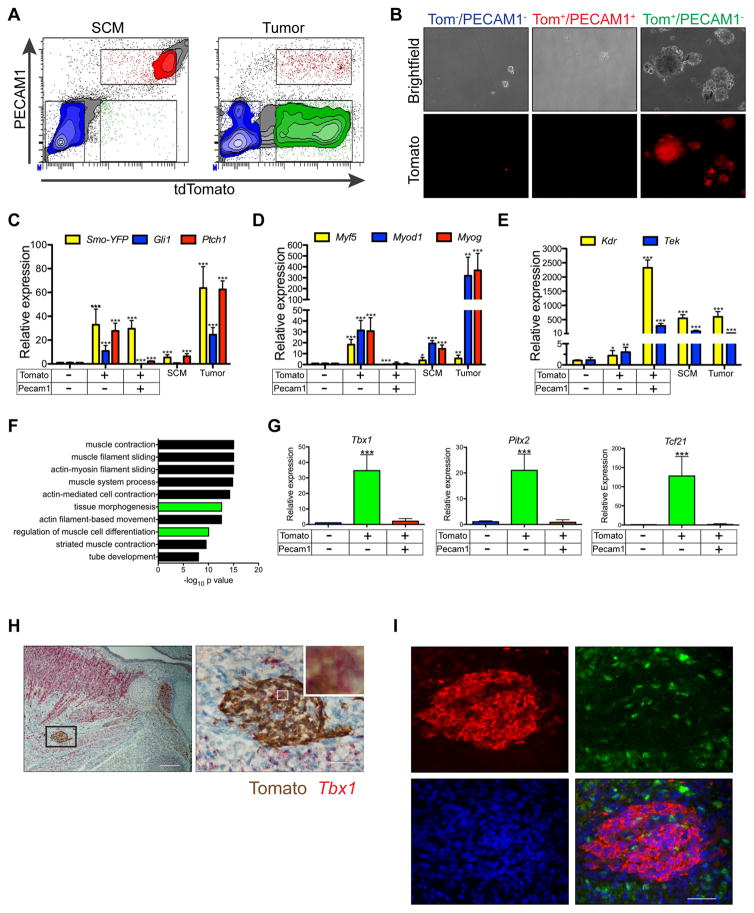
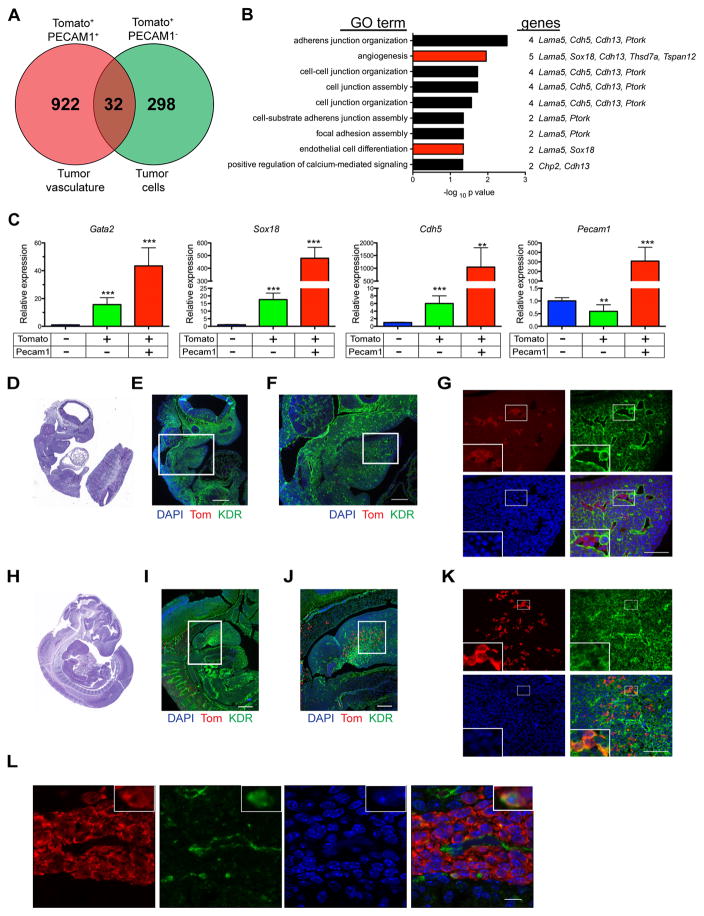
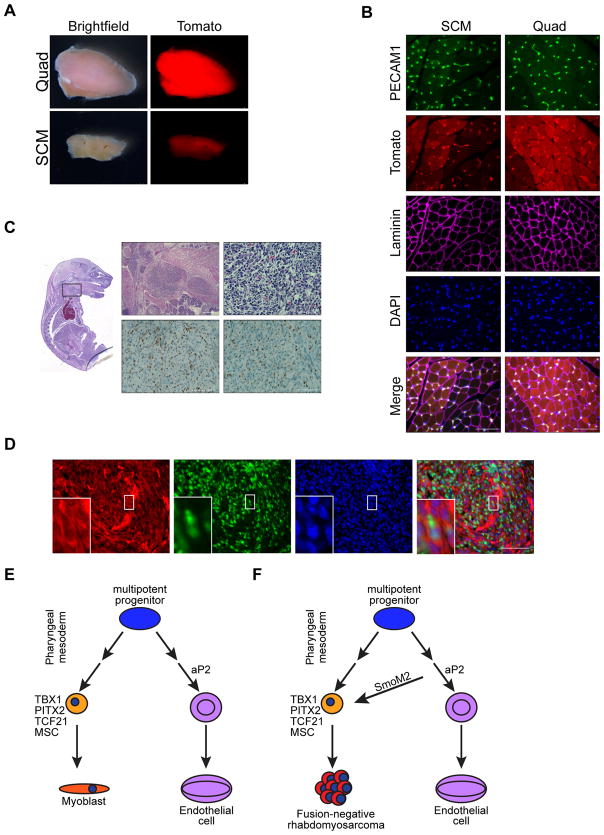
Rhabdomyosarcoma (RMS) is a pediatric soft tissue sarcoma that histologically resembles embryonic skeletal muscle. RMS occurs throughout the body and an exclusively myogenic origin does not account for RMS occurring in sites devoid of skeletal muscle. We previously described an RMS model activating a conditional constitutively active Smoothened mutant (SmoM2) with aP2-Cre. Using genetic fate mapping, we show SmoM2 expression in Cre-expressing endothelial progenitors results in myogenic transdifferentiation and RMS. We show that endothelium and skeletal muscle within the head and neck arise from Kdr-expressing progenitors, and that hedgehog pathway activation results in aberrant expression of myogenic specification factors as a potential mechanism driving RMS genesis. These findings suggest that RMS can originate from aberrant development of non-myogenic cells.

Keywords: Tbx1; endothelium; hedgehog; myogenesis; rhabdomyosarcoma; sarcoma; skeletal muscle; transdifferentiation.


Figures

Figure 1
Figure 1. aP2-Cre labels cells within both adipose tissue and skeletal muscle
(A) Representative whole mount images of BAT, WAT, quad, SCM and tongue from aP2-Cre;mT/mG and aP2-Cre;mT/mG;SmoM2/+ mice (n = 3). Scale bars, 3 mm. Arrowhead denotes tumor. (B) Representative tissue sections from mT/mG, aP2-Cre;mT/mG and aP2-Cre;mT/mG;SmoM2/+ mice (n = 3). Scale bars, 50 μm. (C) Representative images of tumor center and tumor periphery of aP2-Cre;mT/mG;SmoM2/+ mice (n = 3). Scale bars, 50 μm. See also Figure S1.
Figure 2
Figure 2. SmoM2 dependent proliferation of aP2-Cre labeled cells during embryogenesis
(A–B) Representative H&E and immunostaining of sagittal sections from AT (A) and AST (B) embryos. Embryonic age and number of embryos with Tomato positive expansions/total embryos shown on left. Right panels show high magnification of boxed insets. Scale bars, 100 μm (left) and 50 μm (right). (C) H&E staining of transverse section of E17.5 AST embryo. (D) Magnification of boxed inset from (C) of AST embryo immunostained as in (A). Scale bar, 500 μm. (E) Magnification of boxed inset (D) of AST embryo immunostained as in (A)(n = 3). Scale bar, 50 μm. * denotes regions of adipose. See also Figure S2.
Figure 3
Figure 3. aP2-Cre labels endothelial cells within skeletal muscle interstitium
(A) Immunostaining of AT SCM cross sections illustrating Tomato (red, arrowheads), PAX7 (green, arrows), DAPI (blue) positive cells (high magnification inset shown)(n = 3). Scale bars, 25 μm. (B) β-galactosidase staining of myoblasts isolated from aP2-Cre;R26-LacZ mice following in vitro differentiation. Cells infected with adeno-Cre as control (n = 3). Scale bars, 50 μm. (C) Immunostaining of AT SCM cross sections showing Tomato (red), MHC (green), LAMININ (magenta) and DAPI (blue)(n = 3). Scale bar, 50 μm. (D) Confocal microscopy of (C) illustrating 3D cross sections with Tomato labeled cells in muscle interstitium. Scale bar, 10 μm. (E–F) Isolation of Tom+ and Tom cells from AT SCM by FACS (E) and confirmation by real-time PCR for Tomato (F). Data shown are normalized to Actb (n = 3, mean ± SEM). (G–J) Gene expression by real-time PCR from Tom+ and Tom cells isolated as in (E) in comparison to mature SCM and BAT from SmoM2/M2 mice: aP2 (G), myogenic genes Myf5 and Pax7 (H), adipose genes Pparg and Ucp1 (I), and muscle interstitial cell genes (J). Data shown are normalized to Actb expression and expressed relative to SCM (n = 3, mean ± SEM). (K) Principle component analysis of Tom+ and Tom cells isolated as in (E), microvascular endothelial cells, satellite cells, PW1+ interstitial cells (PICs) and adipose. Coordinates describe 68.5% of the data. (L) Gene ontology analysis of genes enriched in Tom+ vs Tom cells isolated as in (E). (M) Expression of endothelial genes in Tom+ and Tom cells isolated as in (E) by real-time PCR. Data analyzed as in (G)(n = 3, mean ± SEM). (N) Immunostaining of AT SCM cross sections showing Tomato (red), PECAM1 (green), DAPI (blue) (n = 2). Scale bar, 50 μm. (O) Immunocytochemistry of cells isolated from AT SCM and grown to confluence showing Tomato (red), PECAM1 (green), DAPI (blue) (n = 4). Scale bar, 50 μm. *p < 0.05, ** p < 0.01, *** p < 0.001. See also Figure S3.
Figure 4
Figure 4. Oncogenic KRAS drives angiosarcoma in aP2-Cre expressing cells
(A) Kaplan-Meier survival curve illustrating survival of aP2-Cre;LSL-KrasG12D;Cdkn2aFlox/Flox(n = 24) and aP2-Cre;LSL-KrasG12D(n = 10) mice. p < 0.0001. (B) Percentage of aP2-Cre;LSL-KrasG12D;Cdkn2aFlox/Flox mice developing angiosarcoma or other malignancies. (C) Angiosarcomas (arrowheads) in aP2-Cre;LSL-KrasG12D;Cdkn2aFlox/Flox mice. (D) Representative H&E staining and IHC of angiosarcoma markers in aP2-Cre;LSL-KrasG12D;Cdkn2aFlox/Flox tumors(n = 6). Scale bars, 50 μm. See also Figure S4.
Figure 5
Figure 5. SmoM2 promotes a myogenic fate switch during endothelial cell development
(A) FACS isolation of Tom+ and Tom cells from AST SCM. (B) Gene expression (aP2, Pecam1, Tek, Pax7 and Pparg) of Tom+ and Tom cells isolated as in (A) compared to mature SCM and BAT from SmoM2/M2 mice by real-time PCR. Data shown are normalized to Actb expression (tdTomato) or normalized to Actb expression and expressed relative to SCM (n = 3, mean ± SEM). (C) Gene expression of SmoM2-YFP and Shh target genes by real-time PCR in isolated Tom+ and Tom cells, mature SCM and BAT from SmoM2/M2 mice as well as whole tumor from AST mice. Data shown are normalized to Actb expression expressed relative to SCM (n = 3, mean ± SEM). (D) Representative H&E staining and IHC of myogenic marker (MYOD1) and endothelial marker (PECAM1) in sagittal section of E17.5 AST embryo(n = 3). Scale bars, 100 μm (left), 50 μm (right). High magnification of boxed area (right) shown. *p < 0.05, ** p < 0.01, *** p < 0.001. See also Figure S5.
Figure 6
Figure 6. Purified tumor cells retain expression of myogenic specification factors critical for head and neck muscle development
(A) FACS isolation of PECAM1 and Tomato stained cells from AST SCM and tumors. (B) Sphere formation of tumor cell populations sorted as in (A)(n = 4). Scale bars are 100 μm. (C–E) Expression of SmoM2-YFP and Shh target genes (C), myogenic markers (D) and endothelial markers (E) in populations isolated as in (A), mature SCM from SmoM2/M2 mice and whole tumor from AST mice. Data shown are normalized to Actb expression and expressed relative to sorted TomPECAM1 cells (n = 3, mean ± SEM). (F) Gene ontology analysis of genes upregulated in Tom+PECAM1 cells versus Tom+PECAM1 cells isolated from AST tumors. (G) Real-time PCR of myogenic specification factors in cells isolated in (A). Data are analyzed as in (C)(n = 3, mean ± SEM). (H) Representative dual ISH for Tbx1 and IHC for Tomato in sagittal section of E15.5 AST embryo. Right panel is enlarged boxed region on left with high magnification inset shown (n = 4). Scale bars, 100 μm (left) and 20 μm (right). (I) Representative immunostaining for Tomato (red), MYOD1 (green), and DAPI (blue) in sagittal sections of E15.5 AST embryo shown in H. (n = 4). Scale bar, 50 μm. *p < 0.05, ** p < 0.01, *** p < 0.001. See also Figure S6 and Tables S1 and S2.
Figure 7
Figure 7. Purified tumor cells and tumor vasculature express common endothelial markers
(A) Venn diagram of genes upregulated in Tom+PECAM1 and Tom+PECAM1+ cells compared to TomPECAM1 cells isolated from AST tumors. (B) Gene ontology analysis of 32 overlapping genes from (A). (C) Gene expression of endothelial genes identified in (A) by real-time PCR. Data shown are normalized to Actb expression and expressed relative to sorted TomPECAM1 cells (n = 3, mean ± SEM). (D, E) Representative H&E staining (D) and immunostaining (E) for Tomato (red), KDR (green) and DAPI (blue) on sagittal section of E9.5 AT embryo (n = 2). Scale bars, 250 μm. (F) Magnification of boxed inset in (E). Scale bars, 100 μm. (G) Magnification of boxed inset in (F) with high magnification inset in lower left. Scale bars, 50 μm. (H, I) Representative H&E staining (H) and immunostaining (I) for Tomato (red), KDR (green) and DAPI (blue) on sagittal section of E10.5 AT embryo (n = 4). Scale bars, 250 μm. (J) Magnification of boxed inset in (I). Scale bars, 100 μm. (K) Magnification of boxed inset in (J) with high magnification inset in lower left. Scale bars, 50 μm. (L) Representative immunostaining of Tomato positive proliferations in sagittal sections of E15.5 AST embryo (Figure 6H–I). Tomato (red), KDR (green), DAPI (blue)(n = 4). High magnification insets are shown in upper right. Scale bar, 10 μm. *p < 0.05, ** p < 0.01, *** p < 0.001. See also Table S3.
Figure 8
Figure 8. FN-RMS in Kdr::Cre;SmoM2/+ mice
(A) Representative whole mount images of Quad and SCM muscle from Kdr::Cre;R26-tdTom mice (n = 3). Scale bar, 1mm. (B) Representative immunostaining of PECAM1 (green), Tomato (red), LAMININ (magenta) and DAPI (blue) in SCM and quad of Kdr::Cre;R26-tdTom mice (n = 3). Scale bars, 50 μm. (C) Representative sagittal sections of E17.5 Kdr::Cre;SmoM2/+ embryo with H&E staining (top) and IHC for MYOD1 and MYOG (bottom) (n = 4). High magnification of boxed inset shown on top right. Scale bars, 250 μm (top left) and 50 μm (top right and bottom IHC panels). (D) Representative immunostaining of Tomato (red), MYOD1 (green), DAPI (blue) in tumor from Kdr::Cre;SmoM2/+;R26-tdTom mice (n = 3). High magnification inset at bottom left of boxed area in center. Scale bar, 50 μm. (E) Model highlighting KDR expressing multipotent muscle and endothelial cell progenitors in the pharnygeal mesoderm. (F) Model highlighting rhabdomyosarcomagenesis in aP2-Cre expressing cells.

Comment in

References

    1. Aguirre AJ, Bardeesy N, Sinha M, Lopez L, Tuveson DA, Horner J, Redston MS, DePinho RA. Activated Kras and Ink4a/Arf deficiency cooperate to produce metastatic pancreatic ductal adenocarcinoma. Genes Dev. 2003;17:3112–3126. - PMC - PubMed
    1. Benjamini Y, Hochberg Y. Controlling the False Discovery Rate: A Practical and Powerful Approach to Multiple Testing. Journal of the Royal Statistical Society Series B (Methodological) 1995;57:289–300.
    1. Blum JM, Ano L, Li Z, Van Mater D, Bennett BD, Sachdeva M, Lagutina I, Zhang M, Mito JK, Dodd LG, et al. Distinct and overlapping sarcoma subtypes initiated from muscle stem and progenitor cells. Cell reports. 2013;5:933–940. - PMC - PubMed
    1. Borycki AG, Brunk B, Tajbakhsh S, Buckingham M, Chiang C, Emerson CP., Jr Sonic hedgehog controls epaxial muscle determination through Myf5 activation. Development. 1999;126:4053–4063. - PubMed
    1. Bridge JA, Liu J, Weibolt V, Baker KS, Perry D, Kruger R, Qualman S, Barr F, Sorensen P, Triche T, Suijkerbuijk R. Novel genomic imbalances in embryonal rhabdomyosarcoma revealed by comparative genomic hybridization and fluorescence in situ hybridization: an intergroup rhabdomyosarcoma study. Genes, chromosomes & cancer. 2000;27:337–344. - PubMed

Publication types

Substances