Randomized Controlled Trial
. 2018 Jan 6;10(1):49.
doi: 10.3390/nu10010049.

Association between Diet-Quality Scores, Adiposity, Total Cholesterol and Markers of Nutritional Status in European Adults: Findings from the Food4Me Study

Affiliations
Randomized Controlled Trial

Association between Diet-Quality Scores, Adiposity, Total Cholesterol and Markers of Nutritional Status in European Adults: Findings from the Food4Me Study

Rosalind Fallaize et al. Nutrients. .

Abstract

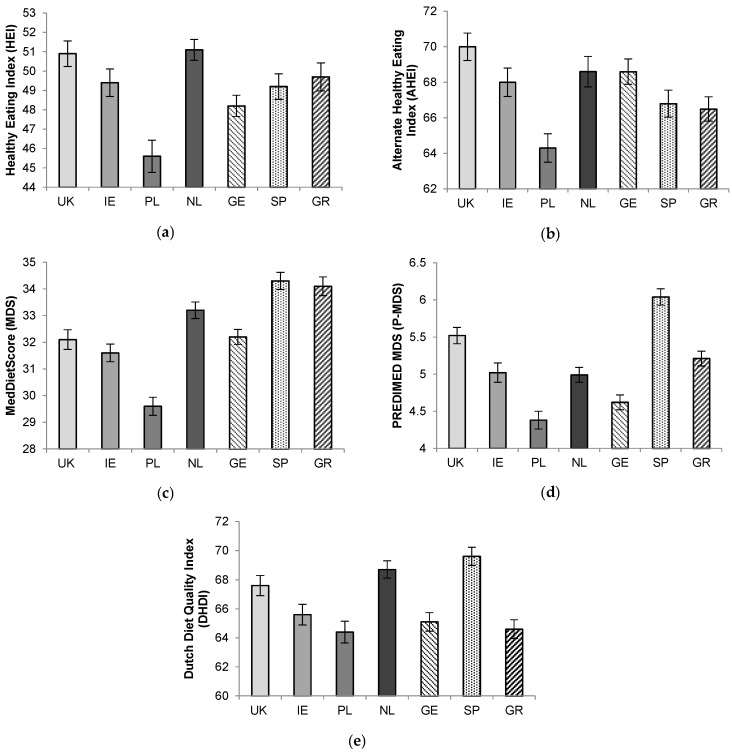
Diet-quality scores (DQS), which are developed across the globe, are used to define adherence to specific eating patterns and have been associated with risk of coronary heart disease and type-II diabetes. We explored the association between five diet-quality scores (Healthy Eating Index, HEI; Alternate Healthy Eating Index, AHEI; MedDietScore, MDS; PREDIMED Mediterranean Diet Score, P-MDS; Dutch Healthy Diet-Index, DHDI) and markers of metabolic health (anthropometry, objective physical activity levels (PAL), and dried blood spot total cholesterol (TC), total carotenoids, and omega-3 index) in the Food4Me cohort, using regression analysis. Dietary intake was assessed using a validated Food Frequency Questionnaire. Participants (n = 1480) were adults recruited from seven European Union (EU) countries. Overall, women had higher HEI and AHEI than men (p < 0.05), and scores varied significantly between countries. For all DQS, higher scores were associated with lower body mass index, lower waist-to-height ratio and waist circumference, and higher total carotenoids and omega-3-index (p trends < 0.05). Higher HEI, AHEI, DHDI, and P-MDS scores were associated with increased daily PAL, moderate and vigorous activity, and reduced sedentary behaviour (p trend < 0.05). We observed no association between DQS and TC. To conclude, higher DQS, which reflect better dietary patterns, were associated with markers of better nutritional status and metabolic health.

Keywords: Dutch Healthy Diet Index; Healthy Eating Index; Mediterranean Diet Score; diet scores; dried blood spots; metabolic health; nutritional biomarkers; personalized nutrition.


Conflict of interest statement

T.E.G. is founder, stockowner and C.E.O. of Vitas; C.A.D. is founder, board member, stockowner, and consultant for Vitas Ltd. None of the other authors reports a conflict of interest.

Figures

Figure 1
Figure 1
(a) Healthy Eating Index (HEI); (b) Alternate Healthy Eating Index (AHEI); (c) MedDietScore (MDS); (d) PREDIMED MDS (P-MDS); and, (e) Dutch Healthy Diet Index (DHDI) according to country recruiting participants to the Food4Me Study. Values represent means ± standard error of mean (SEM). UK, United Kingdom; IE, Ireland; PL, Poland; NL, The Netherlands; GE, Germany; SP, Spain; GR, Greece. Significant differences observed across all diet quality scores (p < 0.001) following general linear models adjusted for age and sex (HEI and AHEI): for (a) UK vs. PL p < 0.001; IE vs. PL p = 0.002; NL vs. PL p < 0.001; IE; SP vs. PL p < 0.001; GR vs. PL p < 0.001, (b) UK vs. PL p < 0.001; UK vs. SP p < 0.001; UK vs. GR p < 0.001; NL vs. PL p = 0.006; NL vs. SP p = 0.030; NL vs. GR p = 0.005; GE vs. PL p = 0.020; GE vs. GR p = 0.014, (c) SP vs. UK p < 0.001, SP vs. IE p < 0.001; SP vs. PL p < 0.001; SP vs. NL p < 0.001; SP vs. GE p < 0.001; GR vs. UK p < 0.001; GR vs. IE p < 0.001; GR vs. PL p < 0.001; GR vs. GE p < 0.001; NL vs. UK p < 0.001; IE vs. PL p = 0.003; GE vs. PL p < 0.001, (d) SP vs. UK p = 0.024; SP vs. IE p < 0.001; SP vs. PL p < 0.001; SP vs. NL p < 0.001, SP vs. GE p < 0.001; SP vs. GR p < 0.001; UK vs. PL p < 0.001; UK vs. IE p = 0.024; GR vs. PL p < 0.001; GR vs. IE p < 0.001; GR vs. GE p < 0.001; IE vs. PL p = 0.001; NL vs. PL p = 0.038, (e) UK vs. PL p < 0.001; UK vs. GE p = 0.002; UK vs. GR p < 0.001; NL vs. IE p = 0.022; NL vs. PL p < 0.001; NL vs. GE p < 0.001; NL vs. GR p < 0.001; SP vs. IE p < 0.001; SP vs. PL p < 0.001; SP vs. GE p < 0.001; SP vs. GR, p < 0.001.

Similar articles

Cited by

References

    1. Fung T.T., Willett W.C., Stampfer M.J., Manson J.E., Hu F.B. Dietary patterns and the risk of coronary heart disease in women. Arch. Intern. Med. 2001;161:1857–1862. doi: 10.1001/archinte.161.15.1857. - DOI - PubMed
    1. Micha R., Peñalvo J.L., Cudhea F., Imamura F., Rehm C.D., Mozaffarian D. Association between dietary factors and mortality from heart disease, stroke, and type 2 diabetes in the united states. JAMA. 2017;317:912–924. doi: 10.1001/jama.2017.0947. - DOI - PMC - PubMed
    1. Haveman-Nies A., Burema J., Cruz J.A.A., Osler M., van Staveren W.A. Dietary quality and lifestyle factors in relation to 10-year mortality in older europeans the seneca study. Am. J. Epidemiol. 2002;156:962–968. doi: 10.1093/aje/kwf144. - DOI - PubMed
    1. Huijbregts P., Feskens E., Räsänen L., Fidanza F., Nissinen A., Menotti A., Kromhout D. Dietary pattern and 20 year mortality in elderly men in finland, italy, and the netherlands: Longitudinal cohort study. BMJ. 1997;315:13–17. doi: 10.1136/bmj.315.7099.13. - DOI - PMC - PubMed
    1. Guenther P.M., Casavale K.O., Reedy J., Kirkpatrick S.I., Hiza H.A.B., Kuczynski K.J., Kahle L.L., Krebs-Smith S.M. Update of the healthy eating index: Hei-2010. J. Acad. Nutr. Diet. 2013;113:569–580. doi: 10.1016/j.jand.2012.12.016. - DOI - PMC - PubMed

Publication types

MeSH terms