

Excessive Endoplasmic Reticulum Stress Correlates with Impaired Mitochondrial Dynamics, Mitophagy and Apoptosis, in Liver and Adipose Tissue, but Not in Muscles in EMS Horses
- PMID: 29316632
- PMCID: PMC5796114
- DOI: 10.3390/ijms19010165
Excessive Endoplasmic Reticulum Stress Correlates with Impaired Mitochondrial Dynamics, Mitophagy and Apoptosis, in Liver and Adipose Tissue, but Not in Muscles in EMS Horses
Abstract
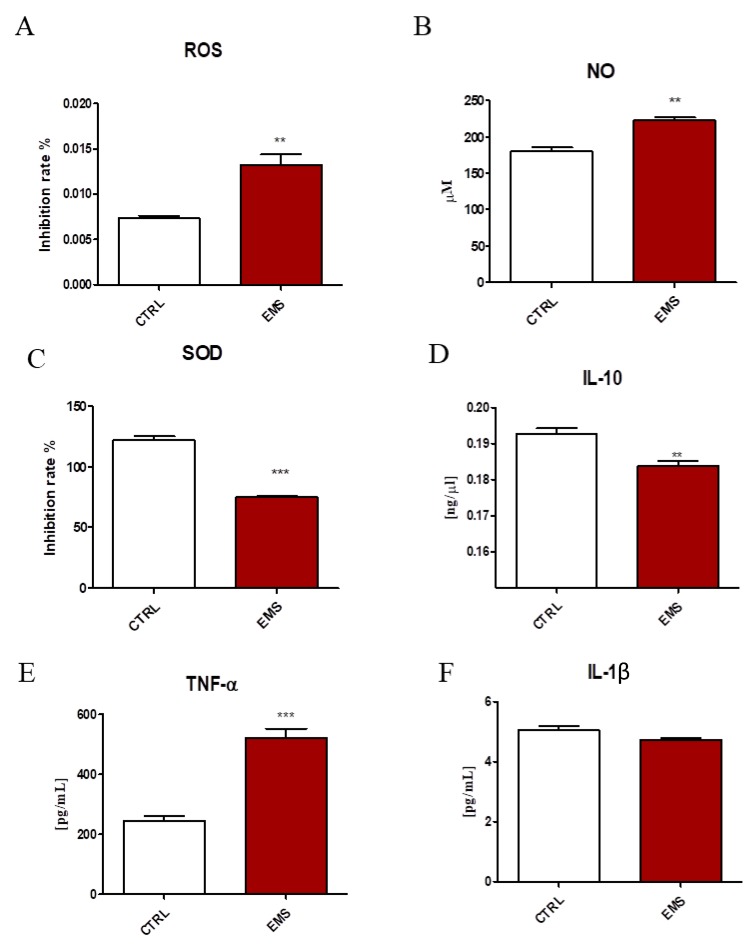
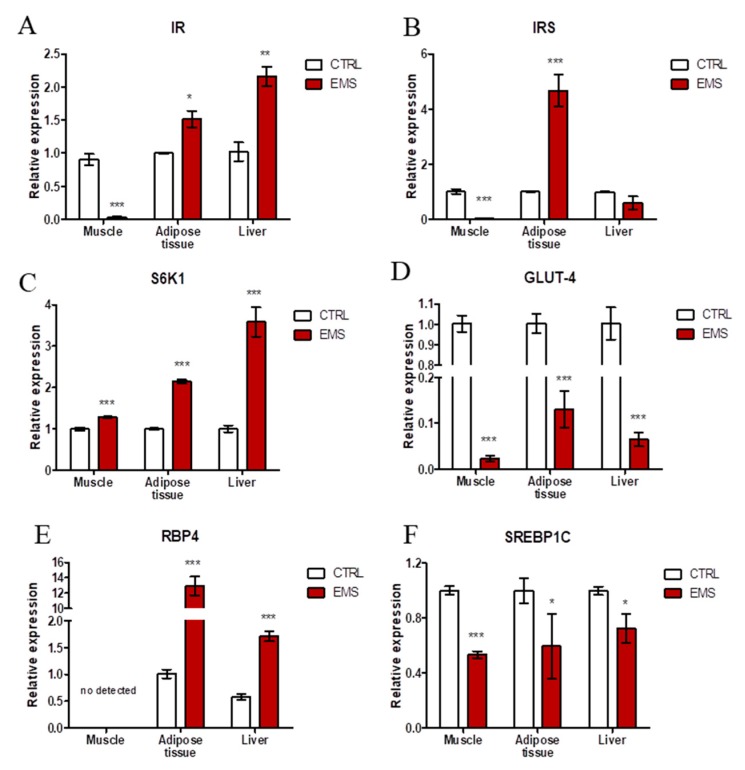
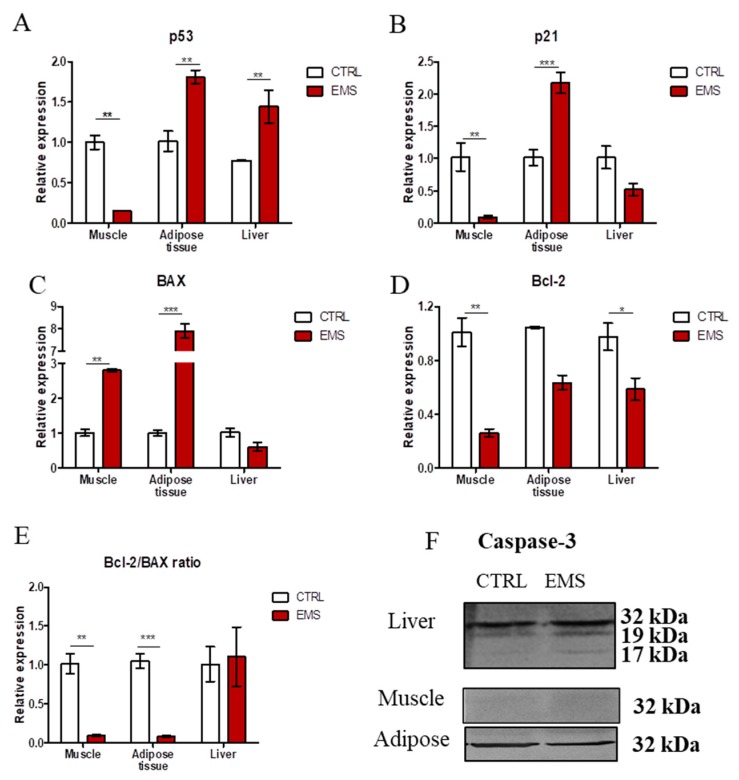
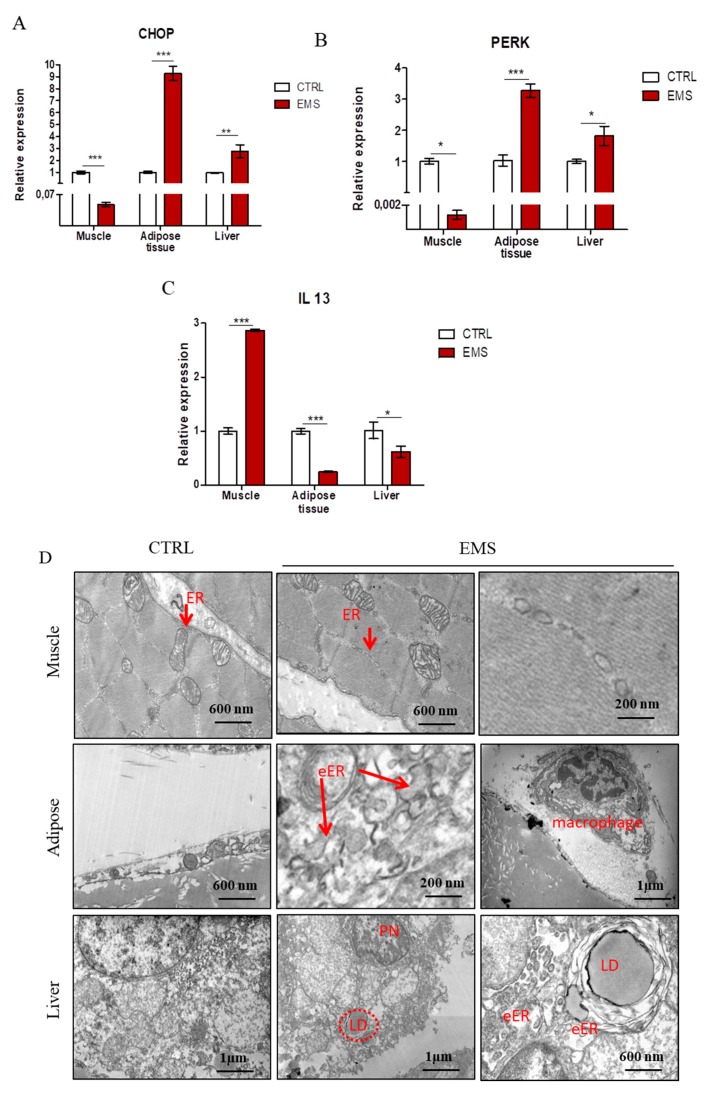
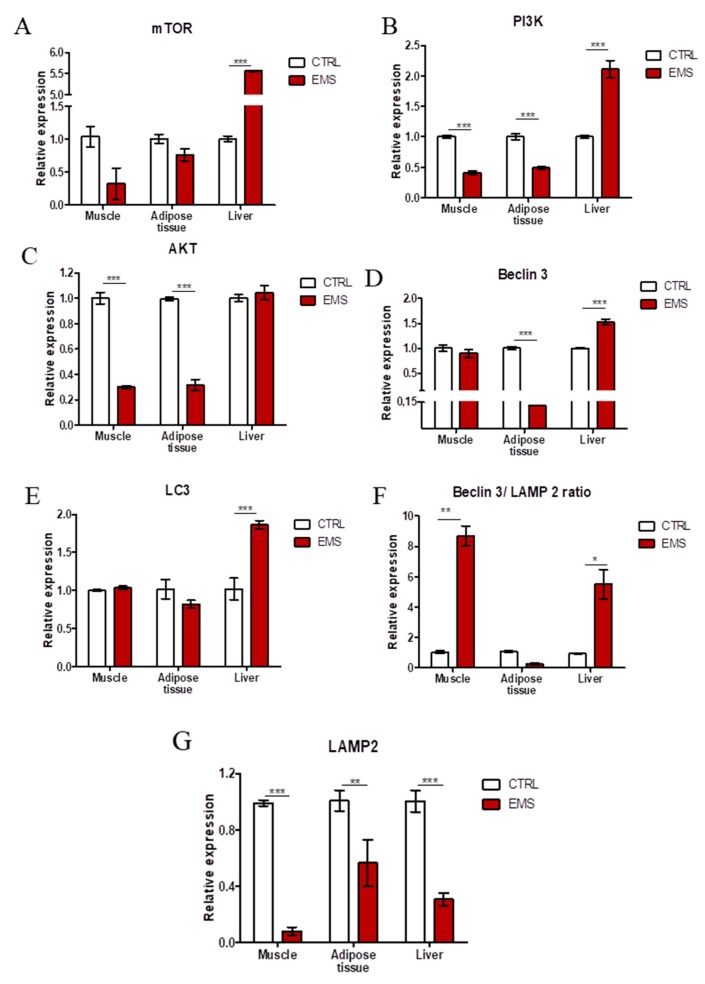
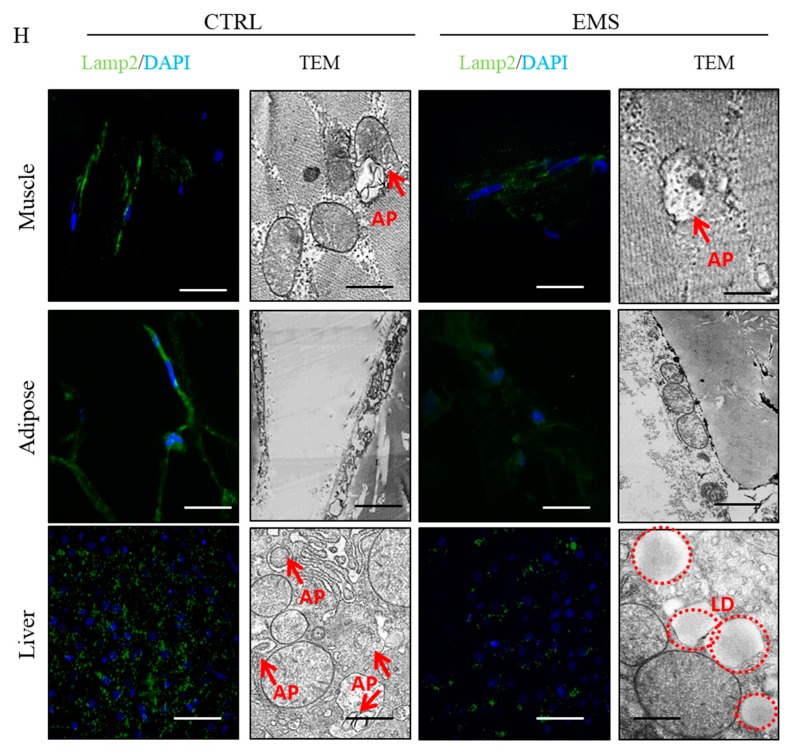
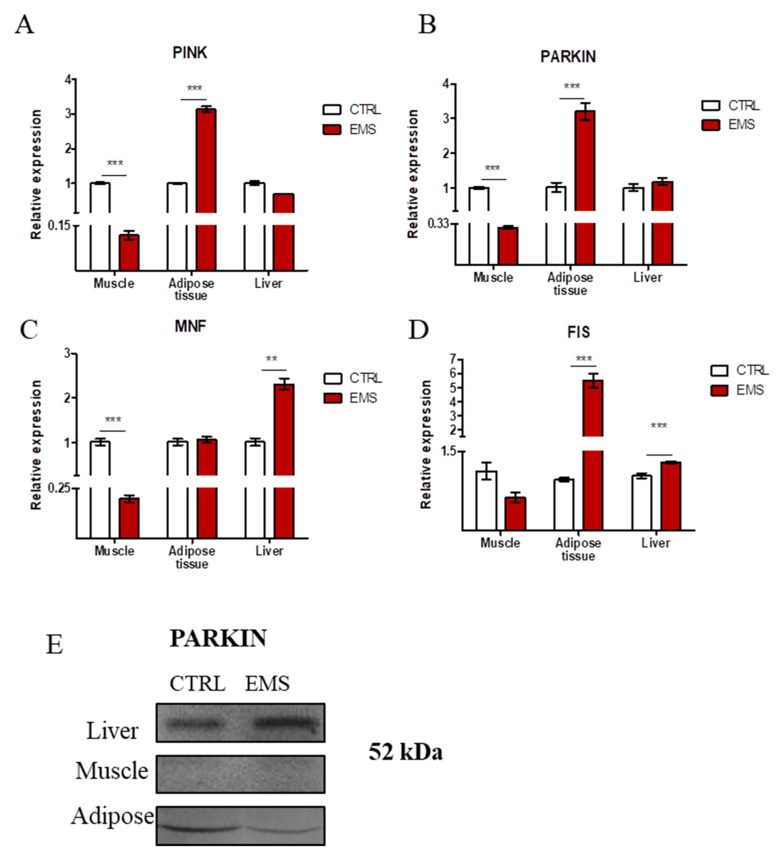
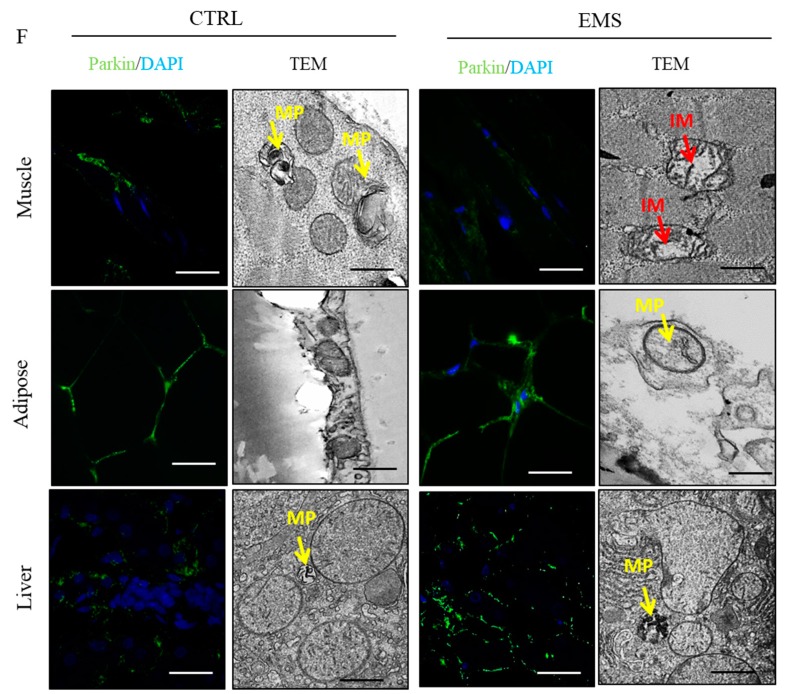
Nowadays, endocrine disorders have become more frequent in both human and veterinary medicine. In horses, reduced physical activity combined with carbohydrate and sugar overload may result in the development of the so-called equine metabolic syndrome (EMS). EMS is characterized by insulin resistance, hyperinsulinemia, elevated blood triglyceride concentrations and usually obesity. Although the phenotypic features of EMS individuals are well known, the molecular mechanism underlying disease development remains elusive. Therefore, in the present study, we analyzed insulin-sensitive tissues, i.e., muscles, liver and adipose tissue in order to evaluate insulin resistance and apoptosis. Furthermore, we assessed mitochondrial dynamics and mitophagy in those tissues, because mitochondrial dysfunction is linked to the development of metabolic syndrome. We established the expression of genes related to insulin resistance, endoplasmic reticulum (ER) stress and mitochondria clearance by mitophagy using RT-PCR and Western blot. Cell ultrastructure was visualized using electron transmission microscopy. The results indicated that adipose tissue and liver of EMS horses were characterized by increased mitochondrial damage and mitophagy followed by triggering of apoptosis as mitophagy fails to restore cellular homeostasis. However, in muscles, apoptosis was reduced, suggesting the existence of a protective mechanism allowing that tissue to maintain homeostasis.
Keywords: apoptosis; autophagy; insulin resistance; metabolic syndrome; mitochondria.
Conflict of interest statement
The authors declare no conflict of interest.
Figures
Similar articles
-
Combination of resveratrol and 5-azacytydine improves osteogenesis of metabolic syndrome mesenchymal stem cells.J Cell Mol Med. 2018 Oct;22(10):4771-4793. doi: 10.1111/jcmm.13731. Epub 2018 Jul 12. J Cell Mol Med. 2018. PMID: 29999247 Free PMC article.
-
Macroautophagy and Selective Mitophagy Ameliorate Chondrogenic Differentiation Potential in Adipose Stem Cells of Equine Metabolic Syndrome: New Findings in the Field of Progenitor Cells Differentiation.Oxid Med Cell Longev. 2016;2016:3718468. doi: 10.1155/2016/3718468. Epub 2016 Dec 8. Oxid Med Cell Longev. 2016. PMID: 28053691 Free PMC article.
-
Equine metabolic syndrome impairs adipose stem cells osteogenic differentiation by predominance of autophagy over selective mitophagy.J Cell Mol Med. 2016 Dec;20(12):2384-2404. doi: 10.1111/jcmm.12932. Epub 2016 Sep 14. J Cell Mol Med. 2016. PMID: 27629697 Free PMC article.
-
Autophagy and Mitochondria in Obesity and Type 2 Diabetes.Curr Diabetes Rev. 2017;13(4):352-369. doi: 10.2174/1573399812666160217122530. Curr Diabetes Rev. 2017. PMID: 26900135 Review.
-
Endoplasmic reticulum stress and development of insulin resistance in adipose, skeletal, liver, and foetoplacental tissue in diabesity.Mol Aspects Med. 2019 Apr;66:49-61. doi: 10.1016/j.mam.2018.11.001. Epub 2018 Nov 27. Mol Aspects Med. 2019. PMID: 30472165 Review.
Cited by
-
Effects of a blend of green tea and curcuma extract supplementation on lipopolysaccharide-induced inflammation in horses and ponies.PeerJ. 2019 Nov 12;7:e8053. doi: 10.7717/peerj.8053. eCollection 2019. PeerJ. 2019. PMID: 31741800 Free PMC article.
-
Exercise training remodels subcutaneous adipose tissue in adults with obesity even without weight loss.J Physiol. 2022 May;600(9):2127-2146. doi: 10.1113/JP282371. Epub 2022 Mar 20. J Physiol. 2022. PMID: 35249225 Free PMC article.
-
Nortropane alkaloids as pharmacological chaperones in the rescue of equine adipose-derived mesenchymal stromal stem cells affected by metabolic syndrome through mitochondrial potentiation, endoplasmic reticulum stress mitigation and insulin resistance alleviation.Stem Cell Res Ther. 2019 Jun 18;10(1):178. doi: 10.1186/s13287-019-1292-z. Stem Cell Res Ther. 2019. PMID: 31215461 Free PMC article.
-
Equine Metabolic Syndrome: A Complex Disease Influenced by Multifactorial Genetic Factors.Genes (Basel). 2023 Jul 27;14(8):1544. doi: 10.3390/genes14081544. Genes (Basel). 2023. PMID: 37628596 Free PMC article. Review.
-
Osteochondritis Dissecans (OCD)-Derived Chondrocytes Display Increased Senescence, Oxidative Stress, Chaperone-Mediated Autophagy and, in Co-Culture with Adipose-Derived Stem Cells (ASCs), Enhanced Expression of MMP-13.J Clin Med. 2019 Mar 8;8(3):328. doi: 10.3390/jcm8030328. J Clin Med. 2019. PMID: 30857162 Free PMC article.
References
-
- Geor R.J., McCue M.E., Schultz N. Current understanding of the equine metabolic syndrome phenotype. J. Equine Vet. Sci. 2013;33:841–844. doi: 10.1016/j.jevs.2013.08.010. - DOI
-
- Basinska K., Marycz K., Śmieszek A., Nicpoń J. The production and distribution of IL-6 and TNF-α in subcutaneous adipose tissue and their correlation with serum concentrations in Welsh ponies with equine metabolic syndrome. J. Vet. Sci. 2015;16:113–120. doi: 10.4142/jvs.2015.16.1.113. - DOI - PMC - PubMed
MeSH terms
Substances
LinkOut - more resources
Full Text Sources
Other Literature Sources
