. 2018 Jan 8;18(1):154.
doi: 10.3390/s18010154.

Characterization of System Status Signals for Multivariate Time Series Discretization Based on Frequency and Amplitude Variation

Affiliations

Characterization of System Status Signals for Multivariate Time Series Discretization Based on Frequency and Amplitude Variation

Woonsang Baek et al. Sensors (Basel). .

Abstract

Many fault detection methods have been proposed for monitoring the health of various industrial systems. Characterizing the monitored signals is a prerequisite for selecting an appropriate detection method. However, fault detection methods tend to be decided with user's subjective knowledge or their familiarity with the method, rather than following a predefined selection rule. This study investigates the performance sensitivity of two detection methods, with respect to status signal characteristics of given systems: abrupt variance, characteristic indicator, discernable frequency, and discernable index. Relation between key characteristics indicators from four different real-world systems and the performance of two fault detection methods using pattern recognition are evaluated.

Keywords: fault detection; frequency domain; sensor data.


Conflict of interest statement

The authors declare no conflict of interest.

Figures
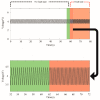
Figure 1
Figure 1
Time series where the frequency changes when the state of the system changes.
Figure 2
Figure 2
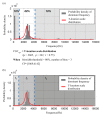
An example of probability density function (PDF) estimation for a dominant frequency of microphone sensor data collected by the automotive buzz, squeak, and rattle (BSR) noise detection system. (a) PDFopt of the sensor data, which follows a T-location scale distribution. The cut points of the dominant frequency, [1069 Hz, 4142 Hz] is derived with the user-defined discretization parameters, bin width, and the number of bins; (b) A set of labels [l1 l2 l3] is determined according to the number of cut points and the feature of each bin.
Figure 3
Figure 3
An example of the fault pattern extraction procedure (dataset with four sensors): Each sensor data (Sensor 1, Sensor 2, Sensor 3, Sensor 4) has same length, and discretized into 24 segments. Meanwhile, a set of cut-points of each sensor data are derived by PDF estimation, followed by a set of labels L(Xi)=[li1 li2 li3]. Then, designated labels in each column of four sensor data are converted into unique event codes, which are depicted as E=[e1 e2e81]. As a result, e11,e27,e42 are selected as fault patterns.
Figure 4
Figure 4
Extraction of the dominant frequency in the time series.
Figure 5
Figure 5
Calculation of DF (DF = 0.331): (a) A sensor signal; and, (b) the probability density of dominant frequencies in the fault, the no-fault states, and the overlapped probability density between them.
Figure 6
Figure 6
Sensor data collected from four different systems having no-fault state and fault state: (a) temperature signals collected from the laser welding monitoring system; (b) MAP (Manifold Absolute Pressure) signals collected from the vehicle diagnostics simulator; (c) microphone sensor signals collected from the automotive BSR noise monitoring system; and, (d) sensor signals for turbocharger inlet temperature collected from the marine diesel engine.
Figure 7
Figure 7
Laser welding monitoring system: (a) Laser welding station and (b) PRECITEC laser welding monitoring sensors.
Figure 8
Figure 8
Vehicle diagnostics simulator: HYUNDAI SIRIUS-II engine, NI 9221 data acquisition device, and eight sensor voltage controllers.
Figure 9
Figure 9
Automotive BSR noise monitoring system: a sensor array of nine microphones, four parabolic microphones, a pneumatic pusher controlled by a gantry robot, and NI cDAQ-9178 TM data acquisition device.

References

    1. Venkatasubramanian V., Rengaswamy R. A review of process fault detection and diagnosis: Part iii: Process history based methods. Comput. Chem. Eng. 2003;27:327–346. doi: 10.1016/S0098-1354(02)00162-X. - DOI
    1. Isermann R. Model-based fault-detection and diagnosis–status and applications. Ann. Rev. Control. 2005;29:71–85. doi: 10.1016/j.arcontrol.2004.12.002. - DOI
    1. Hellerstein J.M., Koutsoupias E., Papadimitriou C.H. On the analysis of indexing schemes; Proceedings of the Sixteenth ACM SIGACT-SIGMOD-SIGART Symposium on Principles of Database Systems; Tucson, AZ, USA. 11–15 May 1997.
    1. Nguyen S.H., Nguyen H.S. Pattern extraction from data. Fundam. Inform. 1998;34:129–144.
    1. Lin J., Keogh E., Wei L., Lonardi S. Experiencing sax: A novel symbolic representation of time series. Data Min. Knowl. Discov. 2007;15:107–144. doi: 10.1007/s10618-007-0064-z. - DOI

LinkOut - more resources