. 2018 Jan 9;15(1):11.
doi: 10.1186/s12974-018-1055-2.

Decreased microglial activation through gut-brain axis by prebiotics, probiotics, or synbiotics effectively restored cognitive function in obese-insulin resistant rats

Affiliations

Decreased microglial activation through gut-brain axis by prebiotics, probiotics, or synbiotics effectively restored cognitive function in obese-insulin resistant rats

Titikorn Chunchai et al. J Neuroinflammation. .

Abstract

Background: Chronic high-fat diet (HFD) consumption caused not only obese-insulin resistance, but also cognitive decline and microglial hyperactivity. Modified gut microbiota by prebiotics and probiotics improved obese-insulin resistance. However, the effects of prebiotics, probiotics, and synbiotics on cognition and microglial activity in an obese-insulin resistant condition have not yet been investigated. We aimed to evaluate the effect of prebiotic (Xyloolidosaccharide), probiotic (Lactobacillus paracasei HII01), or synbiotics in male obese-insulin resistant rats induced by a HFD.

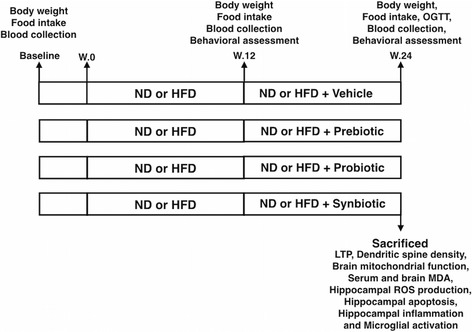
Methods: Male Wistar rats were fed with either a normal diet or a HFD for 12 weeks. At week 13, the rats in each dietary group were randomly divided into four subgroups including vehicle group, prebiotics group, probiotics group, and synbiotics group. Rats received their assigned intervention for an additional 12 weeks. At the end of experimental protocol, the cognitive functioning of each rat was investigated; blood and brain samples were collected to determine metabolic parameters and investigate brain pathology.

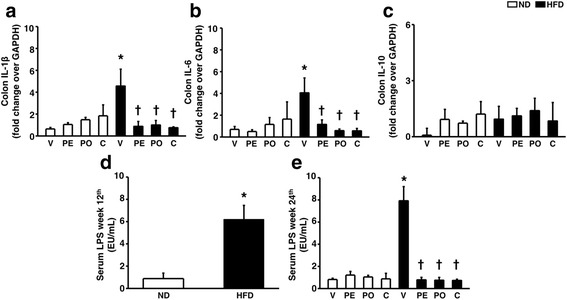
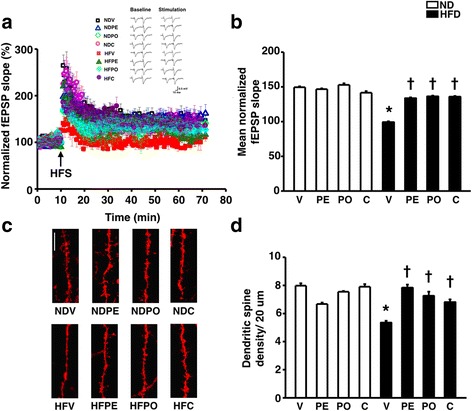
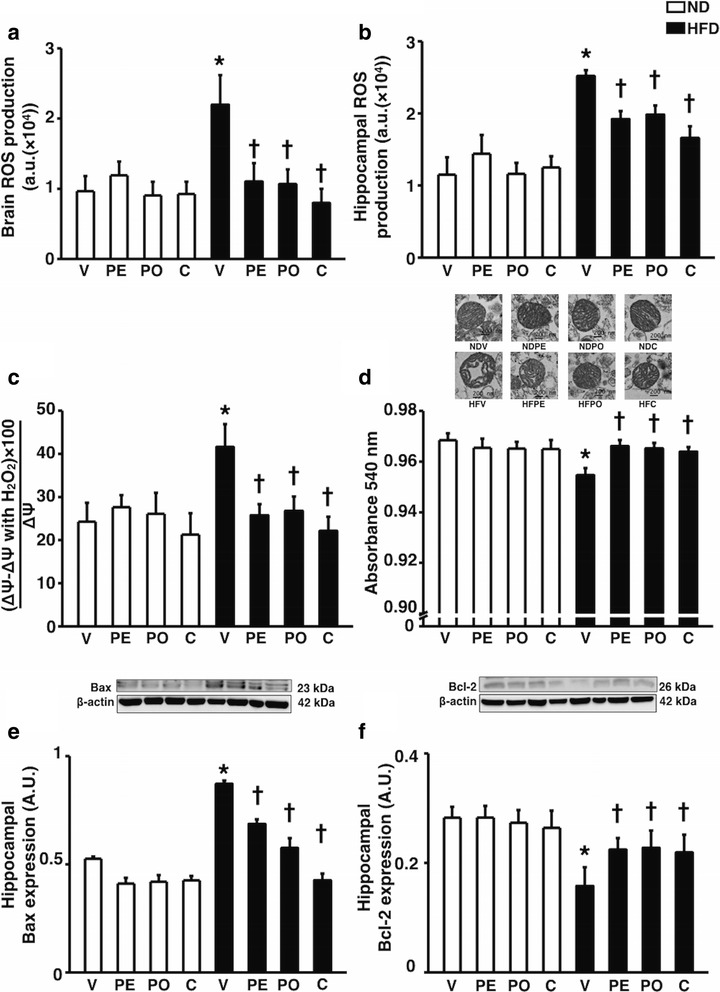
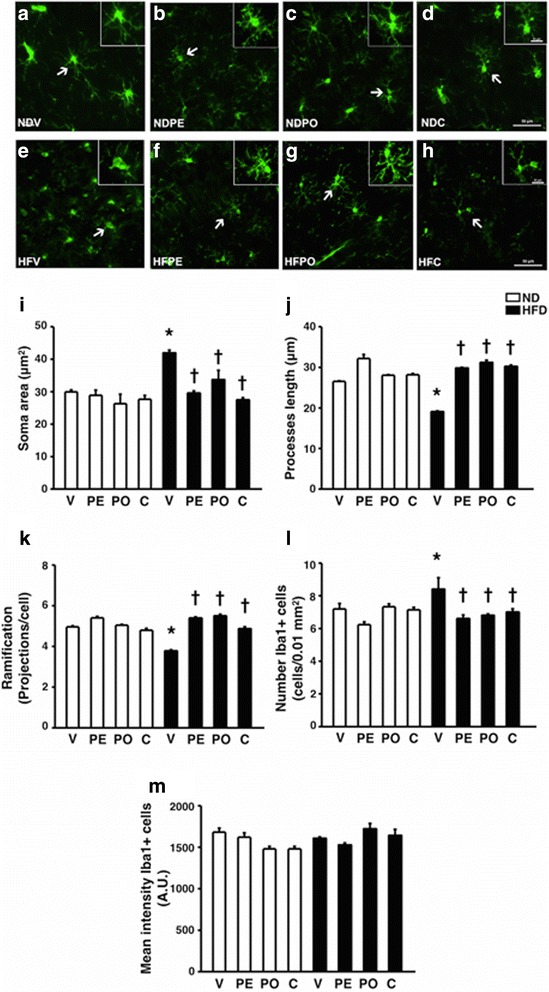
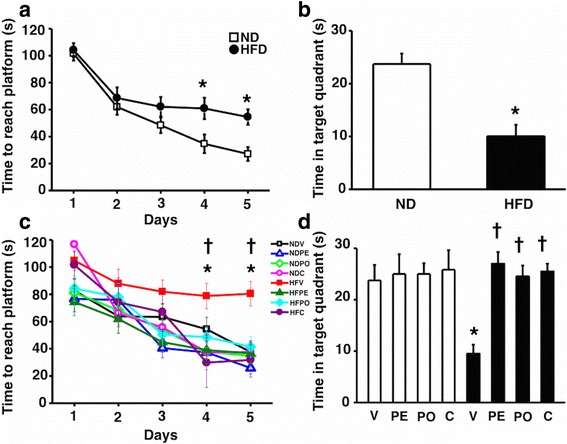
Results: We found that chronic HFD consumption leads to gut and systemic inflammation and impaired peripheral insulin sensitivity, which were improved by all treatments. Prebiotics, probiotics, or synbiotics also improved hippocampal plasticity and attenuated brain mitochondrial dysfunction in HFD-fed rats. Interestingly, hippocampal oxidative stress and apoptosis were significantly decreased in HFD-fed rats with all therapies, which also decreased microglial activation, leading to restored cognitive function.

Conclusions: These findings suggest that consumption of prebiotics, probiotics, and synbiotics restored cognition in obese-insulin resistant subjects through gut-brain axis, leading to improved hippocampal plasticity, brain mitochondrial function, and decreased microglial activation.

Keywords: Brain mitochondrial function; Cognitive function; Lactobacillus paracasei HII01; Microglia; Synbiotics; Xyloolidosaccharide.


Conflict of interest statement

Ethics approval

All animal studies were approved by the Institutional Animal Care and Use Committee (IACUC) of the Faculty of Medicine, Chiang Mai University (Permit number: 13/2558 on May 12, 2015) and conformed to the Guide for the Care and Use of Laboratory Animals published by the US National Institutes of Health (NIH guide, 8th edition, 2011).

Consent for publication

Not applicable.

Competing interests

The authors declare that there is no conflict of interest that could be perceived as prejudicing the impartiality of the research reported.

Publisher’s Note

Springer Nature remains neutral with regard to jurisdictional claims in published maps and institutional affiliations.

Figures

Fig. 1
Fig. 1
The experimental protocol of the present study
Fig. 2
Fig. 2
Effects of prebiotics, probiotics, or synbiotics on gut inflammation and endotoxemia induced by long-term HFD consumption. ac The pro-inflammatory cytokine including IL-1β expression, IL-6 and IL-10, anti-inflammatory cytokine, expression respectively. d Serum LPS level of ND- and HFD-fed rats at 12th week. e Serum LPS level of ND- and HFD-fed rats after receiving prebiotics, probiotics, or synbiotics. ND: 12-week-normal diet-fed rats; HFD: 12-week high fat-fed rats; V: rats receiving PBS as vehicle; PE: rats receiving prebiotics; PO: rats receiving probiotics; C: rats receiving combination of prebiotics and probiotics as synbiotics (N = 6 of each group) *p < 0.05 in comparison with the ND-fed rats; †p < 0.05 in comparison with the HFD-fed rats receiving vehicle
Fig. 3
Fig. 3
Effects of prebiotics, probiotics, or synbiotics on hippocampal plasticity. a Percentage normalized fEPSP slope of electrical-induced LTP by extracellular recording. b Mean fEPSP slope from 50 to 60 mins of electrical-induced LTP. c Representative images of Dil immunofluorescent under confocal microscopy (bar = 5 μm). d Mean dendritic spine density. ND: 24-week-normal diet-fed rats; HFD: 24-week high fat-fed rats; V: rats receiving PBS as vehicle; PE: rats receiving prebiotics; PO: rats receiving probiotics; C: rats receiving combination of prebiotics and probiotics as synbiotics (N = 6 of each group) *p < 0.05 in comparison with the ND-fed rats; †p < 0.05 in comparison with the HFD-fed rats receiving vehicle
Fig. 4
Fig. 4
Effects of prebiotics, probiotics, or synbiotics on brain mitochondrial function, hippocampal oxidative stress, and hippocampal apoptosis. a Whole brain isolated mitochondrial ROS production. b Hippocampal ROS production. c Percent change of whole brain isolated mitochondrial depolarization when incubated with hydrogen peroxide. d Upper panel: representative images of brain mitochondrial morphology. Lower panel: whole brain isolated mitochondrial absorbance value. e Upper panel: representative immunoblotting images of Bax relative to actin expression. Lower panel: the expression of hippocampal Bax protein relative to actin. f Upper panel: representative immunoblotting images of Bcl-2 relative to actin expression. Lower panel: the expression of hippocampal Bcl-2 protein relative to actin. ND: 24-week-normal diet-fed rats; HFD: 24-week high fat-fed rats; V: rats receiving PBS as vehicle; PE: rats receiving prebiotics; PO: rats receiving probiotics; C: rats receiving combination of prebiotics and probiotics as synbiotics (N = 6 of each group) *p < 0.05 in comparison with the ND-fed rats; †p < 0.05 in comparison with the HFD-fed rats receiving vehicle
Fig. 5
Fig. 5
Effects of prebiotics, probiotics, or synbiotics on brain microglia morphology. a-h Representative images of Iba-1 immunofluorescent under confocal microscopy at CA1 of the hippocampus (bar = 50 μm). i Soma area of Iba-1 positive cell. j Processes length of Iba-1 positive cell. k The ramification of Iba-1 positive cell. l Number Iba-1 positive cell. m Mean fluorescent intensity of Iba-1 positive cell. ND: 24-week-normal diet-fed rats; HFD: 24-week high fat-fed rats; V: rats receiving PBS as vehicle; PE: rats receiving prebiotics; PO: rats receiving probiotics; C: rats receiving combination of prebiotics and probiotics as synbiotics (3 microglial calls/slice, 3 slices/animal and 6 animals/ group) *p < 0.05 in comparison with the ND-fed rats; †p < 0.05 in comparison with the HFD-fed rats receiving vehicle
Fig. 6
Fig. 6
Effects of prebiotics, probiotics, or synbiotics on cognitive function. a Time to reach the platform in acquisition test of Morris Water maze test of ND- and HFD-fed rats at 12th week. b Mean time spent in target quadrant of ND- and HFD-fed rats at 12th week. c Time to reach the platform in acquisition test of Morris Water maze test after receiving prebiotics, probiotics, or synbiotics. d Mean time spent in target quadrant after receiving prebiotics, probiotics, or synbiotics. ND: 24-week-normal diet-fed rats; HFD: 24-week high fat-fed rats; V: rats receiving PBS as vehicle; PE: rats receiving prebiotics; PO: rats receiving probiotics; C: rats receiving combination of prebiotics and probiotics as synbiotics (N = 6 of each group) *p < 0.05 in comparison with the ND-fed rats; †p < 0.05 in comparison with the HFD-fed rats receiving vehicle

References

    1. Collaboration NCDRF Trends in adult body-mass index in 200 countries from 1975 to 2014: a pooled analysis of 1698 population-based measurement studies with 19.2 million participants. Lancet. 2016;387(10026):1377–1396. - PMC - PubMed
    1. Clegg DJ, Gotoh K, Kemp C, Wortman MD, Benoit SC, Brown LM, et al. Consumption of a high-fat diet induces central insulin resistance independent of adiposity. Physiol Behav. 2011;103(1):10–16. - PMC - PubMed
    1. Pratchayasakul W, Kerdphoo S, Petsophonsakul P, Pongchaidecha A, Chattipakorn N, Chattipakorn SC. Effects of high-fat diet on insulin receptor function in rat hippocampus and the level of neuronal corticosterone. Life Sci. 2011;88(13–14):619–627. - PubMed
    1. Stranahan AM, Norman ED, Lee K, Cutler RG, Telljohann RS, Egan JM, et al. Diet-induced insulin resistance impairs hippocampal synaptic plasticity and cognition in middle-aged rats. Hippocampus. 2008;18(11):1085–1088. - PMC - PubMed
    1. Pintana H, Apaijai N, Pratchayasakul W, Chattipakorn N, Chattipakorn SC. Effects of metformin on learning and memory behaviors and brain mitochondrial functions in high fat diet induced insulin resistant rats. Life Sci. 2012;91(11–12):409–414. - PubMed