. 2018 Apr 1;78(7):1859-1872.
doi: 10.1158/0008-5472.CAN-17-1546. Epub 2018 Jan 9.

Investigating Low-Velocity Fluid Flow in Tumors with Convection-MRI

Affiliations

Investigating Low-Velocity Fluid Flow in Tumors with Convection-MRI

Simon Walker-Samuel et al. Cancer Res. .

Abstract

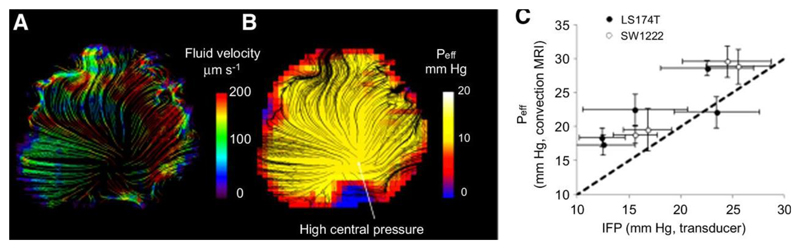
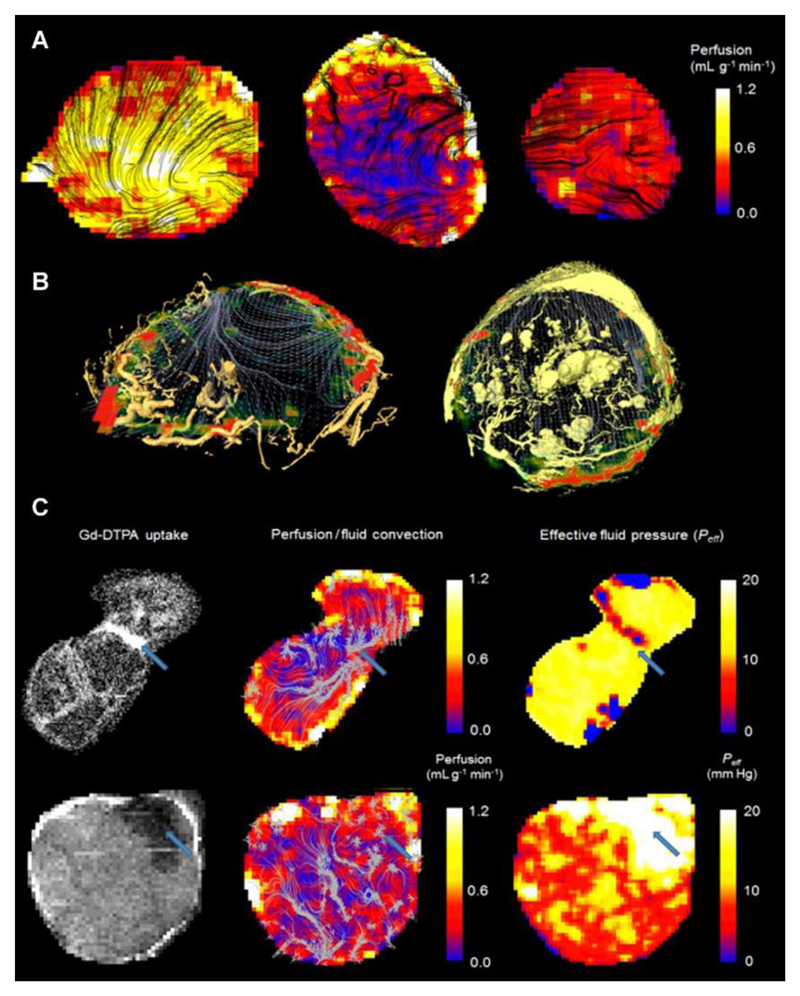
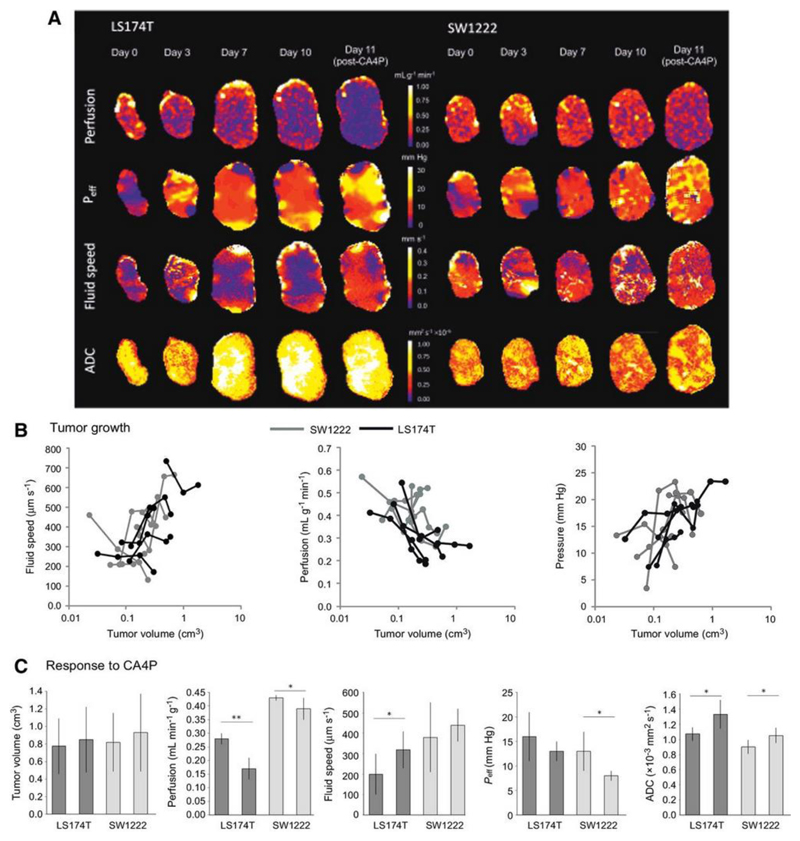
Several distinct fluid flow phenomena occur in solid tumors, including intravascular blood flow and interstitial convection. Interstitial fluid pressure is often raised in solid tumors, which can limit drug delivery. To probe low-velocity flow in tumors resulting from raised interstitial fluid pressure, we developed a novel MRI technique named convection-MRI, which uses a phase-contrast acquisition with a dual-inversion vascular nulling preparation to separate intra- and extravascular flow. Here, we report the results of experiments in flow phantoms, numerical simulations, and tumor xenograft models to investigate the technical feasibility of convection-MRI. We observed a significant correlation between estimates of effective fluid pressure from convection-MRI with gold-standard, invasive measurements of interstitial fluid pressure in mouse models of human colorectal carcinoma. Our results show how convection-MRI can provide insights into the growth and responsiveness to vascular-targeting therapy in colorectal cancers.Significance: A noninvasive method for measuring low-velocity fluid flow caused by raised fluid pressure can be used to assess changes caused by therapy. Cancer Res; 78(7); 1859-72. ©2018 AACR.


Conflict of interest statement

The authors declare no potential conflicts of interest.

Figures

Figure 1
Figure 1
Evaluation of fluid velocity measurements in a flow phantom. (a) Photograph of the fluid velocity flow phantom, based on a 5 mL syringe. The black, dashed box shows the approximate location of the imaging plane used. (b) Fluid velocity vector field, acquired from a slice through the flow phantom, color-coded to reflect the fluid speed, and with the direction characterised using a streamlining algorithm (black lines). (c) The average velocity in the center of the phantom is shown plotted against the inflow rate (error bars show the standard deviation in each measurement), for venc ranging from 5000 to 250 μm s-1. A significant linear correlation was measured for venc values of 5000 and 2000 μm s-1 (p < 0.01). At small venc, aliasing was noted at higher inflow rates (marked with arrows), alongside signal crushing (particularly evident at venc = 250 μm s-1). Each data point on the graph corresponds to the average value measured in 20 to 30 voxels in the phantom.
Figure 2
Figure 2
Evaluation of vascular nulling in tumor xenograft models. (a) Example maps showing the nulling ratio (the ratio of images acquired with vascular nulling to one acquired without vascular nulling) in an agar phantom and two different tumors. In the agar phantom, the nulling ratio was zero (top row), as expected due to the absence of flowing fluid. (b) A plot of the average nulling ratio as a function of the assumed blood longitudinal relaxation time (T1,blood). The assumed value of T1,blood is used to set the recovery time following the inversion preparation (trec = ln(2) T1,blood). The graph shows that, for a range of T1,blood of 1600 to 2500 ms, the nulling ratio is maximal. At lower values, the nulling is lower as the signal from blood has not recovered to a null point; at larger values, the signal has recovered past the null. The plateau represents a region where the signal from blood is near to or at the null point and has sufficient time to flow into and replace unlabelled blood within the imaging slice.
Figure 3
Figure 3
Example convection-MRI data sets (both raw image data and processed image data) in two example LS174T tumor xenografts: representative magnitude (a, h) and phase (b, i) images; maps of the change in phase with velocity-encoding gradients applied in vertical (readout) (c, j) and horizontal (phase-encoding) (d, k) directions. Velocity vector maps (e, l) show the direction of fluid transport through the tumor interstitium, which is better visualised using a streamlining algorithm (f, m) to connect pathways of coherent fluid convection (bottom row, colored arrows). Streamlines are color-coded to reflect the local fluid speed, which is also represented in histograms (g, n).
Figure 4
Figure 4
Results of simulations of fluid flow in SW1222 tumors. (a) shows a schematic diagram of the multi-compartment simulations (not to scale), in which red tubes represent blood vessels, yellow spheres are cells and the yellow cuboid represents the imaging slice. Parameters from the numerical simulation are overlaid. In (b), the mean value of IFV is plotted as a function of the percentage nulling of the interstitial fluid, for three simulated velocity values (0.02, 0.05 and 0.1 mm s-1). Error bars show the standard error in the mean value from 1000 Monte Carlo simulations. The graph in (c) shows IFV plotted against simulated interstitial velocity, for four vascular fractional nulling values (100, 95, 80 and 50%). Error bars show the standard error in the mean.
Figure 5
Figure 5
Estimation of effective fluid pressure (Peff) from convection-MRI measurements. a) An example convection-MRI fluid velocity streamline map and b) the corresponding effective pressure map from the same SW1222 tumor. c) Measurements of mean effective fluid pressure with convection-MRI, vs direct measurement of interstitial fluid pressure with a pressure transducer. Each point corresponds to the mean pressure in a different tumor, and error bars represent the standard error. Convection-MRI and pressure transducer measurements were significantly correlated (p < 0.05, Spearman’s rho).
Figure 6
Figure 6
Comparison of perfusion (measured using arterial spin labelling) and convection-MRI measurements. (a) Perfusion maps in SW1222 tumors (left and right) and an LS174T tumor (centre). ASL measurements are shown as heatmaps, and are overlaid with black streamlines showing the measured path followed by fluid within tumors. (b) Fluid flow measured in vivo with convectionMRI are shown as grey streamlines and perfusion is shown as a colorscale. The location of blood vessels is represented by yellow volume renderings, acquired using ex vivo microvascular casting and imaged with micro-CT. Data are shown in example LS174T (left) and SW1222 (right) tumors. In the SW1222 tumor, larger vessel structures in the centre of the tumor could be due to swelling by the casting material, although it is unclear if these vessels would have also been swollen under normal physiological conditions. A high-resolution version is provided in Supplemental Figure 3. (c) The relationship between fluid flow, vascular perfusion and the delivery of a medium molecular weight contrast agent in two LS174T tumors. Left column: Uptake of Gd-DTPA, an MRI contrast agent; middle column: vascular perfusion maps (color scale) overlaid with interstitial convection streamlines (grey); right column: effective pressure measurements from fluid mechanical modelling of convection-MRI data. The blue arrow in the top row shows a region between two lobes of the tumor in which the contrast agent preferentially accumulates, interstitial convection streamlines converge, a limited vascular supply is evident, and has a low IFP. In the bottom row, a blue arrow highlights a region with limited contrast agent uptake, a limited vascular supply, and with raised IFP. Both examples show the ability of convection-MRI and ASL, in combination, to identify regions that preferentially accumulate or resist the accumulation of exogenously administered agents. This could potentially be extended to the prediction of the uptake of therapeutic agents.
Figure 7
Figure 7
Tumor growth and response to therapy characterised with convection-MRI. (a) Example maps of vascular perfusion, effective pressure (Peff), fluid velocity and apparent diffusion coefficient (ADC) during 10 days of growth in two colorectal tumor xenografts (LS174T and SW1222), and at 24 hours following a single dose of the vascular disrupting agent CA4P (100 mg kg-1). (b) Scatter plots of the mean values of these parameters, from the whole tumor cohort. Fluid speed, measured using convection-MRI, tends to increase with tumor volume), whilst perfusion and Peff decrease. Each point corresponds to a single measurement from a tumor, and black and grey lines connect individual tumors (LS174T (n = 6) and SW1222 (n = 7) colorectal tumor xenografts, respectively). (c) shows the mean change in each parameter at 24 hours following treatment with CA4P. Tumor volume did not significantly change with treatment, whilst in LS174T tumors, perfusion decreased and interstitial fluid speed and ADC increased. In SW1222 tumors, perfusion and Peff significantly decreased and ADC significantly increased. Error bars represent the standard error in the mean; ** denotes p<0.01, * denotes p<0.05.

References

    1. Klarhofer M, Csapo B, Balassy C, Szeles JC, Moser E. High-resolution blood flow velocity measurements in the human finger. Magn Reson Med. 2001;45(4):716–719. - PubMed
    1. Gabe IT, Gault JH, Ross J, Jr, Mason DT, Mills CJ, Schillingford JP, Braunwald E. Measurement of instantaneous blood flow velocity and pressure in conscious man with a catheter-tip velocity probe. Circulation. 1969;40(5):603–614. - PubMed
    1. Ivanov KP, Kalinina MK, Levkovich Yu I. Blood flow velocity in capillaries of brain and muscles and its physiological significance. Microvascular research. 1981;22(2):143–155. - PubMed
    1. Jain RK. Transport of molecules in the tumor interstitium: a review. Cancer research. 1987;47(12):3039–3051. - PubMed
    1. Boucher Y, Jain RK. Microvascular pressure is the principal driving force for interstitial hypertension in solid tumors: implications for vascular collapse. Cancer research. 1992;52(18):5110–5114. - PubMed

Publication types