. 2018 Apr;67(4):554-568.
doi: 10.2337/db17-0318. Epub 2018 Jan 9.

The Diabetes Gene and Wnt Pathway Effector TCF7L2 Regulates Adipocyte Development and Function

Affiliations

The Diabetes Gene and Wnt Pathway Effector TCF7L2 Regulates Adipocyte Development and Function

Xi Chen et al. Diabetes. 2018 Apr.

Abstract

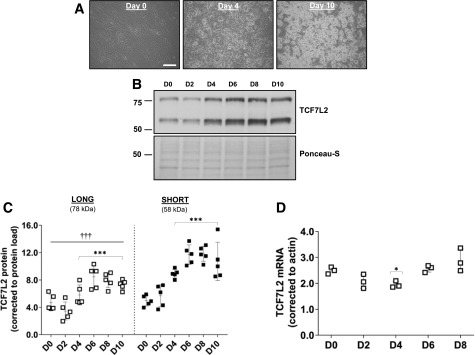
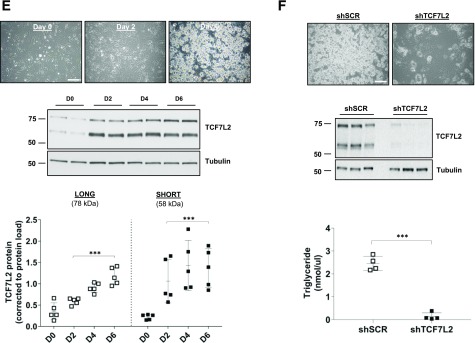
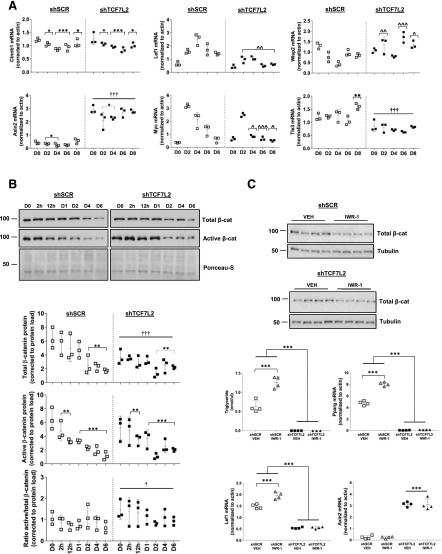
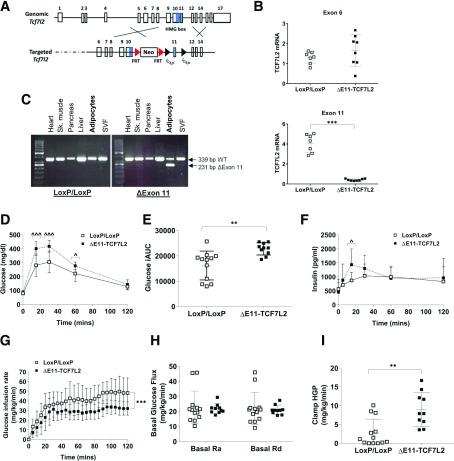
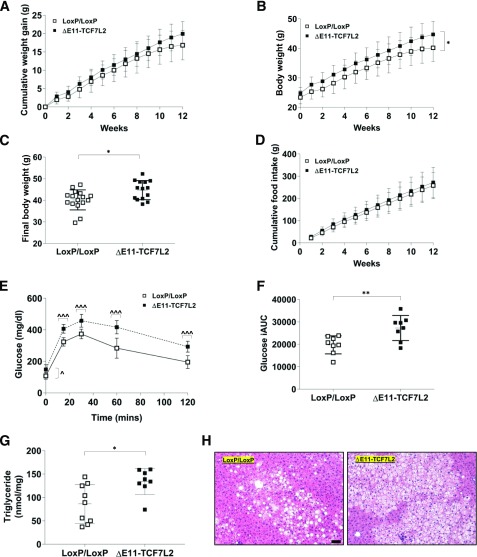
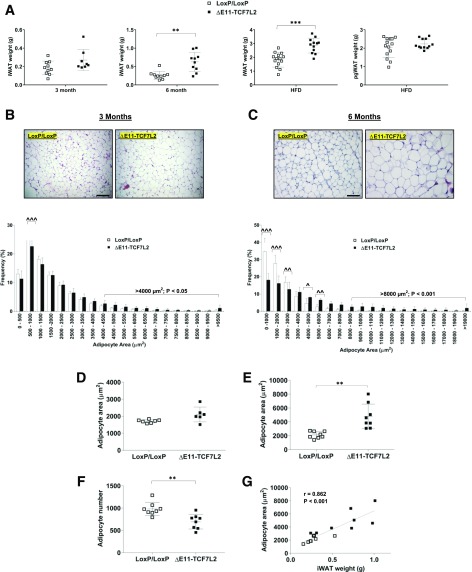
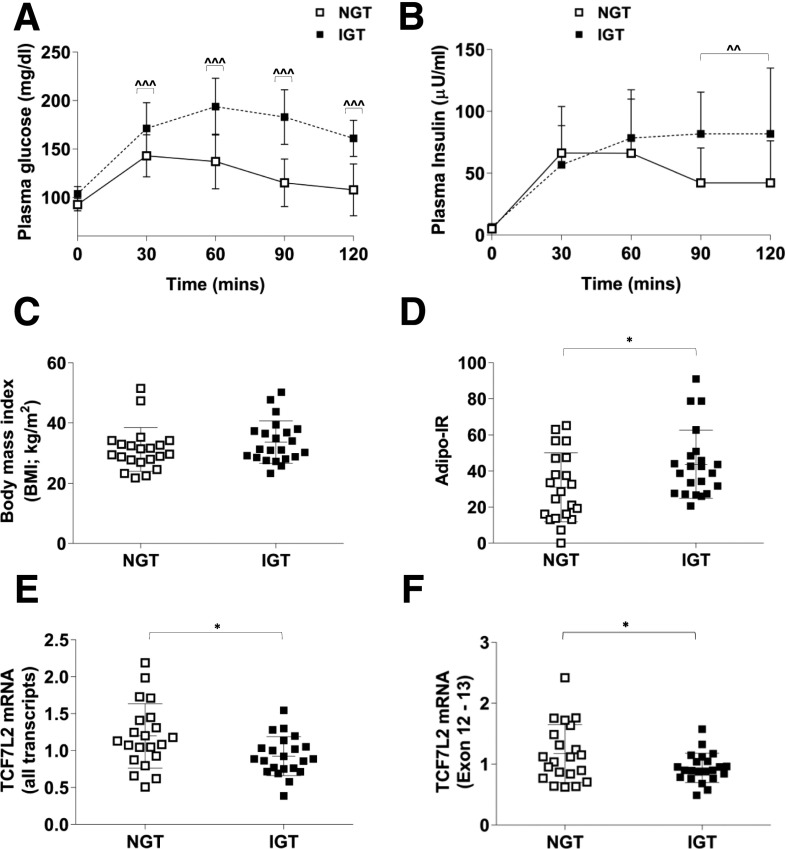
The gene encoding for transcription factor 7-like 2 (TCF7L2) is the strongest type 2 diabetes mellitus (T2DM) candidate gene discovered to date. The TCF7L2 protein is a key transcriptional effector of the Wnt/β-catenin signaling pathway, which is an important developmental pathway that negatively regulates adipogenesis. However, the precise role that TCF7L2 plays in the development and function of adipocytes remains largely unknown. Using a combination of in vitro approaches, we first show that TCF7L2 protein is increased during adipogenesis in 3T3-L1 cells and primary adipocyte stem cells and that TCF7L2 expression is required for the regulation of Wnt signaling during adipogenesis. Inactivation of TCF7L2 protein by removing the high-mobility group (HMG)-box DNA binding domain in mature adipocytes in vivo leads to whole-body glucose intolerance and hepatic insulin resistance. This phenotype is associated with increased subcutaneous adipose tissue mass, adipocyte hypertrophy, and inflammation. Finally, we demonstrate that TCF7L2 mRNA expression is downregulated in humans with impaired glucose tolerance and adipocyte insulin resistance, highlighting the translational potential of these findings. In summary, our data indicate that TCF7L2 has key roles in adipose tissue development and function that may reveal, at least in part, how TCF7L2 contributes to the pathophysiology of T2DM.


Figures

Figure 1
Figure 1
A: Representative images of differentiating 3T3-L1 adipocytes at the time of induction, day 0 (D0), and at D4 and D10 after initiation of adipogenesis (scale bar = 100 µm). B and C: A representative Western blot of TCF7L2 during adipogenesis, examined using an antibody that recognizes an epitope around Leu331 and all variants of TCF7L2. The expression of the short (58 kDa) TCF7L2 protein isoform was higher than the long (78 kDa) isoform during adipogenesis. Total protein load, assessed by Ponceau-S staining, was used for normalization (n = 5 independent experiments). ***P < 0.001 vs. D0 by two-way ANOVA Holm-Šidák multiple comparison t test; †††P < 0.001 main difference between isoform expression by two-way ANOVA. D: Total Tcf7l2 mRNA quantified by quantitative real-time PCR using a TaqMan probe (assay ID: Mm00501505_m1) reached a nadir at D4 after induction of adipogenesis before recovering to baseline levels at day 8 (n = 3 independent experiments). P < 0.01 effect of time by one-way ANOVA: *P < 0.05 vs. D0 by Holm-Šidák multiple comparison t test. E: Representative images of differentiating murine ASCs at D0, D2, and D6 after initiation of adipogenesis (scale bar = 100 µm). Representative Western blot of TCF7L2 demonstrates increased TCF7L2 protein during adipogenesis. The expression of the 58 kDa TCF7L2 protein was similar to the 78 kDa protein during adipogenesis (n = 5 independent experiments). ***P < 0.001 vs. D0 by two-way ANOVA Holm-Šidák multiple comparison t test. F: TCF7L2 silencing in 3T3-L1 cells (shTCF7L2) inhibited adipogenesis. A Western blot of TCF7L2 from three replicate shTCF7L2 D0 cells is shown to demonstrate the efficiency of TCF7L2 silencing. The differentiation capacity of shTCF7L2 preadipocytes was assessed by triglyceride accumulation (n = 4 independent adipogenesis experiments). ***P < 0.001 t test vs. shSCR. Note these triglyceride data also are included in Supplementary Fig. 1 (shTCF7L2_A) for comparison with other stable shTCF7L2 clones. (A high-quality color representation of this figure is available in the online issue.)
Figure 1
Figure 1
A: Representative images of differentiating 3T3-L1 adipocytes at the time of induction, day 0 (D0), and at D4 and D10 after initiation of adipogenesis (scale bar = 100 µm). B and C: A representative Western blot of TCF7L2 during adipogenesis, examined using an antibody that recognizes an epitope around Leu331 and all variants of TCF7L2. The expression of the short (58 kDa) TCF7L2 protein isoform was higher than the long (78 kDa) isoform during adipogenesis. Total protein load, assessed by Ponceau-S staining, was used for normalization (n = 5 independent experiments). ***P < 0.001 vs. D0 by two-way ANOVA Holm-Šidák multiple comparison t test; †††P < 0.001 main difference between isoform expression by two-way ANOVA. D: Total Tcf7l2 mRNA quantified by quantitative real-time PCR using a TaqMan probe (assay ID: Mm00501505_m1) reached a nadir at D4 after induction of adipogenesis before recovering to baseline levels at day 8 (n = 3 independent experiments). P < 0.01 effect of time by one-way ANOVA: *P < 0.05 vs. D0 by Holm-Šidák multiple comparison t test. E: Representative images of differentiating murine ASCs at D0, D2, and D6 after initiation of adipogenesis (scale bar = 100 µm). Representative Western blot of TCF7L2 demonstrates increased TCF7L2 protein during adipogenesis. The expression of the 58 kDa TCF7L2 protein was similar to the 78 kDa protein during adipogenesis (n = 5 independent experiments). ***P < 0.001 vs. D0 by two-way ANOVA Holm-Šidák multiple comparison t test. F: TCF7L2 silencing in 3T3-L1 cells (shTCF7L2) inhibited adipogenesis. A Western blot of TCF7L2 from three replicate shTCF7L2 D0 cells is shown to demonstrate the efficiency of TCF7L2 silencing. The differentiation capacity of shTCF7L2 preadipocytes was assessed by triglyceride accumulation (n = 4 independent adipogenesis experiments). ***P < 0.001 t test vs. shSCR. Note these triglyceride data also are included in Supplementary Fig. 1 (shTCF7L2_A) for comparison with other stable shTCF7L2 clones. (A high-quality color representation of this figure is available in the online issue.)
Figure 2
Figure 2
Hallmark GSEA from RNA-Seq experiments performed on shSCR and shTCF7L2 3T3-L1 cells in preadipocytes at day 0 and at days 2, 4, 6, and 8 during adipogenesis. Normalized enrichment scores (NES) from GSEA across all time points. The 50 hallmark gene sets were hierarchically clustered in R software using heatmap.2 from gplots and Euclidean distance to obtain the gene set ordering and the dendrogram used in the plot. The dot color indicates the time point and dot size the statistical significance (GSEA FDR), as indicated in the figure legend. *P < 0.05; **P < 0.01; ***P < 0.001, and NS. Between the gene sets names and the plot, + and − indicate whether the gene set had an FDR <0.05 at any time point (+) or not (−).
Figure 3
Figure 3
A: The mRNA expression of Wnt genes Cttnb1, Axin2, Lef1, Myc, Wisp2, and Tle3 during adipogenesis in shTCF7L2 and shSCR control cells. B: Representative Western blot and corresponding quantification for total and active β-catenin protein during adipogenesis in shSCR and shTCF7L2 3T3-L1 cells (n = 3 independent experiments). *P < 0.05; **P < 0.01; ***P < 0.001 vs. day (D) 0 by two-way ANOVA Holm-Šidák multiple comparison t test; †P < 0.05 main effect of shTCF7L2 by two-way ANOVA. †††P < 0.001 main effect of shTCF7L2 by two-way ANOVA; ^P < 0.05; ^^P < 0.01; ^^^P < 0.001 vs. corresponding shSCR time point by two-way ANOVA time × shTCF7L2 interaction Holm-Šidák multiple comparison t test. C: Effect of IWR-1 treatment on total β-catenin levels and adipogenesis in high-passage shSCR and shTCF7L2 cells. Cells were treated with IWR-1 (10 μmol/L) every other day for 6 days during differentiation. Western blot demonstrates the effect of IWR-1 on total β-catenin protein levels at the end of adipogenesis (each lane represents a single independent adipogenesis experiment, n = 4 for each treatment). Triglycerides and the mRNA expression of Pparg, Lef1, and Axin2 were assessed by quantitative real-time PCR at the end of differentiation on D6 (n = 4 independent differentiation experiments). ***P < 0.001 vs. indicated controls by two-way ANOVA interaction Holm-Šidák multiple comparison t test.
Figure 4
Figure 4
A: Schematic shows the targeting strategy for the mouse Tcf7l2 locus used in this study. (Reprinted with permission from van Es et al. [19]) B: LoxP sites were placed around exon 11, which results in the deletion of exon 11, and not exon 6, containing mRNA transcripts, as determined by quantitative real-time PCR on isolated adipocytes (n = 7). ***P < 0.001 vs. LoxP control mice by Welch t test. The exon 11–specific quantitative real-time PCR probe/primer combination was custom designed by Integrated DNA Technologies (Coralville, IA). C: To confirm deletion of exon 11 was specific to adipocytes, semiquantitative RT-PCR was used to visualize Tcf7l2 transcripts in multiple tissues. Recombination of the Tcf7l2 locus occurred only in adipocytes and not the stromal vascular fraction (SVF) of adipose tissue. D: IPGTT results (n = 10 ΔE11-TCF7L2, n = 12 LoxP controls). ^P < 0.05; ^^^P < 0.001 vs. corresponding control time point by two-way ANOVA time × Tcf7l2 genotype interaction Holm-Šidák multiple comparison t test. E: Incremental area under the IPGTT curve (iAUC). **P < 0.01 by Welch t test. F: Plasma insulin during the IPGTT (n = 7 ΔE11-TCF7L2, n = 10 LoxP controls). ^P < 0.05 vs. corresponding control time point by two-way ANOVA time × genotype interaction Holm-Šidák multiple comparison t test. G: Glucose infusion rate. ***P < 0.001 main effect of Tcf7l2 genotype by two-way ANOVA. Basal rate of glucose Ra and Rd (H) and residual insulin-stimulated hepatic glucose production (HGP) (I) during low dose hyperinsulinemic-euglycemic insulin clamps in male 3-month-old chow-fed mice (n = 10 ΔE11-TCF7L2, n = 13 LoxP control mice for all clamp experiments). **P < 0.01 vs. LoxP control mice by Mann-Whitney test.
Figure 5
Figure 5
Cumulative weight gain (A), absolute body weight (B), final body weight (C), and cumulative food intake (D) during and after 12 weeks of the HFD (n = 14 ΔE11-TCF7L2, n = 16 LoxP controls). *P < 0.05 main effect of Tcf7l2 genotype by two-way ANOVA (B); *P < 0.05 vs. controls by t test (C). IPGTT (E) and incremental area under the IPGTT curve (iAUC) after 12 weeks of the HFD in male mice (n = 8 ΔE11-TCF7L2, n = 8 control mice) (F). ^P < 0.05; ^^^P < 0.001 vs. corresponding control time point by two-way ANOVA time × Tcf7l2 genotype interaction Holm-Šidák multiple comparison t test. **P < 0.05 vs. controls by t test. G: Liver triglyceride content was significantly elevated in ΔE11-TCF7L2 mice (n = 8 ΔE11-TCF7L2, n = 9 control mice). *P < 0.05 vs. controls by Mann-Whitney test. H: A representative hematoxylin and eosin stain demonstrates increased lipid deposition in liver in TCF7L2 mutant mice at the end of 12-week HFD (scale bar = 100 µm).
Figure 6
Figure 6
A: iWAT in male ΔE11-TCF7L2 mice at 3 and 6 months of age (n = 8–10 ΔE11-TCF7L2, n = 8–10 control mice) and iWAT and pgWAT after HFD (n = 12 ΔE11-TCF7L2, n = 14 control mice). **P < 0.01 vs. control mice by Mann-Whitney test; ***P < 0.001 vs. control by t test. Representative hematoxylin and eosin stain and adipocyte size distribution performed on 3-month (B) and 6-month (C) iWAT (scale bar = 100 µm). Average adipocyte area in 3-month-old (n = 6 ΔE11-TCF7L2, n = 7 control mice) (D) and 6-month-old mice (n = 8 ΔE11-TCF7L2, n = 8 control mice) (E) was calculated using Adiposoft. **P < 0.01 vs. control by Welch t test. F: Total number of adipocytes counted in an equal number of histological sections in 6-month-old mice. **P < 0.01 vs. control by t test. G: Correlation between iWAT weight and adipocyte area in 6-month-old mice.
Figure 7
Figure 7
Plasma glucose (A) and insulin (B) during an oral GTT in human subjects with NGT (n = 21) or IGT (n = 22). ^^P < 0.05; ^^^P < 0.001 vs. corresponding NGT time point by two-way ANOVA time × NGT/IGT phenotype interaction Holm-Šidák multiple comparison t test. C: BMI was similar between the two groups. D: Adipo-IR was higher in IGT subjects. *P < 0.05 vs. NGT by t test. Subcutaneous adipose tissue total TCF7L2 mRNA (exon 10-11; assay ID: Hs01009038_m1) (E) and a short TCF7L2 mRNA variant incorporating exons 12 and 13 (F) were lower in IGT subjects with Adipo-IR. *P < 0.05 Welch t test vs. NGT.

References

    1. Voight BF, Scott LJ, Steinthorsdottir V, et al. .; MAGIC investigators; GIANT Consortium . Twelve type 2 diabetes susceptibility loci identified through large-scale association analysis. Nat Genet 2010;42:579–589 - PMC - PubMed
    1. Jin T. Current understanding on role of the Wnt signaling pathway effector TCF7L2 in glucose homeostasis. Endocr Rev 2016;37:254–277 - PubMed
    1. Nobrega MA. TCF7L2 and glucose metabolism: time to look beyond the pancreas. Diabetes 2013;62:706–708 - PMC - PubMed
    1. Ross SE, Hemati N, Longo KA, et al. . Inhibition of adipogenesis by Wnt signaling. Science 2000;289:950–953 - PubMed
    1. Bennett CN, Ross SE, Longo KA, et al. . Regulation of Wnt signaling during adipogenesis. J Biol Chem 2002;277:30998–31004 - PubMed

Publication types

MeSH terms