. 2018 Jan 10;8(1):3.
doi: 10.1038/s41398-017-0060-z.

Altered avalanche dynamics in a developmental NMDAR hypofunction model of cognitive impairment

Affiliations

Altered avalanche dynamics in a developmental NMDAR hypofunction model of cognitive impairment

Saurav Seshadri et al. Transl Psychiatry. .

Abstract

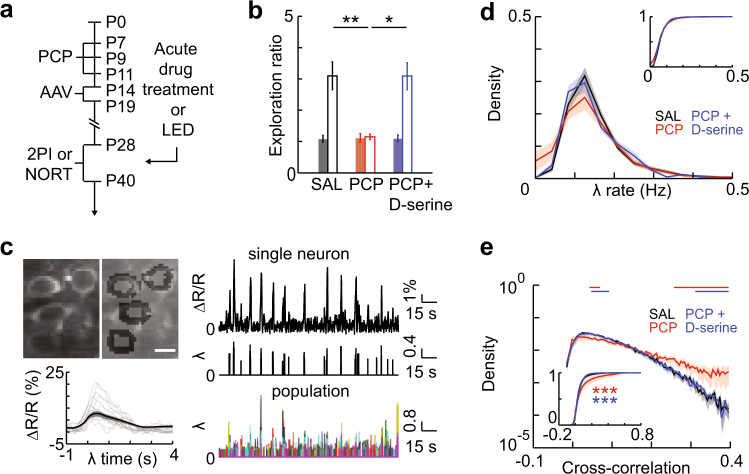
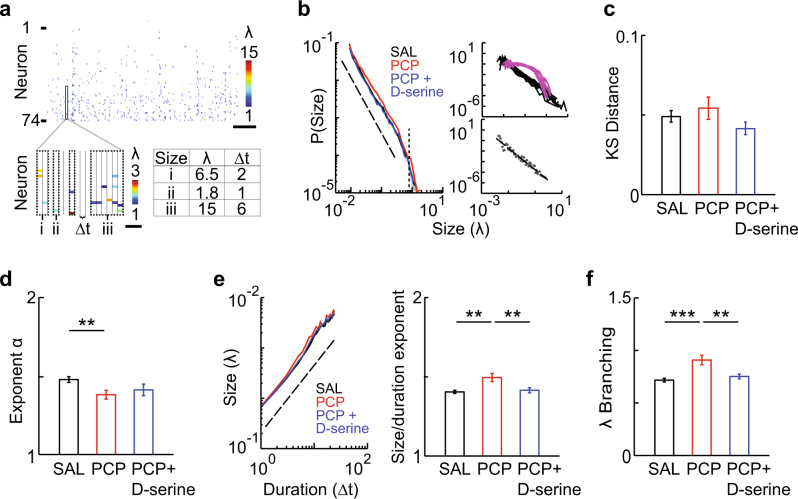
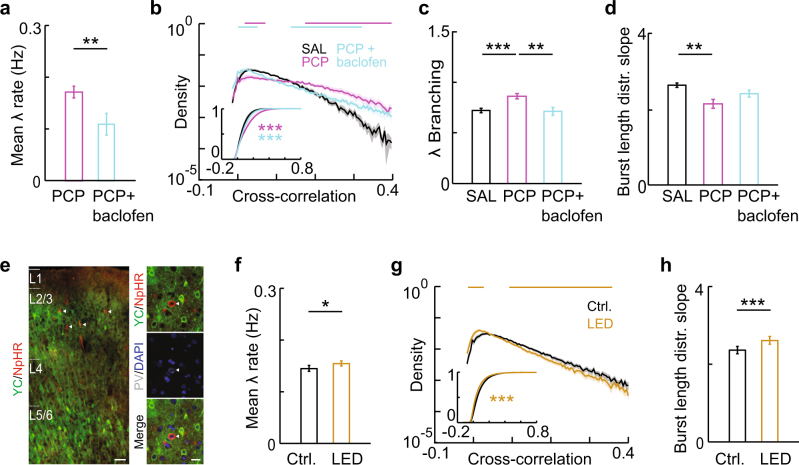
Disturbed activity patterns in cortical networks contribute to the pathophysiology of schizophrenia (SZ). Several lines of evidence implicate NMDA receptor hypofunction in SZ, and blocking NMDA receptor signaling during early neurodevelopment produces cognitive deficits in rodent models that resemble those seen in schizophrenic patients. However, the altered network dynamics underlying these cognitive impairments largely remain to be characterized, especially at the cellular level. Here, we use in vivo two-photon calcium imaging to describe pathological dynamics, occurring in parallel with cognitive dysfunction, in a developmental NMDA receptor hypofunction model. We observed increased synchrony and specific alterations in spatiotemporal activity propagation, which could be causally linked to a previously unidentified persistent bursting phenotype. This phenotype was rescued by acute treatment with the NMDA receptor co-agonist D-serine or the GABAB receptor agonist baclofen, which similarly rescued working memory performance. It was not reproduced by optogenetic inhibition of fast-spiking interneurons. These results provide novel insight into network-level abnormalities mediating the cognitive impairment induced by NMDA receptor hypofunction.


Conflict of interest statement

DP holds patent US8548786 B2 “Neuronal avalanche assay”, which covers the clinical use of neuronal avalanches in humans. The authors declare that they have no competing financial interests.

Figures

Fig. 1
Fig. 1
Neonatal PCP-treated rats show working memory deficits and increased pairwise cross-correlation, both rescued by D-serine. a Timeline of experimental procedures. b PCP treatment impairs novelty preference in the NORT, which is rescued by D-serine. Closed bars, familiar object exploration ratio during habituation, open bars, novel object exploration ratio. c Top left, representative neuronal image and segmentation, scale bar = 10 µm. Bottom left, event-centered normalized fluorescence profile; black line, average for all events in a representative movie, grey lines, example traces. Right, representative fluorescent intensity time series and thresholded spike rate estimates (λ) for a single neuron and for all neurons in a local population. d Firing rates are not altered by PCP treatment. Distributions of λ rates for each group. Distributions were plotted for each movie per group then averaged. Inset, mean CDFs. e PCP treatment shifts pairwise cross-correlation to higher values; D-serine rescues this effect. Distributions of pairwise cross-correlations for each group. Distributions were plotted for each movie per group then averaged. Bars show bins with significant group differences (Wilcoxon’s rank sum test, P < 0.05; red, SAL vs. PCP, blue, PCP vs. PCP + D-serine). Inset, mean CDFs. Error bars and shaded regions indicate s.e.m; *, P < 0.05, **, P < 0.01
Fig. 2
Fig. 2
Neonatal PCP-treated rats exhibit a unique set of alterations in neuronal avalanche dynamics. a Spatiotemporal organization of ongoing activity. Top, raster plot of activity in a representative recording. Bottom left, expansion of boxed area showing clustering of activity (dotted lines). Bottom right, sizes and durations of example clusters. b Left, probability distributions of cluster sizes for each group. Distributions were plotted for each movie per group then averaged. Dotted line, power law with exponent = −1.5, dashed line, expected cutoff in size. Top right, distributions for original (black lines) and shuffled (pink lines) SAL activity rasters. Bottom right, representative binning and power law fitting. c PCP treatment does not produce a deviation from a power law distribution. KS distance, a statistical measure for deviation from power law distribution, for different treatment groups. d PCP-treated rats have shallower distributions of avalanche sizes. Power law exponents for different treatment groups. e PCP treatment results in faster avalanche expansion. Left, scaling of cluster size and duration for each group. Dotted line, power law with exponent = 2 as predicted from critical theory. Right, scaling exponents for different treatment groups. f Branching parameter for different treatment groups. Error bars and shaded regions (not always visible) indicate s.e.m; *, P < 0.05, **, P < 0.01, ***, P < 0.005
Fig. 3
Fig. 3
Persistent bursting in neonatal PCP-treated rats underlies abnormal spatiotemporal activity propagation. a PCP treatment increases spatial activity propagation specifically by increasing repeat (rather than new) neuronal activations. Branching parameter measured in number of neurons (total, new, and repeat) for different treatment groups. b Schematic representation of spatiotemporal activity propagation in SAL vs. PCP treated rats. Empty triangles represent quiescent neurons; filled triangles, active neurons; arrows, activity propagation. The black cascade shows a representative pattern of feedforward activity; in PCP treated rats, aberrant repeat activity (red triangles) caused by persistent bursting is superimposed on this cascade. c PCP-treated rats show shallower distributions in burst lengths. Left, distributions of burst lengths for different treatment groups. Distributions were plotted after pooling all bursts per movie, then averaged. Right, slope exponents for burst length distributions for different treatment groups. d PCP treatment leads to more persistent bursts of activity. Fraction of bursts with length greater than one frame for different treatment groups. e Removing persistent bursts rescues the PCP-induced increase in pairwise cross-correlation. Complementary cumulative distributions of pairwise cross-correlations for SAL, PCP, and PCP with repeat activations removed. Distributions were plotted for each movie per group then averaged. f KS distance, power law exponent, and branching parameter for PCP, and PCP with repeat activations removed. Error bars indicate s.e.m; *, P < 0.05, **, P < 0.01, ***, P < 0.001
Fig. 4
Fig. 4
Neonatal PCP treatment-induced changes in avalanche dynamics are rescued by enhancing GABAergic signaling, but not reproduced by inhibiting PVins. a Baclofen inhibts network activity. Mean λ rates for each group. b Baclofen rescues the PCP-induced increase in pairwise cross-correlation. Distributions of pairwise cross-correlations for each group. Distributions were plotted for each movie per group then averaged. Bars show bins with significant group differences (Wilcoxon’s rank sum test, P < 0.05; magenta, SAL vs. PCP, cyan, PCP vs. PCP + baclofen). Inset, mean CDFs. c Branching parameter for different treatment groups. d Baclofen rescues PCP-induced persistent bursting. Slope exponents for burst length distributions for different treatment groups. e YC2.60, NpHR3.0, and PV labeling in AAV-injected PV-Cre rats. Scale bar, left, 100 µm. right, 20 µm. f PVin inhibition increases network activity. Mean λ rates from movies of identical regions without (Ctrl.) and with LED stimulation. g PVin inhibition decreases pairwise cross-correlations. Distributions of pairwise cross-correlations for both stimulation groups. Distributions were plotted for each movie per group then averaged. Bars show bins with significant group differences (Wilcoxon’s rank sum test, P < 0.05). h PVin inhibition produces steeper distributions in burst lengths. Slope exponents for burst length distributions for both stimulation groups. Error bars and shaded regions indicate s.e.m; *, P < 0.05

References

    1. Harrison P. J., Weinberger D. R. Schizophrenia genes, gene expression, and neuropathology: on the matter of their convergence. Mol Psychiatr. 2005;10:40-68; image 5. - PubMed
    1. Owen MJ, Sawa A, Mortensen PB. Schizophrenia. Lancet. 2016;388:86–97. doi: 10.1016/S0140-6736(15)01121-6. - DOI - PMC - PubMed
    1. Javitt DC, Zukin SR, Heresco-Levy U, Umbricht D. Has an angel shown the way? Etiological and therapeutic implications of the PCP/NMDA model of schizophrenia. Schizophr. Bull. 2012;38:958–966. doi: 10.1093/schbul/sbs069. - DOI - PMC - PubMed
    1. Hall J, Trent S, Thomas KL, O’Donovan MC, Owen MJ. Genetic risk for schizophrenia: convergence on synaptic pathways involved in plasticity. Biol. Psychiatr. 2015;77:52–58. doi: 10.1016/j.biopsych.2014.07.011. - DOI - PubMed
    1. Billingslea EN, et al. Parvalbumin cell ablation of NMDA-R1 causes increased resting network excitability with associated social and self-care deficits. Neuropsychopharmacology. 2014;39:1603–1613. doi: 10.1038/npp.2014.7. - DOI - PMC - PubMed

Publication types

MeSH terms

Substances