. 2018 Jan 9;9(1):113.
doi: 10.1038/s41467-017-02488-y.

GLP-1 release and vagal afferent activation mediate the beneficial metabolic and chronotherapeutic effects of D-allulose

Affiliations

GLP-1 release and vagal afferent activation mediate the beneficial metabolic and chronotherapeutic effects of D-allulose

Yusaku Iwasaki et al. Nat Commun. .

Abstract

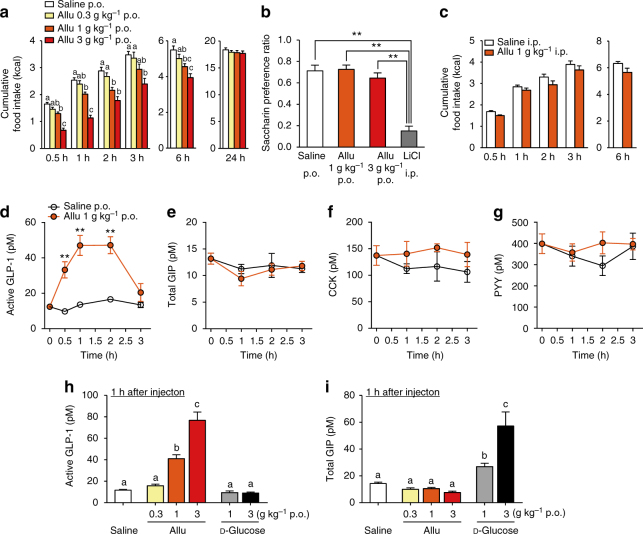
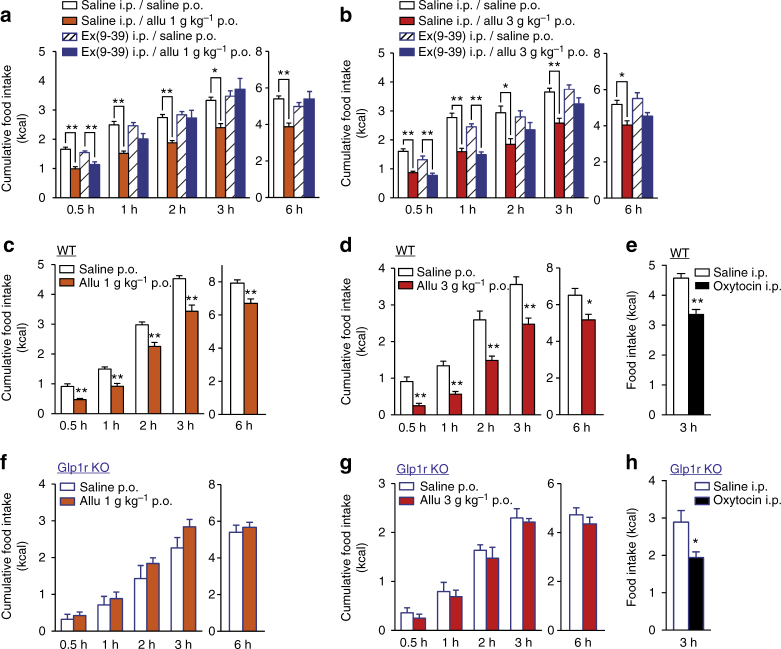
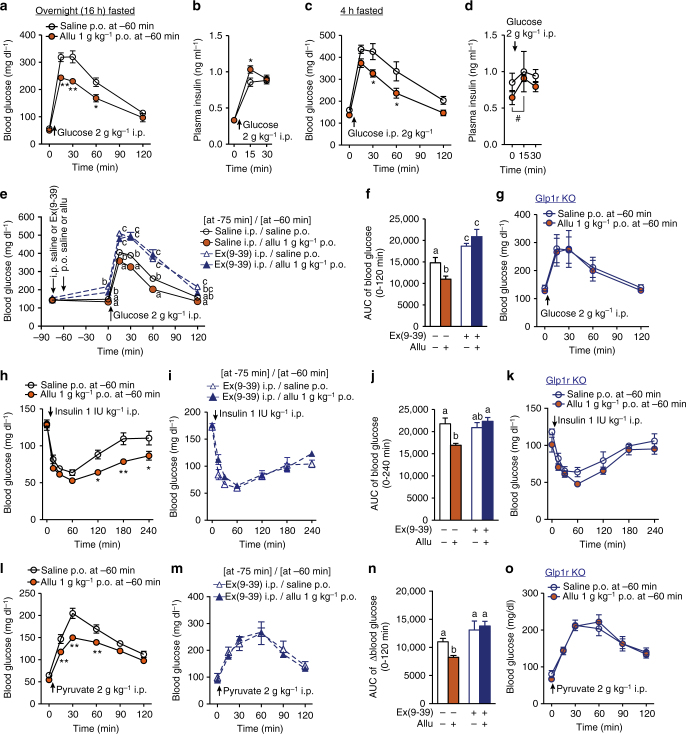
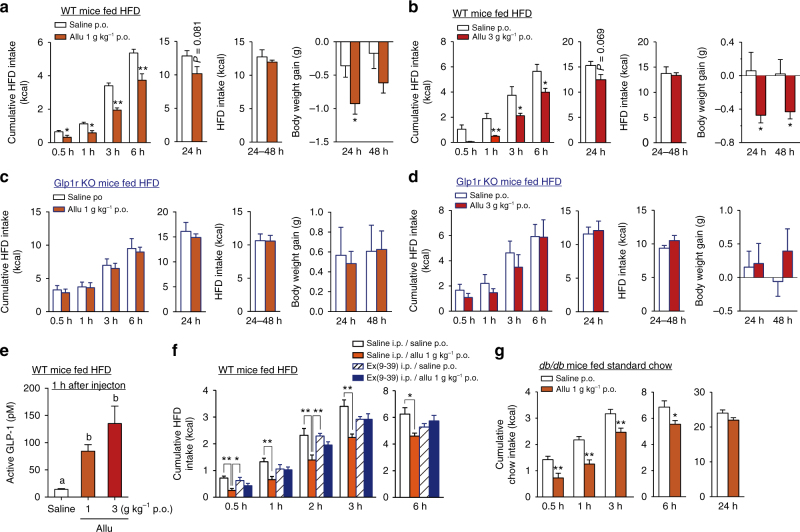
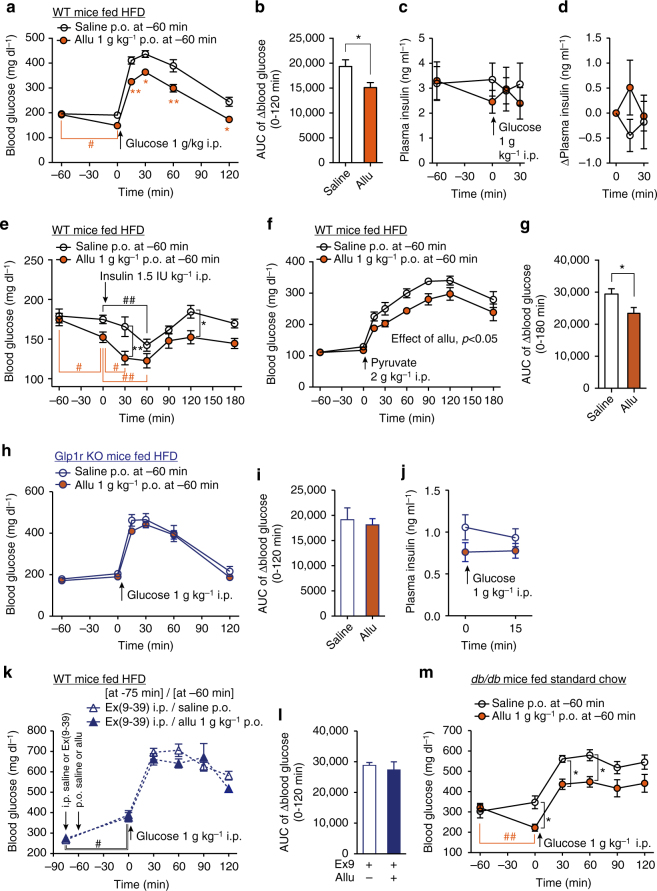
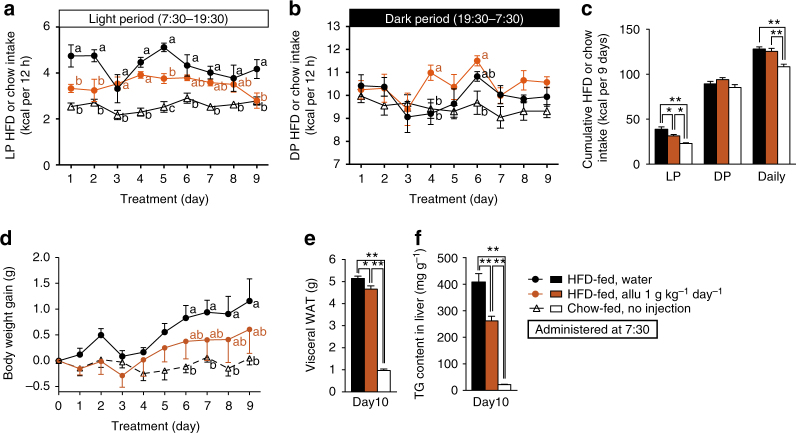
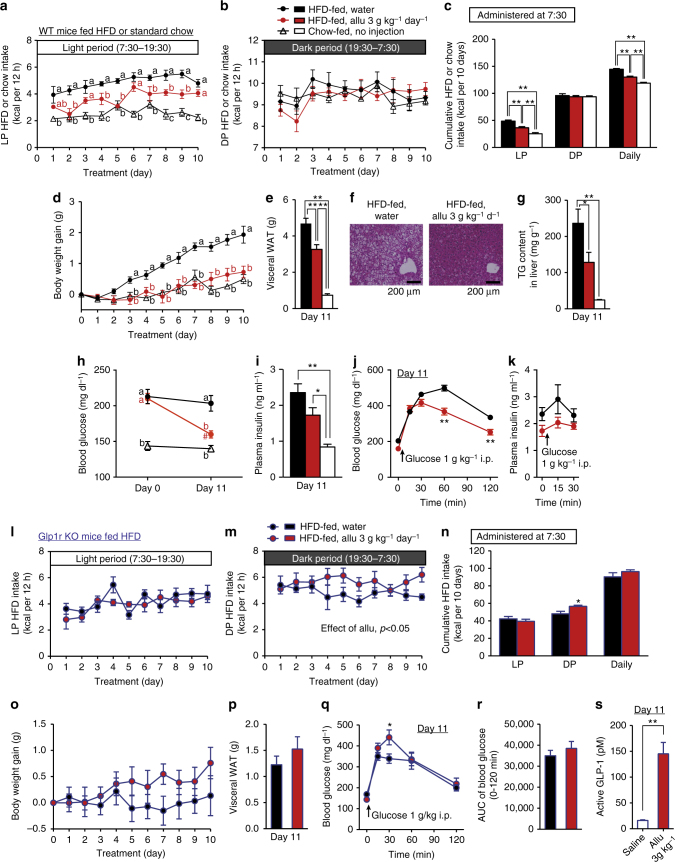
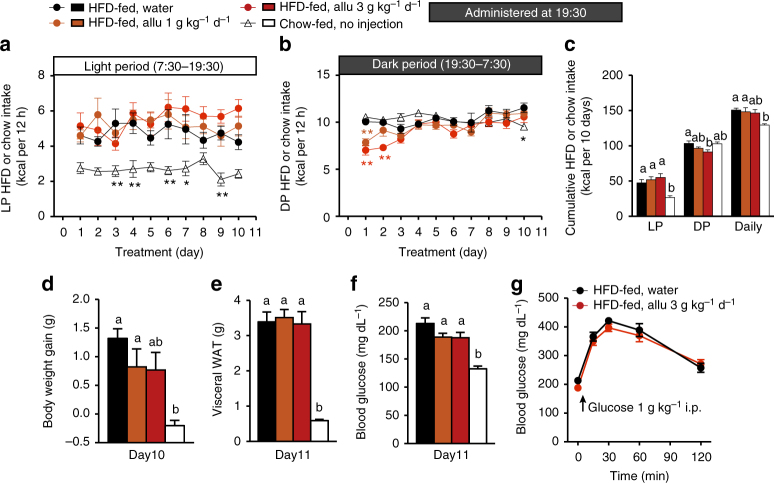
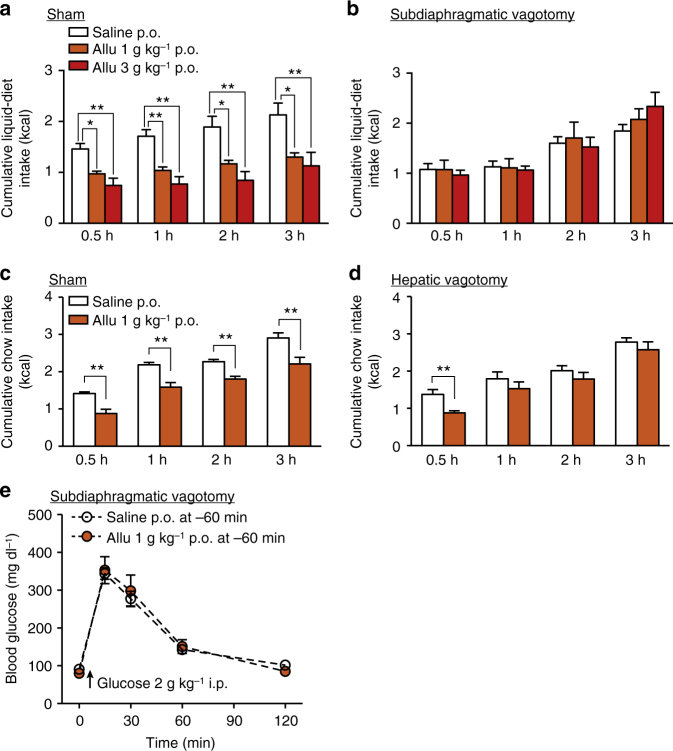
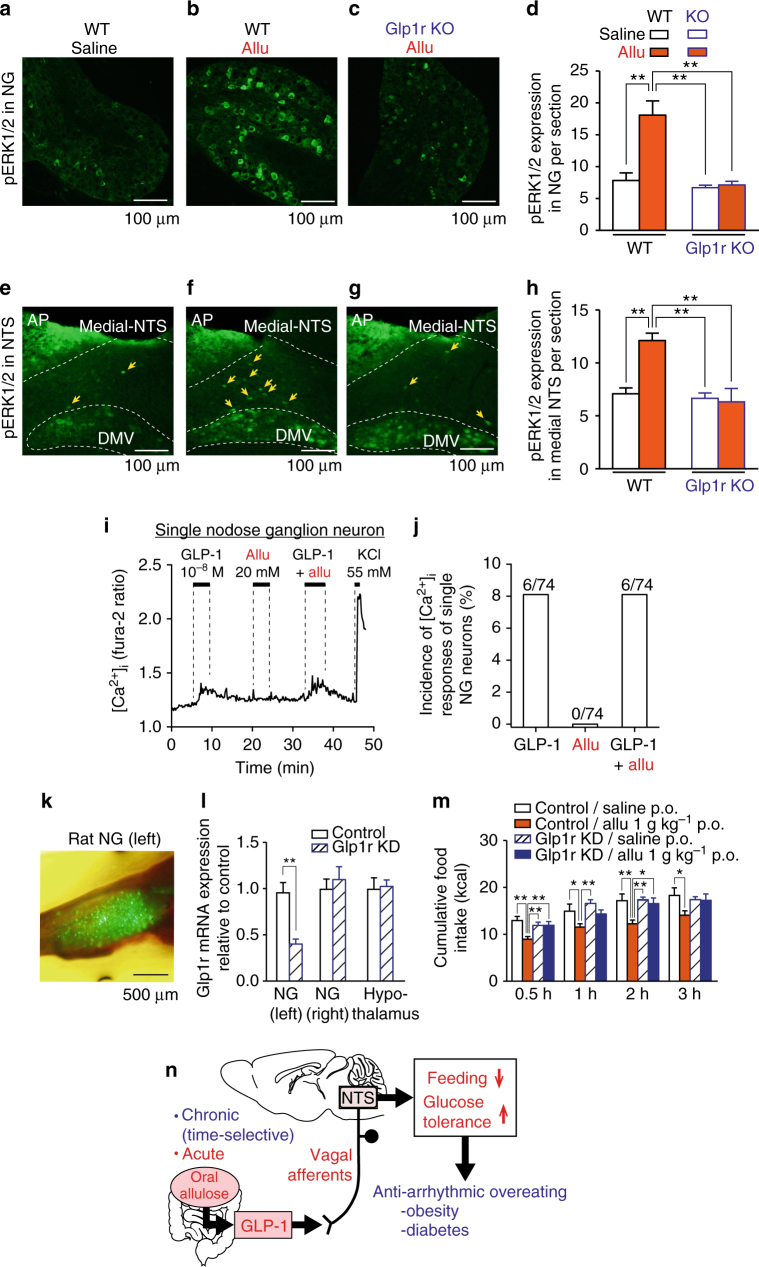
Overeating and arrhythmic feeding promote obesity and diabetes. Glucagon-like peptide-1 receptor (GLP-1R) agonists are effective anti-obesity drugs but their use is limited by side effects. Here we show that oral administration of the non-calorie sweetener, rare sugar D-allulose (D-psicose), induces GLP-1 release, activates vagal afferent signaling, reduces food intake and promotes glucose tolerance in healthy and obese-diabetic animal models. Subchronic D-allulose administered at the light period (LP) onset ameliorates LP-specific hyperphagia, visceral obesity, and glucose intolerance. These effects are blunted by vagotomy or pharmacological GLP-1R blockade, and by genetic inactivation of GLP-1R signaling in whole body or selectively in vagal afferents. Our results identify D-allulose as prominent GLP-1 releaser that acts via vagal afferents to restrict feeding and hyperglycemia. Furthermore, when administered in a time-specific manner, chronic D-allulose corrects arrhythmic overeating, obesity and diabetes, suggesting that chronotherapeutic modulation of vagal afferent GLP-1R signaling may aid in treating metabolic disorders.


Conflict of interest statement

T.Y. and H.H. have received grant support from Matsutani Chemical Industry Co. Ltd. Matsutani Chemical Industry Co. Ltd. only provided d-allulose but was not involved in the conduction of current study including planning and performing the experiments, making figures, statistical analysis, manuscript preparation and review. The remaining authors declare no competing financial interests.

Figures

Fig. 1
Fig. 1
Peroral d-allulose suppresses food intake and releases GLP-1 in normal mice. a Cumulative food intake at 0.5–24 h after p.o. administration of 0.3, 1, and 3 g kg−1 d-allulose (Allu) in C57BL/6J mice fasted overnight (16 h). n = 10. Different letters indicate p < 0.05 by one-way ANOVA followed by Tukey’s test in each time. b In conditioned taste aversion test, saccharin preference was measured at 2 days after injection of saline, Allu, or lithium chloride (LiCl; 3 mmol kg−1). n = 5–8. **p < 0.01 by one-way ANOVA followed by Tukey’s test. c Cumulative food intake after intraperitoneal (i.p.) injection of 1 g kg−1 Allu. n = 8. dg Time course of active GLP-1 (d), total GIP (e), CCK (f), and PYY (g) concentrations in portal vein plasma after 1 g kg−1 Allu or saline p.o. injection. n = 5–9. **p < 0.01 by two-way ANOVA followed by Bonferroni’s test vs. saline. h, i Active GLP-1 (h) and total GIP (i) concentrations in portal vein at 1 h after p.o. administration of increasing concentrations of Allu or d-glucose. n = 5–15. Different letters indicate p < 0.05 by one-way ANOVA followed by Tukey’s test. Error bars are SEM
Fig. 2
Fig. 2
GLP-1 receptor is essential for d-allulose-induced anorexigenic effect. a, b p.o. Allu at 1 g kg−1 (a) and 3 g kg−1 (b) at 10:00 suppressed cumulative food intake at 0.5–6 h after administration in C57BL/6J mice fasted overnight. These anorexigenic effects were attenuated by 200 nmol kg−1 Ex(9-39), GLP-1 receptor (GLP-1R) antagonist. n = 5–9. *p < 0.05 and **p < 0.01 by one-way ANOVA followed by Tukey’s test. ch Cumulative food intake at 0.5–6 h after p.o. injection of 1 and 3 g kg−1 Allu and i.p. injection of 400 nmol kg−1 oxytocin at 19:30 in wild-type (WT) C57BL/6J mice (ce) and Glp1r KO mice (fh) fasted 3 h. n = 5–8. *p < 0.05 and **p < 0.01 by unpaired t-test. Error bars are SEM
Fig. 3
Fig. 3
d-Allulose improves glucose tolerance via GLP-1R signaling. Allu at 1 g kg−1 was p.o. administered at 60 min prior to ipGTT (2 g kg−1), ag, insulin tolerance test (ITT, 1 IU kg−1, hk) and pyruvate tolerance test (PTT, 2 g kg−1, l-o). Ex(9-39) at 200 nmol kg−1 was i.p. injected at 75 min prior to ipGTT (e, f), ITT (i, j), and PTT (m, n). ad Effect of p.o. Allu on blood glucose and plasma insulin levels in ipGTT in C57BL/6J mice fasted overnight (16 h, a, b) and for 4 h (c, d). n = 5. e, f Ex(9-39) treatment blunted the action of Allu to attenuate rises of blood glucose (e) and its area under the curve (AUC, f) in ipGTT in C57BL/6J mice fasted 4 h. n = 7–8. g p.o. Allu failed to improve glucose tolerance in Glp1r KO mice fasted for 4 h (n = 6). hk Allu potentiated insulin action to lower blood glucose (h) and its AUC (j) in ITT, and these effects were abolished in the presence of Ex(9-39) in C57BL/6J mice fasted 4 h (i, j) and in Glp1r KO mice (k). n = 5–11. lo Allu suppressed blood glucose elevation (l) and its AUC (n) in PTT, and these effects were completely blocked in the presence of Ex(9-39) in C57BL/6J mice fasted overnight (m, n) and in Glp1r KO mice fasted overnight (o). n = 5–6. Different letters indicate p < 0.05 by two-way ANOVA followed by Tukey’s test (e), and *p < 0.05, **p < 0.01 by two-way ANOVA followed by Bonferroni’s test vs. saline group (ac, h, l). In d, #p < 0.05 by repeated measures ANOVA followed by Dunnett’s test vs. 0 min in Allu group. In f, j, n, different letters indicate p < 0.05 by one-way ANOVA followed by Tukey’s test. Error bars are SEM
Fig. 4
Fig. 4
p.o. d-Allulose suppresses food intake in HFD-fed obese and diabetic db/db mice. ad Cumulative HFD intake at 0.5, 1, 3, 6, and 24 h and for 24–48 h and body weight gain after p.o. administration of Allu (1 and 3 g kg−1) at 19:30 in HFD-fed obese C57BL/6J (wild-type, WT) fasted for 3 h (a, b) and HFD-fed Glp1r KO mice fasted for 3 h (c, d). n = 5–6. e Active GLP-1 level in portal vein 1 h after p.o. Allu in HFD-fed C57BL/6J mice fasted overnight. n = 5–6. f Treatment with 600 nmol kg−1 Ex(9-39) attenuated the effect of p.o. Allu to reduce HFD intake in HFD-fed obese mice. n = 6. g Cumulative standard chow intake after p.o. Allu injected at 10:00 in db/db mice fasted overnight. n = 9–10. In a, b, g, *p < 0.05 and **p < 0.01 by unpaired t-test in each time. In e, different letters indicate p < 0.05 and *p < 0.05, **p < 0.01 by one-way ANOVA followed by Tukey’s test. Error bars are SEM
Fig. 5
Fig. 5
d-Allulose improves glucose tolerance via GLP-1R in obese and diabetic mice. Allu at 1 g kg−1 or saline was p.o. administered at 60 min prior to ipGTT (1 g kg−1, ad, hm), ITT (1.5 IU kg−1, e), and PTT (2 g kg−1, f, g) in HFD-fed obese C57BL/6J mice (WT), HFD-fed Glp1r KO mice or standard chow-fed diabetic db/db mice. ad Blood glucose (a) and plasma insulin levels (c) after p.o. injection of Allu at −60 min and during ipGTT in HFD-fed obese and hyperglycemic C57BL/6J mice fasted for 4 h. b AUC for rise of blood glucose during 0–120 min. d Change of plasma insulin levels after ipGTT plotted from c. n = 6–10. e Blood glucose levels after p.o. Allu at −60 min and during ITT in HFD-fed mice fasted for 4 h. n = 6–7. f, g Blood glucose level and its AUC during 0–180 min in PTT in HFD-fed mice fasted overnight. n = 6–7. hj In HFD-fed Glp1r KO mice fasted 4 h, blood glucose level (h) and its AUC (i) and plasma insulin levels (j) after p.o. administration of Allu and during ipGTT. n = 6. k, i Effect of 600 nmol kg−1 Ex(9-39) administered at −75 min on blood glucose level (k) and its AUC (i) in GTT in HFD-fed C57BL/6J mice fasted 4 h. m Blood glucose levels after p.o. Allu at −60 min and during ipGTT in db/db mice fasted for 4 h. n = 5. In a, e, m, *p < 0.05, **p < 0.01 by two-way ANOVA followed by Bonferroni’s test vs. saline group. In a, e, k, m, #p < 0.05, ##p < 0.01 by two-way ANOVA followed by Dunnett’s test vs. 0 min in each group. In f, effect of Allu treatment was significant with p < 0.05 by two-way ANOVA. *p < 0.05 by unpaired t-test (b, g). Error bars are SEM
Fig. 6
Fig. 6
Chronotherapeutic effects of d-allulose (1 g kg−1 day−1) on hyperphagic obesity in HFD-fed mice. Subchronic treatment for 9 days of HFD-fed obese C57BL/6J mice with 1 g kg−1 day−1 p.o. Allu once daily at LP 7:30. ac HFD-fed mice (HFD-fed), compared to C57BL/6J lean mice fed standard chow (Chow-fed), exhibited LP-selective hyperphagia accompanied by daily hyperphagia. Subchronic administration of Allu significantly suppressed LP (a, c), but not DP (b, c), and daily food intake (c), tended to attenuate body weight gain (d), and significantly decreased visceral WAT weight (e) and triacylglycerol content in liver (f). Visceral WAT weight was the sum of mesenteric, perirenal, and epididymal WAT. n = 5–6. In a, b, d, different letters p < 0.05 by two-way ANOVA followed by Tukey’s test. In c, e, f, *p < 0.05, and **p < 0.01 by one-way ANOVA followed by Tukey’s test. Error bars are SEM
Fig. 7
Fig. 7
Chronotherapeutic effects of d-allulose (3 g kg−1 day−1) on hyperphagic obesity in HFD-fed mice. ak HFD-fed obese C57BL/6J mice (HFD-fed) were subchronically treated for 10 days with p.o. Allu (3 g kg−1 day−1) or water once daily at LP 7:30. C57BL/6J lean mice fed standard chow (Chow-fed) were the lean control. Allu, compared to water, markedly attenuated increases in LP and daily HFD intake (ac) and body weight gain (d). Subchronic Allu treatment ameliorated increased visceral WAT weight (e), hepatic steatosis (f), and elevated triacylglycerol content in liver (g) on Day 11. Scale bar, 200 µm. Allu treatment significantly ameliorated elevated basal blood glucose (h) with trend to attenuate hyperinsulinemia on Day 11 (i). In ipGTT at Day 11, rises in blood glucose at 60 and 120 min were markedly suppressed (j), and basal (0 min) and elevated plasma insulin levels at 15 and 30 min tended to decrease (k). ls In HFD-fed Glp1r KO mice, the same subchronic Allu treatment did not alter LP HFD intake (l, n), slightly elevated DP HFD intake at Day 4 and later (m, n), and failed to significantly change body weight gain (o), visceral WAT weight on Day 11 (p), and blood glucose level (q) and its AUC (r) in ipGTT on Day 11 except an increase of blood glucose level at 30 min in ipGTT (q). Before sacrificing these Glp1r KO mice, portal vein was sampled 60 min after p.o. Allu (3 g kg−1) or saline and active GLP-1 was determined (s). n = 5–6. Different letters p < 0.05 and **p < 0.01 by two-way ANOVA followed by Tukey’s test (a, d, h) or Bonferroni’s test (j, q). #p < 0.01 by two-way ANOVA followed by Bonferroni’s test vs. Day 0 (h). In m, effect of Allu treatment was significant with p < 0.05 by two-way ANOVA. *p < 0.05, and **p < 0.01 by one-way ANOVA followed by Tukey’s test (c, e, g, i). *p < 0.05, and **p < 0.01 by unpaired t-test vs. saline group (n, s). Error bars are SEM
Fig. 8
Fig. 8
DP d-allulose administration fails to ameliorate LP-hyperphagia, obesity and glucose intolerance. Effects of subchronic p.o. administration of Allu (1 or 3 g kg−1) once daily at DP onset (19:30) for 10 days in HFD-fed obese mice (HFD-fed). Lean C57BL/6J fed standard chow (Chow-fed) without administration was the control for hyperphagic obesity. Time course of LP (a) and DP HFD intake (b), and cumulative HFD intake for 10 days (c). Body weight gain (d), visceral white adipose tissue (WAT) (e), and basal blood glucose level (f) in mice fasted 4 h at Day 10. Visceral WAT included mesenteric, perirenal and epididymal fat (g). n = 6–7. The blood glucose following i.p. injection of glucose in HFD-fed mice treated with water and 3 g kg−1 day−1 Allu (g). *p < 0.05 and **p < 0.01 by two-way ANOVA followed by Tukey’s test vs. HFD-fed, water group (a, b). Different letters indicate p < 0.05 by one-way ANOVA followed by Tukey’s test (cf). Error bars are SEM
Fig. 9
Fig. 9
Subdiaphragmatic and hepatic vagotomy counteract metabolic actions of d-allulose. a, b Allu (1 and 3 g kg−1, p.o.) reduced food intake in sham-operated (a, n = 6–7) but not subdiaphragmatic vagotomized C57BL/6J mice (b, n = 6–12) fasted overnight (16 h). *p < 0.05 and **p < 0.01 by one-way ANOVA followed by Tukey’s test. c, d Anorexigenic effect of Allu (1 g kg−1, p.o.) in sham-operated mice fasted overnight (c, n = 10–11) was blunted in hepatic vagotomized mice (d, n = 6) for 1–3 h, but not 0.5 h, after injection. *p < 0.05 and **p < 0.01 by unpaired t-test. e Allu (1 g kg−1, p.o.) failed to improve glucose tolerance in subdiaphragmatic vagotomized mice fasted for 4 h (n = 6). Error bars are SEM
Fig. 10
Fig. 10
p.o. d-Allulose activates vagal afferents and NTS via GLP-1R. ah Allu (1 g kg−1, p.o.), compared to saline, induced ERK1/2 phosphorylation in vagal afferent nodose ganglion (NG) (ad) and medial NTS (eh) in WT mice (n = 5) but not Glp1r KO mice (n = 6). Scale bar, 100 µm. i, j GLP-1 at 10−8 M increased [Ca2+]i in 6 of 74 (8.1%) single neurons isolated from nodose ganglion. Allu at 20 mM neither induced [Ca2+]i nor potentiated GLP-1-induced [Ca2+]i increases in nodose ganglion neurons. The trace in i was representative of six neurons. km Vagal afferent-specific Glp1r knockdown (KD) attenuated the anorexigenic effect of Allu (1 g kg−1, p.o.) in rats. Visualization of ZsGreen1 expression in the whole left NG of a rat injected with AAV9-Glp1r-shRNA particles (k). Relative expression of GLP-1 mRNA in the left NG (AAV injected), right NG (not injected) and hypothalamus in control and Glp1r KD rats (l). The cumulative food intake after Allu (1 g kg−1, p.o.) or saline administration in control and Glp1r KD rats fasted 16 h (m). n = 11. *p < 0.05 and **p < 0.01 by one-way ANOVA followed by Tukey’s test. Scale bar, 500 µm. n Proposed mechanism for the action of oral Allu. Acute Allu suppresses feeding and improves glucose tolerance via GLP-1-mediated vagal afferent pathway. When time-selectively administered, chronic d-allulose corrects arrhythmic overeating, obesity and diabetes, suggesting chronotherapeutic potential to enhance GLP-1R signaling to treat metabolic disorders. Error bars are SEM

References

    1. World Health Organization. Obesity and Overweight: Fact Sheet N311. http://www.who.int/mediacentre/factsheets/fs311/en/ (October, 2017)
    1. Kelly T, Yang W, Chen CS, Reynolds K, He J. Global burden of obesity in 2005 and projections to 2030. Int. J. Obes. 2008;32:1431–1437. doi: 10.1038/ijo.2008.102. - DOI - PubMed
    1. Hatori M, et al. Time-restricted feeding without reducing caloric intake prevents metabolic diseases in mice fed a high-fat diet. Cell Metab. 2012;15:848–860. doi: 10.1016/j.cmet.2012.04.019. - DOI - PMC - PubMed
    1. Mistlberger RE, Lukman H, Nadeau BG. Circadian rhythms in the Zucker obese rat: assessment and intervention. Appetite. 1998;30:255–267. doi: 10.1006/appe.1997.0134. - DOI - PubMed
    1. Campbell JE, Drucker DJ. Pharmacology, physiology, and mechanisms of incretin hormone action. Cell Metab. 2013;17:819–837. doi: 10.1016/j.cmet.2013.04.008. - DOI - PubMed

Publication types