. 2018 Jan 9;9(1):116.
doi: 10.1038/s41467-017-02428-w.

Punctuated evolution of canonical genomic aberrations in uveal melanoma

Affiliations

Punctuated evolution of canonical genomic aberrations in uveal melanoma

Matthew G Field et al. Nat Commun. .

Abstract

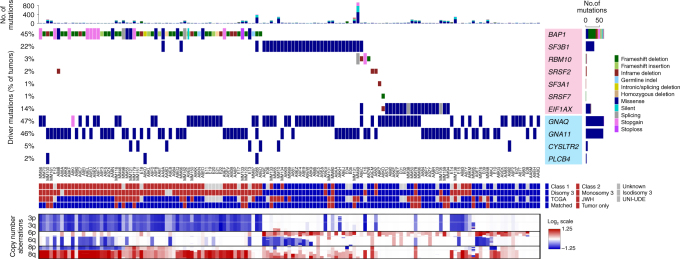
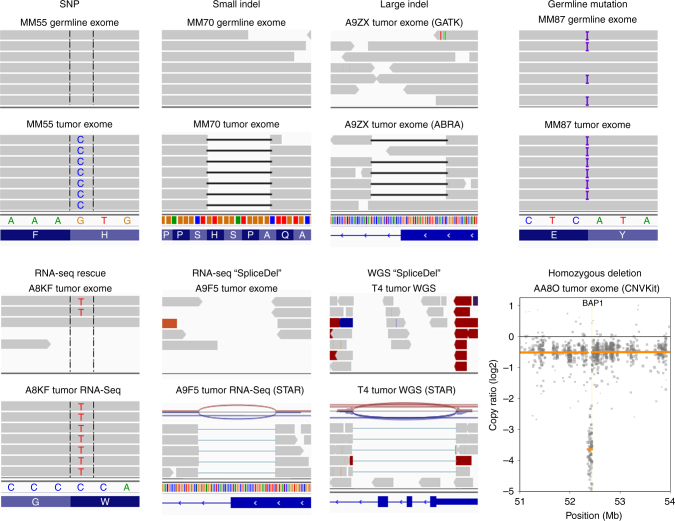
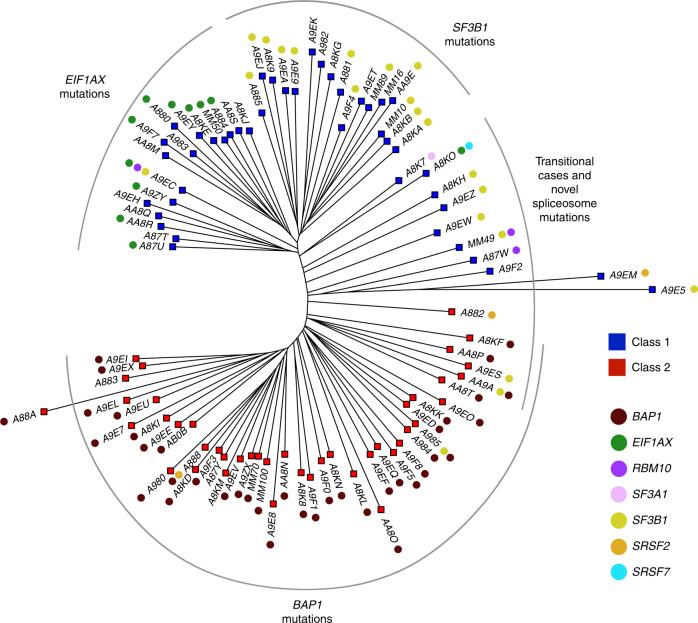
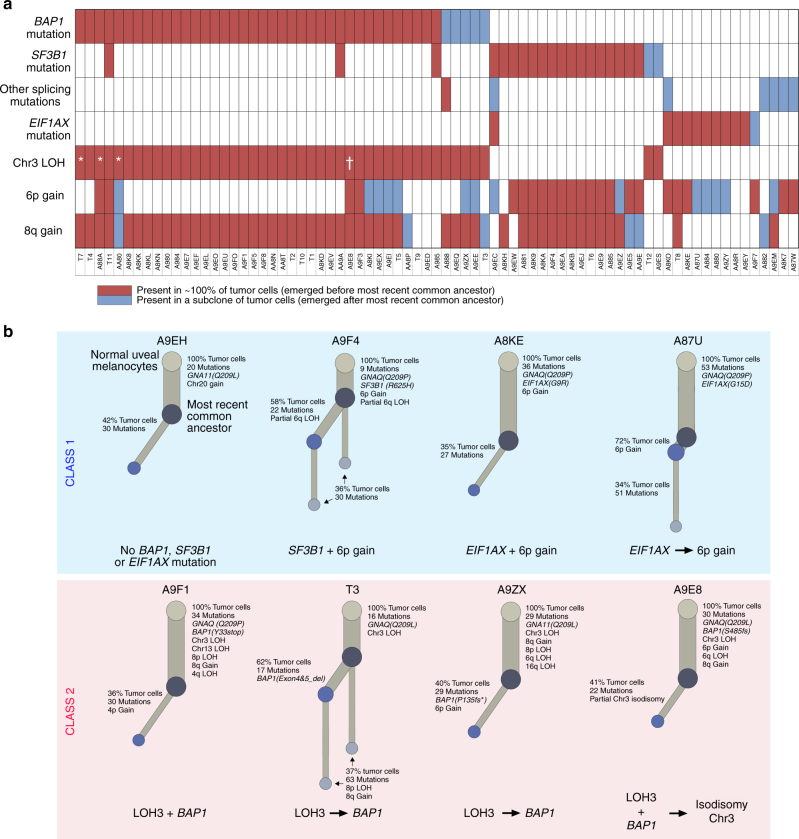
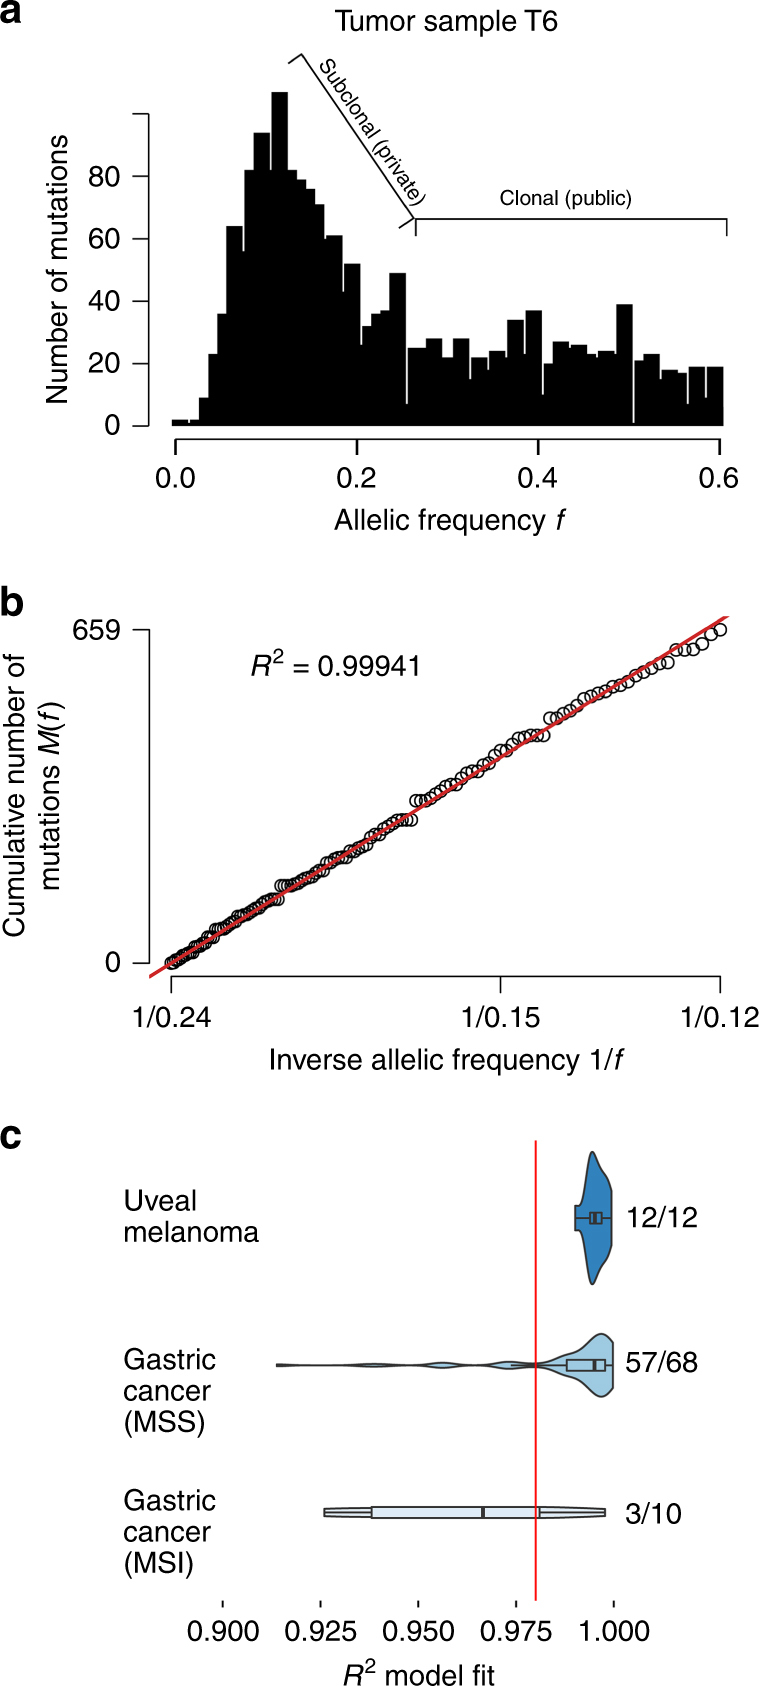
Cancer is thought to arise through the accumulation of genomic aberrations evolving under Darwinian selection. However, it remains unclear when the aberrations associated with metastasis emerge during tumor evolution. Uveal melanoma (UM) is the most common primary eye cancer and frequently leads to metastatic death, which is strongly linked to BAP1 mutations. Accordingly, UM is ideally suited for studying the clonal evolution of metastatic competence. Here we analyze sequencing data from 151 primary UM samples using a customized bioinformatic pipeline, to improve detection of BAP1 mutations and infer the clonal relationships among genomic aberrations. Strikingly, we find BAP1 mutations and other canonical genomic aberrations usually arise in an early punctuated burst, followed by neutral evolution extending to the time of clinical detection. This implies that the metastatic proclivity of UM is "set in stone" early in tumor evolution and may explain why advances in primary treatment have not improved survival.


Conflict of interest statement

Drs. Harbour and Bowcock are inventors of intellectual property discussed in this study. Dr. Harbour is a paid consultant for Castle Biosciences, licensee of this intellectual property, and he receives royalties from its commercialization. All remaining authors declare no competing financial interests.

Figures

Fig. 1
Fig. 1
Molecular landscape in 139 primary uveal melanomas analyzed by whole exome sequencing. Mutation status for common driver and spliceosome mutations, type of mutation, common chromosome copy number alterations (CNAs), gene expression profile status (class 1 versus class 2), source of tumor sample, and availability of matched normal DNA are indicated. CNAs were assessed using CNVkit. CNA data are scaled using the log2 copy ratio of the predicted copy number over the normal copy number. Mutations in “BSE” and splicing genes (pink box) are demarcated from those in Gq signaling pathway genes (blue box)
Fig. 2
Fig. 2
BAP1 mutation diversity and necessary detection methods. Standard somatic mutation callers (i.e., Varscan2 and MuTect2) can detect SNPs (SNP) and small indels (small indel). Large indels need specialized realignment (i.e., with ABRA) for detection, as these can be missed with IndelRealigner and/or Mutect2 (large indel). Somatic mutation callers exclude germline mutations, so blood samples need to be run with a germline mutation caller (e.g., HaplotypeCaller) or as an unmatched “tumor” with a somatic caller (e.g., MuTect2) to detect patients with BAP1 hereditary cancer predisposition syndrome (germline mutation). Mutations can be “rescued” in low coverage regions by combining WES and RNA-Seq data (i.e., UNCeqR) (RNA-seq rescue). Large indels may be missed with WES data when they start or extend into intronic or promoter regions due to poor bait coverage. In the case of the former, RNA-Seq data can be used to detect large indels that start in a transcribed exon and extend into the intron using alternative splicing algorithms (RNA-seq “SpliceDel”). For the latter, WGS with alternative splicing algorithms is required to detect indels that start in the promoter region or 5′-UTR and extends into exons or across multiple exons (WGS “SpliceDel”). In cases with loss of one chromosome 3 and deletion of genes on the remaining copy of chromosome 3, a CNA caller is required to detect the homozygously deleted regions (homozygous deletion). Sample alignments were visualized using Integrative Genomics Viewer. A representative sample was selected for each mutation type and detection method
Fig. 3
Fig. 3
Phylogenetic tree demonstrating relationships between uveal melanoma samples based on genomic DNA methylation. A minimum evolution algorithm (Canberra distance) was used to build an unrooted evolutionary tree. Gene expression profile (class 1 versus class 2) and mutation status are indicated. These data are presented in a rooted phylogenetic tree with significance estimates in Supplementary Fig. 5
Fig. 4
Fig. 4
Clonal evolution in uveal melanoma. a Clonal relationships between canonical driver mutations and chromosome copy number alterations. Red bars denote aberrations that are present in 100% of tumor cells and thus arising before the most recent common ancestor (MRCA). Blue bars denote aberrations present in a subclone of < 100% tumor cells arising subsequent to the MRCA. A white bar denotes that the aberration was not present. *Isodisomy 3 in 100% of tumor cells; †isodisomy 3 in a subclone of < 100% of tumor cells. b Life history clonal evolution plots for eight representative uveal melanoma samples. Blue box illustrates class 1 tumors with no BSE mutations (A9EH), SF3B1 and 6p gain in 100% of tumor cells (A9F4), EIF1AX and 6p gain in 100% of tumor cells (A8KE), and EIF1AX in 100% of tumor cells and 6p gain in a subclone (A87U). Red box illustrates class 2 tumors with LOH3 and BAP1 in 100% of tumor cells (A9F1), LOH3 in 100% of tumor cells, and BAP1 mutation in a subclone (T3 and A9ZX), and LOH3 and BAP1 in 100% of tumor cells with later duplication of chromosome 3 to generate isodisomy 3 in a subclone (A9E8). The node at the top of each plot (light grey circle) represents normal uveal melanocytes, the presumed precursor cell that gives rise to all uveal melanomas. The next lower node (dark gray circle) represents the most recent common ancestor (MRCA) from which all aberrations present in 100% of tumor cells arose. Lower nodes (blue circles) represent subclones that arise after the most MRCA, with the area of the node being proportional to the percentage of cells in the subclone. The mutations and CNAs that occur between two nodes are indicated beside the connecting branch (gray bar). The length of each branch is proportional to the number of mutations that occur between nodes and the width of the branch is proportional to the percentage of cells containing those mutations. When a node contains rare aberrations that cannot be accurately mapped to one node, it is mapped to all possible nodes, as described in Methods
Fig. 5
Fig. 5
Analysis of uveal melanoma whole genome sequencing (WGS) data for evidence of neutral tumor evolution. a Histogram of mutant allele frequency for representative tumor sample T6. Mutations that occur at frequencies ≥ 0.25 are considered to be clonal (public) and those occurring at frequencies below this cutoff are subclonal (private). b Cumulative distribution, M(f), of subclonal mutations for sample T6, which is highly consistent with the neutral evolution model. c Comparison of goodness-of-fit, R2, for neutral tumor evolution in uveal melanoma versus previously published gastric cancer WGS data. All 12 uveal melanoma samples demonstrated R2 ≥ 0.98 (red line), whereas 60 of 78 (76.9%) gastric cancer samples without microsatellite instability (MSS) and only 3/10 (30%) of gastric cancer samples with microsatellite instability (MSS) met this threshold. The proportion of samples with a particular R2 model fit is proportional to the violin plot width. Box plots within the violin plot illustrate the median, upper, and lower quartiles, and Tukey's whiskers (median ± 1.58 times interquartile range)

References

    1. Onken MD, et al. Collaborative Ocular Oncology Group report number 1: prospective validation of a multi-gene prognostic assay in uveal melanoma. Ophthalmology. 2012;119:1596–1603. doi: 10.1016/j.ophtha.2012.02.017. - DOI - PMC - PubMed
    1. Decatur CL, et al. Driver mutations in uveal melanoma: associations with gene expression profile and patient outcomes. JAMA Ophthalmol. 2016;134:728–733. doi: 10.1001/jamaophthalmol.2016.0903. - DOI - PMC - PubMed
    1. Van Raamsdonk CD, et al. Frequent somatic mutations of GNAQ in uveal melanoma and blue naevi. Nature. 2009;457:599–602. doi: 10.1038/nature07586. - DOI - PMC - PubMed
    1. Van Raamsdonk CD, et al. Mutations in GNA11 in uveal melanoma. N. Engl. J. Med. 2010;363:2191–2199. doi: 10.1056/NEJMoa1000584. - DOI - PMC - PubMed
    1. Johansson P, et al. Deep sequencing of uveal melanoma identifies a recurrent mutation in PLCB4. Oncotarget. 2015;7:4624–4631. doi: 10.18632/oncotarget.6614. - DOI - PMC - PubMed

Publication types