. 2018 Jan 9;8(1):157.
doi: 10.1038/s41598-017-18405-8.

Alterations in the properties of the cell membrane due to glycosphingolipid accumulation in a model of Gaucher disease

Affiliations

Alterations in the properties of the cell membrane due to glycosphingolipid accumulation in a model of Gaucher disease

Gyula Batta et al. Sci Rep. .

Abstract

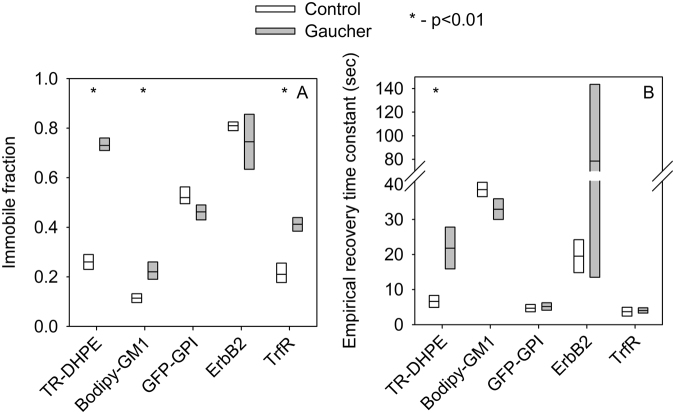
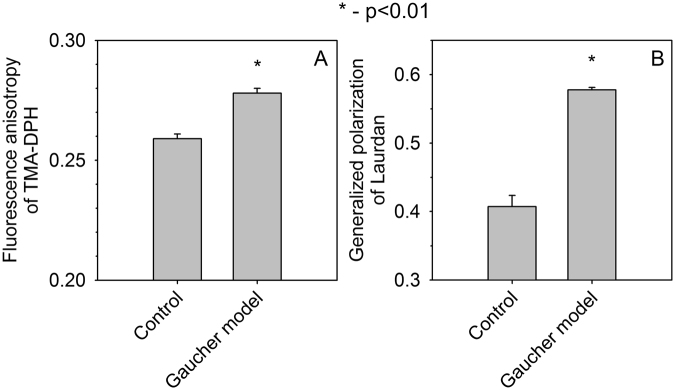
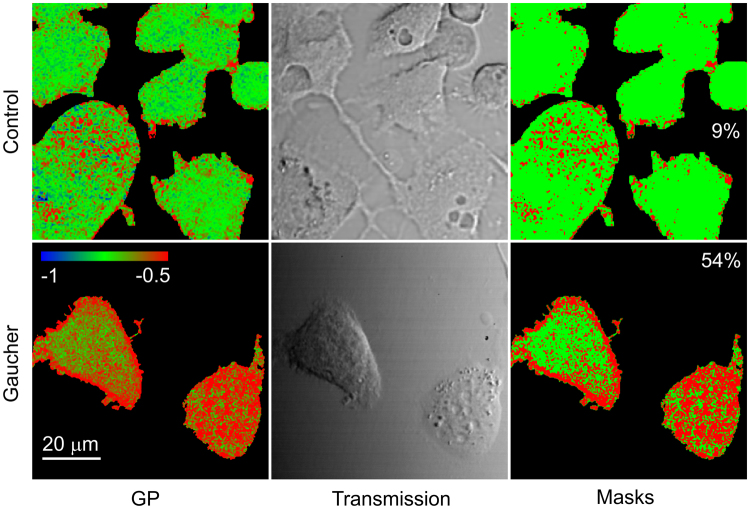
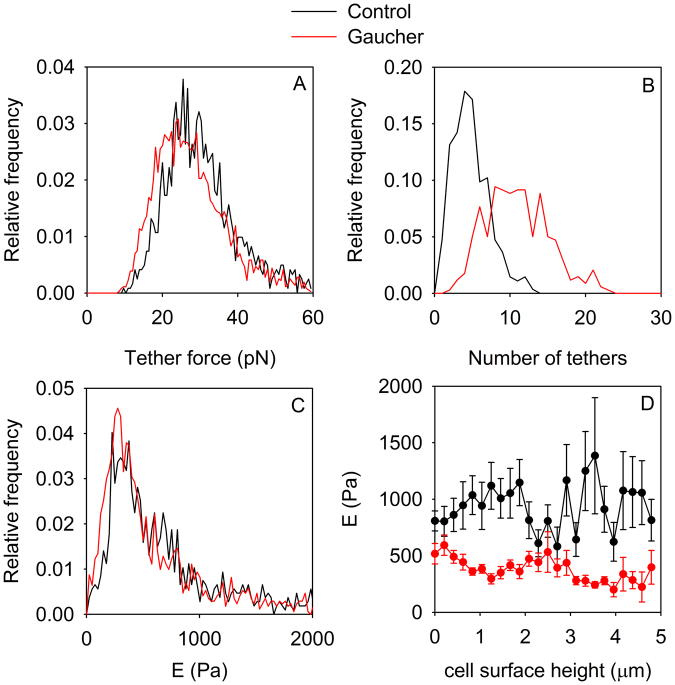
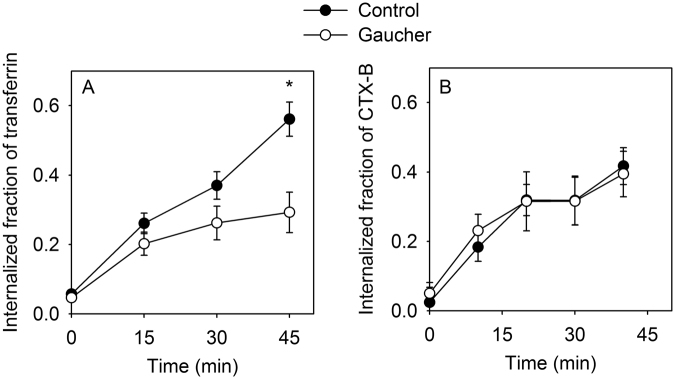
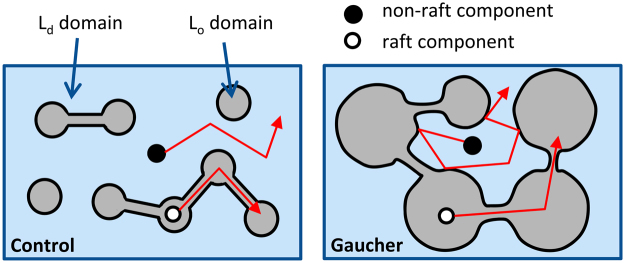
Gaucher disease is a lysosomal storage disease characterized by the malfunction of glucocerebrosidase resulting in the accumulation of glucosylceramide and other sphingolipids in certain cells. Although the disease symptoms are usually attributed to the storage of undigested substrate in lysosomes, here we show that glycosphingolipids accumulating in the plasma membrane cause profound changes in the properties of the membrane. The fluidity of the sphingolipid-enriched membrane decreased accompanied by the enlargement of raft-like ordered membrane domains. The mobility of non-raft proteins and lipids was severely restricted, while raft-resident components were only mildly affected. The rate of endocytosis of transferrin receptor, a non-raft protein, was significantly retarded in Gaucher cells, while the endocytosis of the raft-associated GM1 ganglioside was unaffected. Interferon-γ-induced STAT1 phosphorylation was also significantly inhibited in Gaucher cells. Atomic force microscopy revealed that sphingolipid accumulation was associated with a more compliant membrane capable of producing an increased number of nanotubes. The results imply that glycosphingolipid accumulation in the plasma membrane has significant effects on membrane properties, which may be important in the pathogenesis of Gaucher disease.


Conflict of interest statement

The authors declare that they have no competing interests.

Figures

Figure 1
Figure 1
Measurement of the lateral diffusion of membrane proteins and lipids by FRAP. Fluorescent lipid analogs were incorporated into the membrane, or membrane proteins coupled to a fluorescent protein variant were transfected to control or Gaucher-type, sphingolipid-enriched macrophages. The immobile fraction (A) and the rate of lateral diffusion, characterized by the empirical recovery time constant (B), were determined by fitting equation 2 to the averaged, double-normalized recovery curves shown in Fig. S4. The line within the box indicates the fitted immobile fraction and recovery time constants, whereas the boundaries of the boxes correspond to the 95% confidence bounds. The graphs are based on ten FRAP experiments from three independent labelings or transfections, in which a single region was bleached in a single cell. Statistical significance was estimated by the extent overlap between the confidence intervals of the fitted parameters.
Figure 2
Figure 2
Measurement of membrane fluidity and hydration. Control and sphingolipid-enriched Gaucher-type macrophages were labeled with TMA-DPH or Laurdan and the fluorescence anisotropy of TMA-DPH (A) as well as the generalized polarization of Laurdan (B) were measured by fluorometry. The error bars display the standard error of the mean (n = 10 from four independent experiments). Control and Gaucher-type cells were compared by two-way ANOVA followed by Tukey’s HSD test. Asterisks indicate significant differences between the control and Gaucher-type cells.
Figure 3
Figure 3
Two-photon microscopic measurement of the generalized polarization of Laurdan. Control and sphingolipid-enriched Gaucher-type macrophages were labeled by Laurdan and the generalized polarization (GP) of the indicator, characterizing membrane hydration, was measured by two-photon microscopy. Images were recorded in a plane corresponding to the flat plasma membrane adjacent to the coverslip. The generalized polarization of the indicator incorporated into the plasma membrane is shown on the left on a color scale ranging between -1 and −0.5. Hydrated and less hydrated membrane domains are shown in green and red, respectively. The generalized polarization values shown in these images are not comparable to the ones in Fig. 2, since generalized polarization of the indicator is modified by the sensitivity of detectors recording the blue and red spectral range of Laurdan emission, which was different for the fluorometric and microscopic experiments presented in Figs 2 and 3, respectively. The corresponding transmission images showing the morphology of cells are displayed in the middle. The images on the left were segmented into two masks corresponding to high and low values of generalized polarization shown in red and green, respectively. The same threshold was applied for both images, and it was chosen by visual inspection. The percentages displayed on the masks are the fractional areas of the high-GP mask.
Figure 4
Figure 4
Measurement of membrane tether formation and elastic properties using atomic force microscopy. (A,B) Membrane tether formation was analyzed on the force vs. separation curves corresponding to the retraction phase by atomic force microscopy. Tether force was determined as the abrupt change in force upon detachment of a tether from the cantilever and the distribution of tether forces in control and Gaucher-type cells was calculated (A). Due to the large number of elements (n = 1319 and n = 3741 for the control and Gaucher-type cells, respectively) the histogram means are significantly different from each other (p < 0.001). Such step-like changes in the force curve were enumerated and the distributions of their numbers for control and Gaucher-type cells are displayed (B). The means of the number of membrane tethers are significantly different from each other (p < 0.01). (C,D) The elastic modulus was determined in the extension phase of the force vs. separation curve, and its histogram in control and Gaucher-type cells is shown in (C). The height of the AFM cantilever above the cell was divided into 25 bins and the mean of Young’s modulus calculated in each bin was plotted as a function of the height (D).
Figure 5
Figure 5
Quantitative evaluation of the endocytosis of transferrin and subunit B of cholera toxin. Cells were incubated with fluorescent transferrin or subunit B of cholera toxin at 37 °C followed by staining with DAPI and a membrane marker (anti-CD14). The cytoplasmic and membrane masks were defined by detecting nuclei and the membrane using the Wählby algorithm and manually-seeded watershed segmentation, respectively. The endocytosed-fraction of the ligands was determined as the relative fraction of fluorescence intensity in the cytoplasmic mask compared to the total cellular fluorescence on a cell-by-cell basis. Error bars indicate the standard error of the mean (n ≈ 100–200 cells from three independent experiments). (*p < 0.05 for the difference between control and Gaucher-type cells at 40 or 45 min).
Figure 6
Figure 6
Effect of the Gaucher phenotype on STAT phosphorylation. Control THP-1-derived macrophages and those exhibiting the Gaucher phenotype were serum-starved overnight followed by a 30-min stimulation with 100 ng/ml IFN-γ. Cells were analyzed by microscopy (A–C) or flow cytometry after trypsinization (D). The level of tyrosine phosphorylated STAT1 was calculated in the whole cell (A), in the nucleus (B) or in the cytoplasm (C) using quantitative image analysis, or it was determined from the mean of flow cytometric histograms (D). The fluorescence intensity values were normalized to the unstimulated control. The error bars represent the standard error of the mean of four independent experiments in the case of microscopy and three independent experiments in the case of flow cytometric results. Control and Gaucher-type cells were compared by two-way ANOVA followed by Tukey’s HSD test (*p < 0.05 for the difference between IFNγ-stimulated control and Gaucher cells).
Figure 7
Figure 7
Model for sphingolipid enrichment-induced changes in the plasma membrane. The membrane is assumed to be composed of liquid-disordered (Ld) and liquid-ordered (Lo) domains with the latter corresponding to lipid rafts enriched in sphingolipids. Membrane components mainly diffuse within their own domains. Upon sphingolipid enrichment, the physical landscape of the membrane changes due to enlargement of Lo domains causing their coalescence and consequent confinement of non-raft components.

References

    1. Escriba PV, et al. Membranes: a meeting point for lipids, proteins and therapies. J Cell Mol Med. 2008;12:829–875. doi: 10.1111/j.1582-4934.2008.00281.x. - DOI - PMC - PubMed
    1. Escriba PV, et al. Membrane lipid therapy: Modulation of the cell membrane composition and structure as a molecular base for drug discovery and new disease treatment. Prog Lipid Res. 2015;59:38–53. doi: 10.1016/j.plipres.2015.04.003. - DOI - PubMed
    1. Butters TD. Gaucher disease. Curr Opin Chem Biol. 2007;11:412–418. doi: 10.1016/j.cbpa.2007.05.035. - DOI - PubMed
    1. Grabowski GA. Gaucher disease and other storage disorders. Hematology Am Soc Hematol Educ Program. 2012;2012:13–18. - PubMed
    1. Sidransky E. Gaucher disease: insights from a rare Mendelian disorder. Discov Med. 2012;14:273–281. - PMC - PubMed

Publication types