. 2017:2017:8010961.
doi: 10.1155/2017/8010961. Epub 2017 Nov 29.

Maternal Adaptive Immune Cells in Decidua Parietalis Display a More Activated and Coinhibitory Phenotype Compared to Decidua Basalis

Affiliations

Maternal Adaptive Immune Cells in Decidua Parietalis Display a More Activated and Coinhibitory Phenotype Compared to Decidua Basalis

Martin Solders et al. Stem Cells Int. 2017.

Abstract

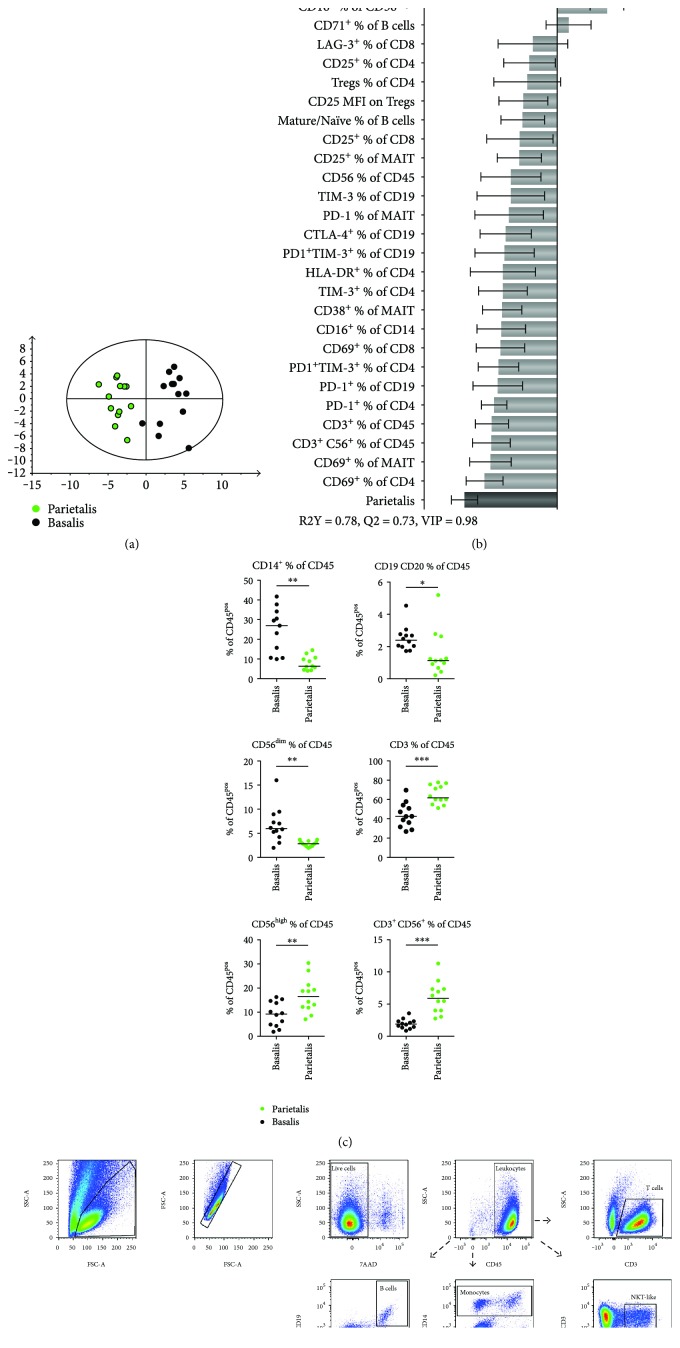
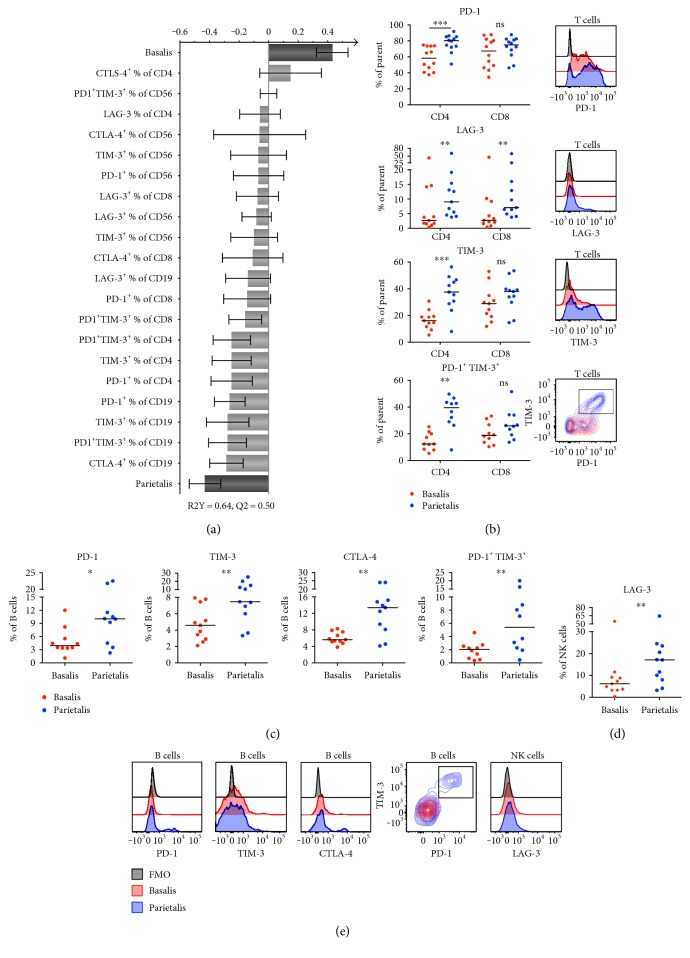
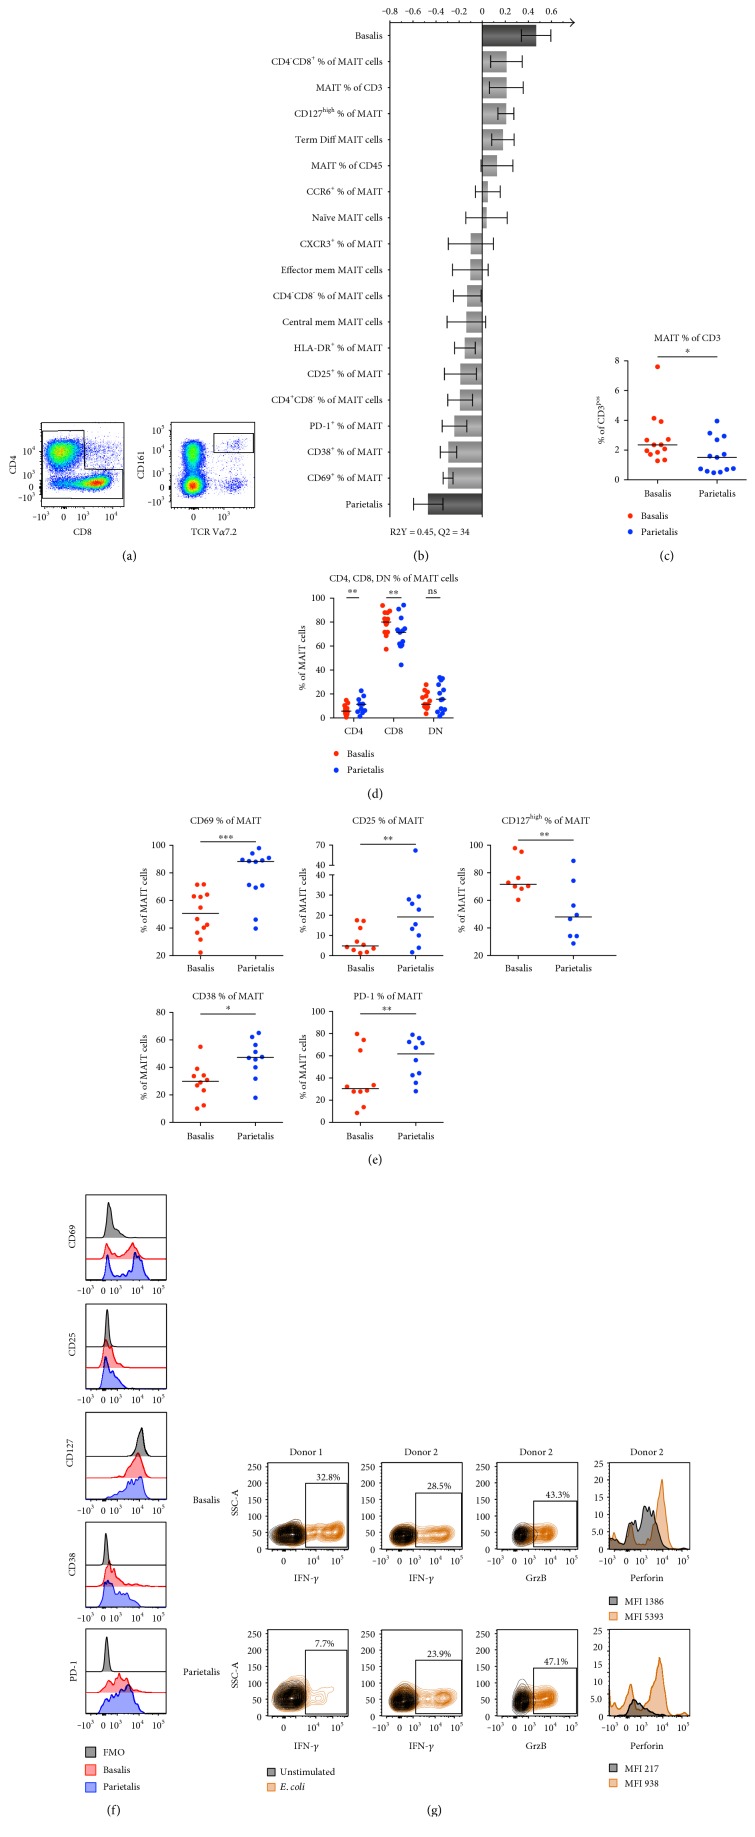
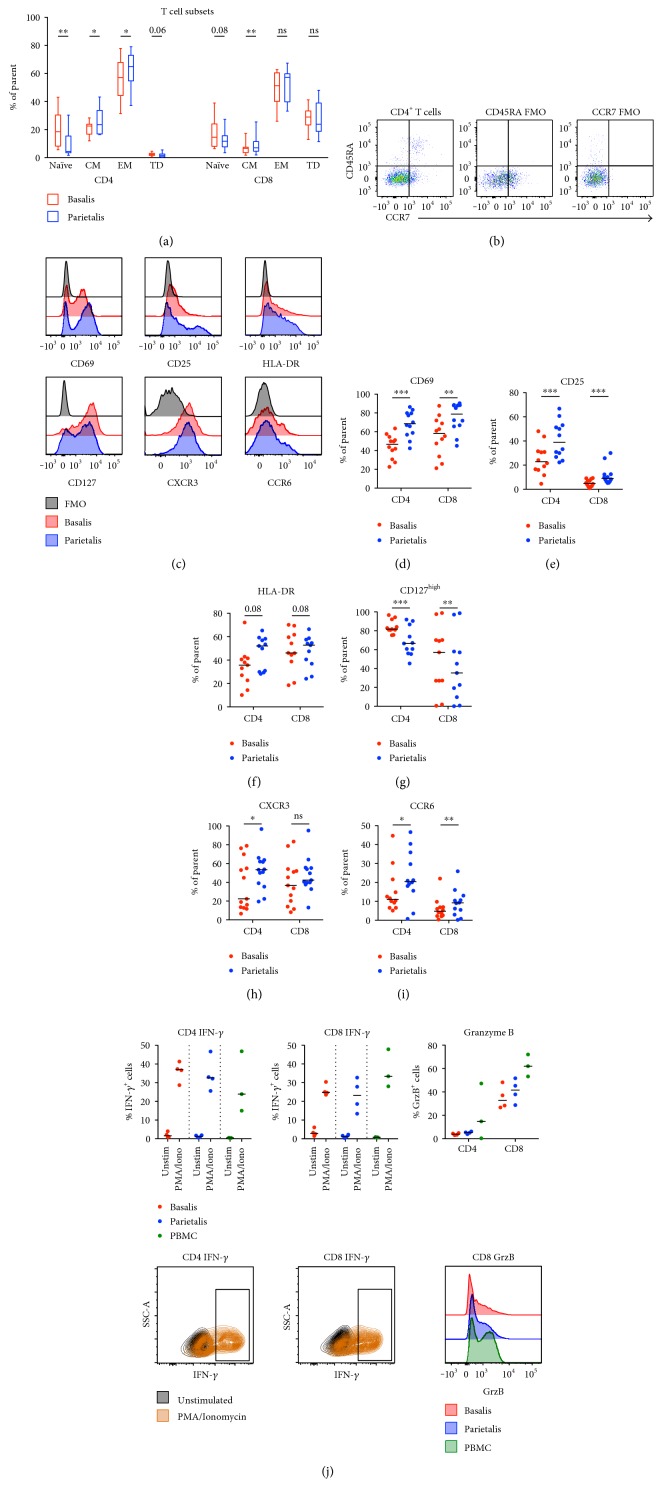
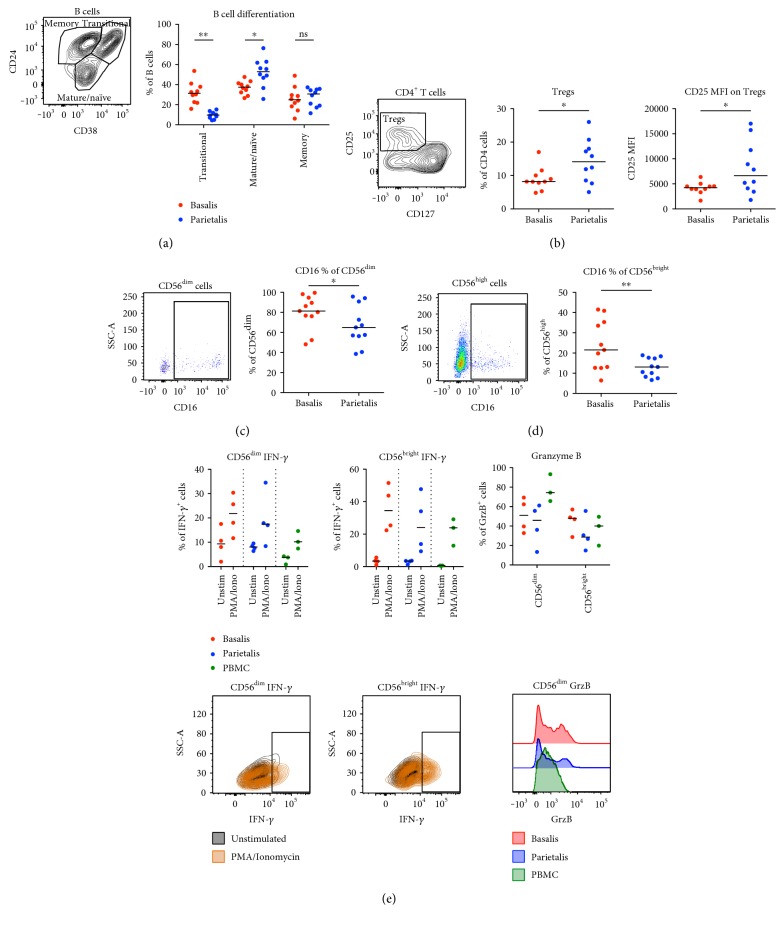
The maternal part of the placenta, the decidua, consists of maternal immune cells, decidual stromal cells, and extravillous fetal trophoblasts. In a successful pregnancy, these cell compartments interact to provide an intricate balance between fetal tolerance and antimicrobial defense. These processes are still poorly characterized in the two anatomically different decidual tissues, basalis and parietalis. We examined immune cells from decidua basalis and parietalis from term placentas (n = 15) with flow cytometry. By using multivariate discriminant analysis, we found a clear separation between the two decidual compartments based on the 81 investigated parameters. Decidua parietalis lymphocytes displayed a more activated phenotype with a higher expression of coinhibitory markers than those isolated from basalis and contained higher frequencies of T regulatory cells. Decidua basalis contained higher proportions of monocytes, B cells, and mucosal-associated invariant T (MAIT) cells. The basalis B cells were more immature, and parietalis MAIT cells showed a more activated phenotype. Conventional T cells, NK cells, and MAIT cells from both compartments potently responded with the production of interferon-γ and/or cytotoxic molecules in response to stimulation. To conclude, leukocytes in decidua basalis and parietalis displayed remarkable phenotypic disparities, indicating that the corresponding stromal microenvironments provide different immunoregulatory signals.


Figures

Figure 1
Figure 1
Different leukocyte populations in decidua parietalis and basalis. (a) OPLS-DA observation plot displaying a separation between leukocytes from decidua basalis and parietalis. (b) OPLS plot following a variable influence on projection (VIP) of 0.98, showing associations between decidual compartment and phenotypic leukocyte markers (n = 8–13 for (a, b)). (c) Distribution of major leukocyte subsets in paired samples of decidua basalis and parietalis compared with the nonparametric Wilcoxon test. Line in graphs depicts the median among values (n = 11-12). (d) Representative flow cytometry plots showing the initial gating strategy used throughout the paper, as well as the gating of the subsets in (c). p < 0.05; ∗∗p < 0.01; ∗∗∗p < 0.001.
Figure 2
Figure 2
Lymphocytes in decidua parietalis express more coinhibitory markers compared to basalis. (a) OPLS plot showing associations between decidual compartment and phenotypic coinhibitory markers (n = 10–12). (b) Surface expression and representative histograms and contour plots showing the expression of the indicated extracellular markers on decidua basalis and parietalis T cells (CD3+) compared to the fluorescent minus one (FMO) control of PD-1 (n = 12), LAG-3 (n = 11), TIM-3 (n = 11), and PD-1+TIM-3+ (n = 10). (c) B cell (CD19+) surface expression of PD-1 (n = 10), TIM-3 (n = 11), CTLA-4 (n = 11), and PD-1+TIM-3+ (n = 10). (d) NK cell (CD56+CD3) surface expression of LAG-3 (n = 11). (e) Representative histograms and contour plots showing the expression of the indicated extracellular markers on decidua basalis and parietalis cells from (c) to (d) compared to the fluorescent minus one (FMO) control. Line in graphs depicts the median. Comparisons between the paired samples were made using the nonparametric Wilcoxon test. ns = not significant; p < 0.05; ∗∗p < 0.01; ∗∗∗p < 0.001.
Figure 3
Figure 3
MAIT cells in decidua basalis are more numerous, but parietalis MAIT cells display a more activated phenotype. (a) Representative flow cytometry plots showing the gating strategy for MAIT cells based on CD3+ T cells (left to right). (b) OPLS plot showing associations between decidual compartment and phenotypic MAIT cell markers (n = 8–13). (c) Number of MAIT cells expressed as percentage of CD3+ T cells in paired samples of decidua basalis and parietalis (n = 13). (d) MAIT cell surface expression of CD4 and CD8 in paired samples of decidua basalis and parietalis (n = 13). (e) MAIT cell surface expression of CD69 (n = 12), CD25 (n = 10), CD127high (n = 8), CD38 (n = 10), and PD-1 (n = 10). (f) Representative histograms showing the expression of the indicated extracellular markers on MAIT cells from decidua basalis and parietalis compared to the fluorescent minus one (FMO) control. (g) Contour plots and histograms showing the expression of the indicated intracellular molecules on decidua basalis (top) and parietalis (bottom) in unstimulated (black) compared to the E. coli stimulated conditions (orange) for interferon-γ (IFN-γ, n = 2), granzyme B (GrzB, n = 1), and perforin (n = 1). Line in graphs depicts the median. Comparisons between the paired samples were made using the nonparametric Wilcoxon test. ns = not significant; p < 0.05; ∗∗p < 0.01; ∗∗∗p < 0.001.
Figure 4
Figure 4
Decidua parietalis contains more activated T cells than basalis. (a) CD4+ and CD8+ T cells were gated according to the expression of CD45RA and CCR7 (gating strategy in (b)) and divided into naïve, central memory (CM), effector memory (EM), or terminally differentiated (TD) subsets (n = 13). (c) Representative histograms showing the expression of the indicated extracellular markers on decidua basalis and parietalis compared to the fluorescent minus one (FMO) control. Comparisons between decidua basalis and parietalis CD4+ and CD8+ T cells regarding the expression of CD69 (d), CD25 (e), HLA-DR (f), CD127high (g), CXCR3 (h), and CCR6 (i) ((d, e) and (i) n = 12, (f, g) n = 11, (h) n = 13). (j) Paired mononuclear cells from basalis (n = 4) and parietalis (n = 4) were stimulated for 5 hours with PMA/ionomycin or left unstimulated. Data on cells from healthy controls (PBMC) were included as controls (n = 3). Intracellular expression of interferon-γ (IFN-γ) and granzyme B (GrzB) was determined by flow cytometry. T cells were divided into CD4+ (upper left) and CD8+ (upper middle), representative contour plots below the respective cell subset. GrzB was measured in unstimulated samples only (upper right), representative histograms shown in the bottom right corner. Line in graphs depicts the median among values. Comparisons between the paired samples were made using the nonparametric Wilcoxon test. ns = not significant; p < 0.05; ∗∗p < 0.01; ∗∗∗p < 0.001.
Figure 5
Figure 5
Maturational state of B cells and frequencies of T regulatory cell differ between decidual compartment. (a) Gating strategy (left) and graphical representation (right) of differentiation status of B cells from paired samples of decidua basalis and parietalis (n = 10). (b) Gating strategy and proportions of T regulatory cells (Tregs) as percentage of CD4+ T cells (middle) and the median fluorescence intensity (MFI) of CD25 of the gated Tregs (right) (n = 10). (c) Gating strategy (left) and graphical representation (right) of CD16 expression on CD56dim cells from paired samples of decidua basalis and parietalis (n = 11). (d) Same as in (c) but for CD56high cells (n = 11). (e) Paired mononuclear cells from basalis (n = 4) and parietalis (n = 4) were stimulated for 5 hours with PMA/ionomycin or left unstimulated. Data on cells from healthy controls (PBMC) were included as controls (n = 3). Intracellular expression of interferon-γ (IFN-γ) and granzyme B (GrzB) was determined by flow cytometry. T cells were divided into CD56dim (upper left) and CD56bright (upper middle), representative contour plots below the respective cell subset. GrzB was measured in unstimulated samples only (upper right), representative histograms shown in the bottom right corner. Line in graphs depicts the median. Comparisons between the paired samples were made using the nonparametric Wilcoxon test. ns = not significant; p < 0.05; ∗∗p < 0.01.

References

    1. Gellersen B., Brosens J. J. Cyclic decidualization of the human endometrium in reproductive health and failure. Endocrine Reviews. 2014;35(6):851–905. doi: 10.1210/er.2014-1045. - DOI - PubMed
    1. Nancy P., Tagliani E., Tay C. S., Asp P., Levy D. E., Erlebacher A. Chemokine gene silencing in decidual stromal cells limits T cell access to the maternal-fetal interface. Science. 2012;336(6086):1317–1321. doi: 10.1126/science.1220030. - DOI - PMC - PubMed
    1. Karlsson H., Erkers T., Nava S., Ruhm S., Westgren M., Ringden O. Stromal cells from term fetal membrane are highly suppressive in allogeneic settings in vitro. Clinical and Experimental Immunology. 2012;167(3):543–555. doi: 10.1111/j.1365-2249.2011.04540.x. - DOI - PMC - PubMed
    1. Erkers T., Nava S., Yosef J., Ringden O., Kaipe H. Decidual stromal cells promote regulatory T cells and suppress alloreactivity in a cell contact-dependent manner. Stem Cells and Development. 2013;22(19):2596–2605. doi: 10.1089/scd.2013.0079. - DOI - PubMed
    1. Erkers T., Solders M., Verleng L., et al. Frontline Science: placenta-derived decidual stromal cells alter IL-2R expression and signaling in alloantigen-activated T cells. Journal of Leukocyte Biology. 2017;101(3):623–632. doi: 10.1189/jlb.5HI0616-284R. - DOI - PubMed