

Timely Referral to Outpatient Nephrology Care Slows Progression and Reduces Treatment Costs of Chronic Kidney Diseases
- PMID: 29318212
- PMCID: PMC5720523
- DOI: 10.1016/j.ekir.2016.09.062
Timely Referral to Outpatient Nephrology Care Slows Progression and Reduces Treatment Costs of Chronic Kidney Diseases
Abstract
Introduction: We present a new approach to evaluate the importance of ambulatory nephrology care in patients with chronic kidney disease (CKD).
Methods: An anonymized health claims database of German insurance companies was searched in a retrospective analysis for patients with CKD using the codes of the International Classification of Diseases, 10th German modification. A total of 105,219 patients with CKD were identified. Patients were assigned to the group "timely referral," when nephrology care was present in the starting year 2009, or initiated during the following 3 years in CKD1-4. Using frequency matching for age and gender, 21,024 of the late referral group were matched with the equal number of patients in the timely referral group. Hospital admission rates, total treatment costs, and kidney function (change in CKD stages, start of dialysis, mortality) were documented each year during the 4-year follow-up.
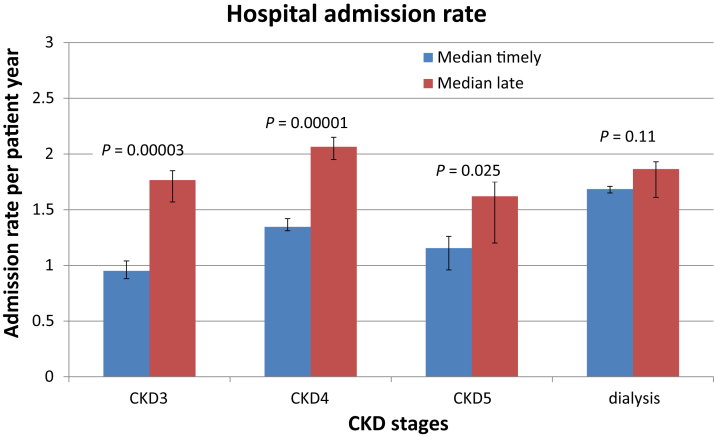
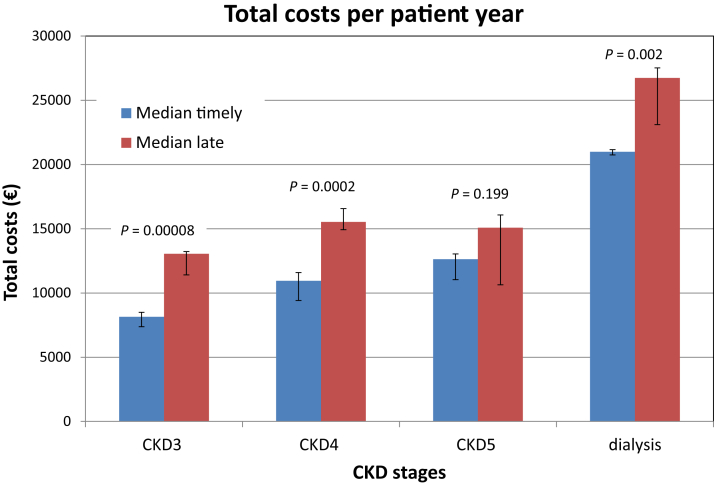
Results: Hospital admission rates (110%-186%) and total treatment costs (119%-160%) were significantly higher (P < 0.03) in late referral compared with timely referral. In the timely referral group, significantly more patients did not change their CKD stage (65%-72.9% vs. 52%-64.6%, P < 0.05) compared with late referral. Starting in CKD3 more patients tended to start dialysis in 1 year in timely referral (1.9 ± 0.6 vs. 1.0 ± 0.4, P = 0.1). In contrast, death rates were significantly higher in the late referral group (18.8 ± 1.8% vs. 6.7 ± 0.4%, P = 0.0001).
Discussion: Timely referral to outpatient nephrology care is associated with slowed disease progression, less hospital admissions, reduced total treatment costs, and improved survival in patients with CKD.
Keywords: chronic kidney diseases; hospital admission rates; mortality; progression of renal insufficiency; timely referral to nephrology care; treatment costs.
Figures


References
-
- Coresh J., Selvin E., Stevens L.A. Prevalence of chronic kidney disease in the United States. JAMA. 2007;298:2038–2047. - PubMed
-
- Hallan S.I., Coresh J., Astor B.C. International comparison of the relationship of chronic kidney disease prevalence and ESRD risk. J Am Soc Nephrol. 2006;17:2275–2284. - PubMed
-
- Vassalotti J.A., Li S., Chen S.C., Collins A.J. Screening populations at increased risk of CKD: the Kidney Early Evaluation Program (KEEP) and the public health problem. Am J Kidney Dis. 2009;53(Suppl 3):S107–S114. - PubMed
-
- Jones C., Roderick P., Harris S., Rogerson M. Decline in kidney function before and after nephrology referral and the effect on survival in moderate to advanced chronic kidney disease. Nephrol Dial Transplant. 2006;21:2133–2143. - PubMed
LinkOut - more resources
Full Text Sources
Other Literature Sources
