. 2018 Mar;102(3):e90-e100.
doi: 10.1097/TP.0000000000002044.

Selective CD28 Inhibition Modulates Alloimmunity and Cardiac Allograft Vasculopathy in Anti-CD154-Treated Monkeys

Affiliations

Selective CD28 Inhibition Modulates Alloimmunity and Cardiac Allograft Vasculopathy in Anti-CD154-Treated Monkeys

Tianshu Zhang et al. Transplantation. 2018 Mar.

Abstract

Background: Selective CD28 inhibition is actively pursued as an alternative to B7 blockade using cytotoxic T lymphocyte antigen 4 Ig based on the hypothesis that the checkpoint immune regulators cytotoxic T lymphocyte antigen 4 and programmed death ligand 1 will induce tolerogenic immune signals. We previously showed that blocking CD28 using a monovalent nonactivating reagent (single-chain anti-CD28 Fv fragment linked to alpha-1 antitrypsin [sc28AT]) synergizes with calcineurin inhibitors in nonhuman primate (NHP) kidney and heart transplantation. Here, we explored the efficacy of combining a 3-week "induction" sc28AT treatment with prolonged CD154 blockade.

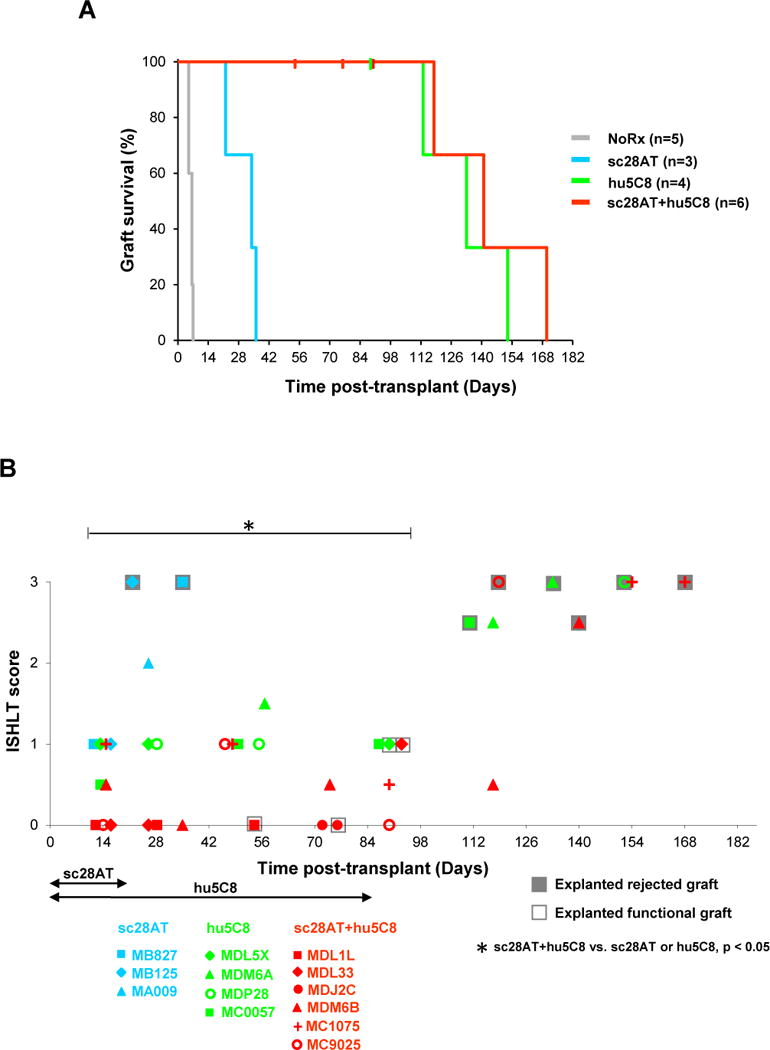
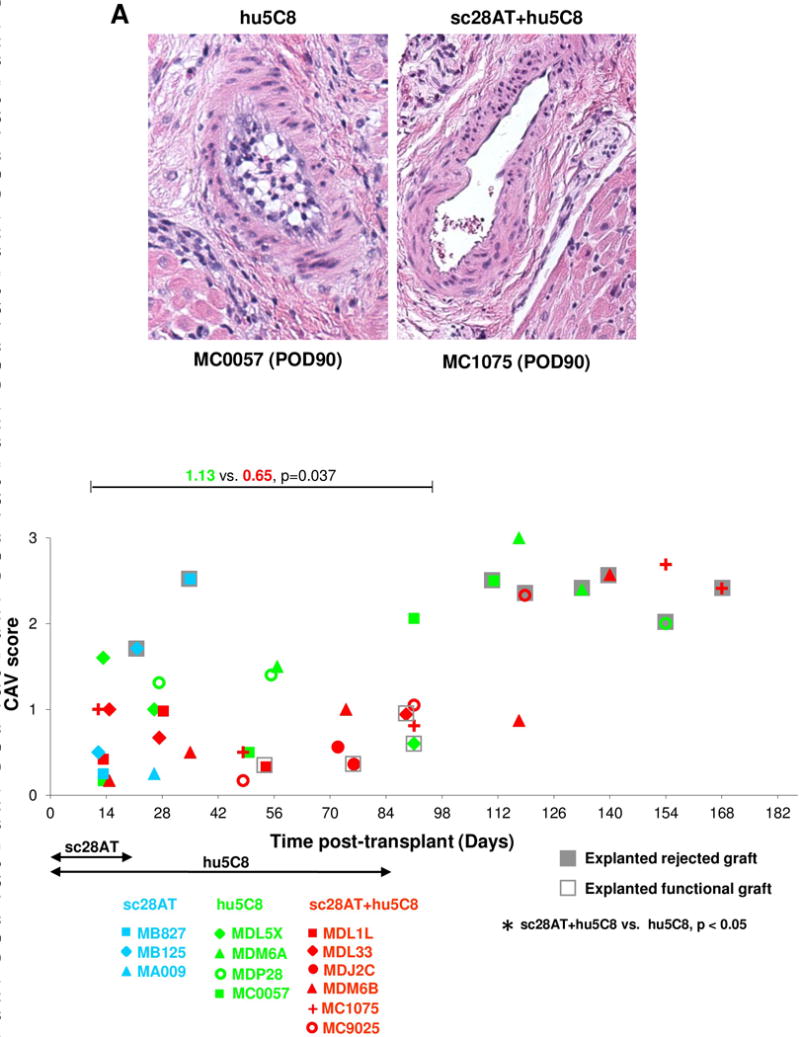
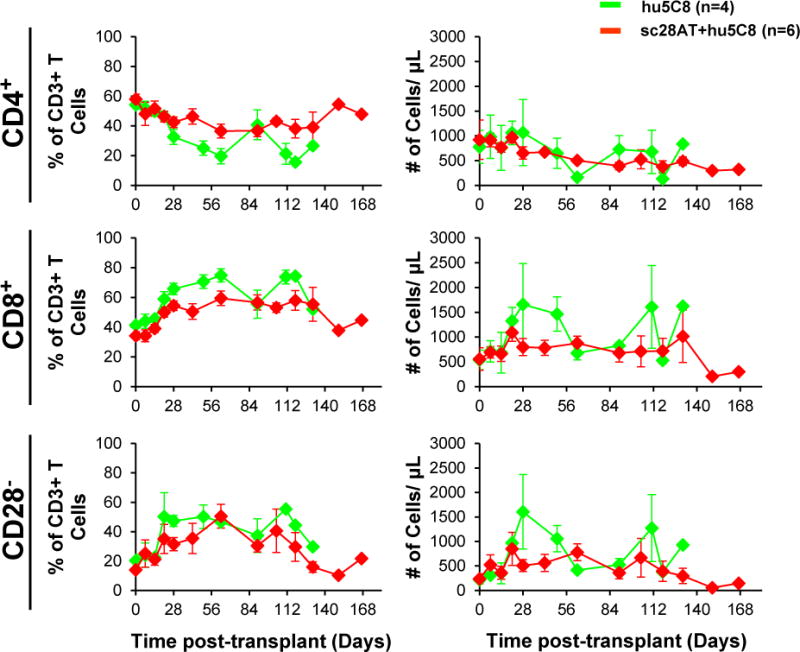
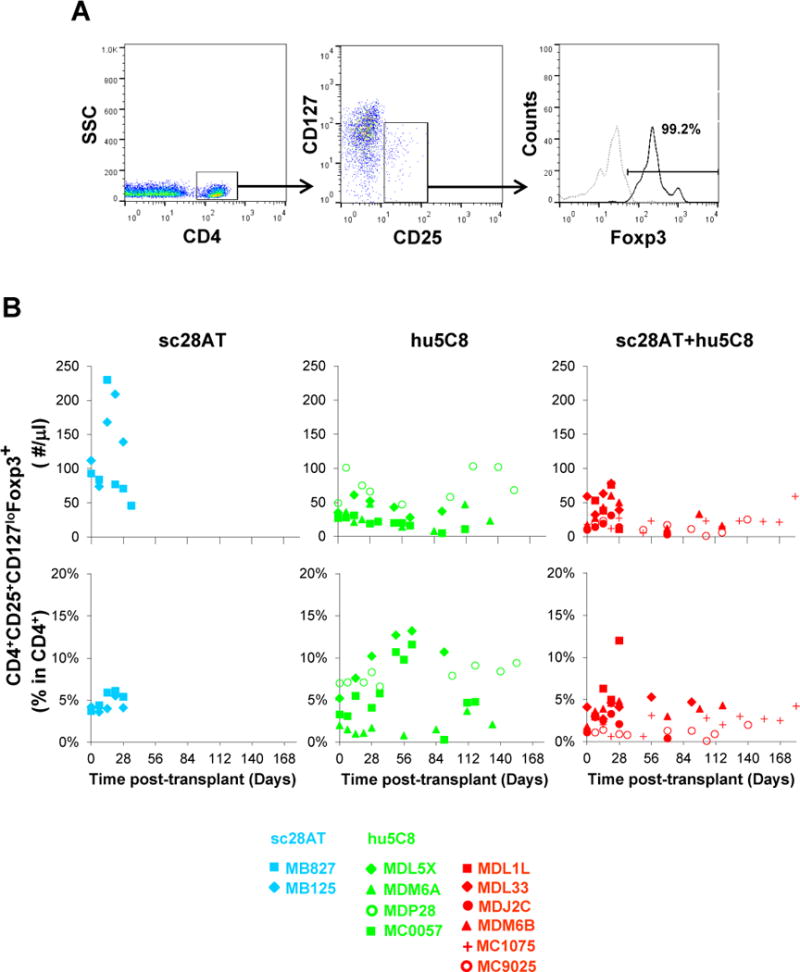
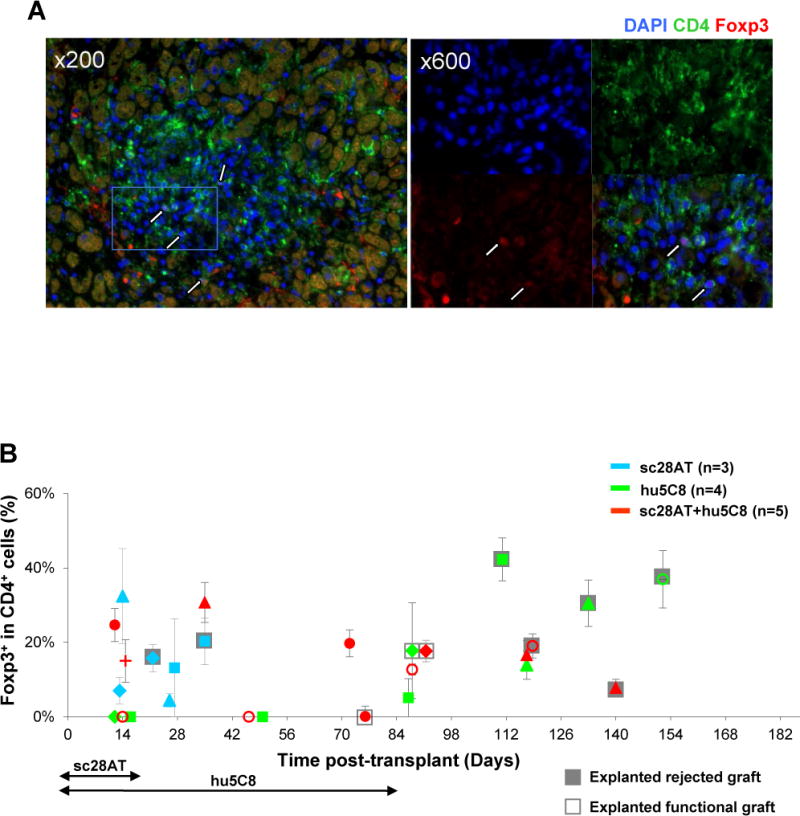
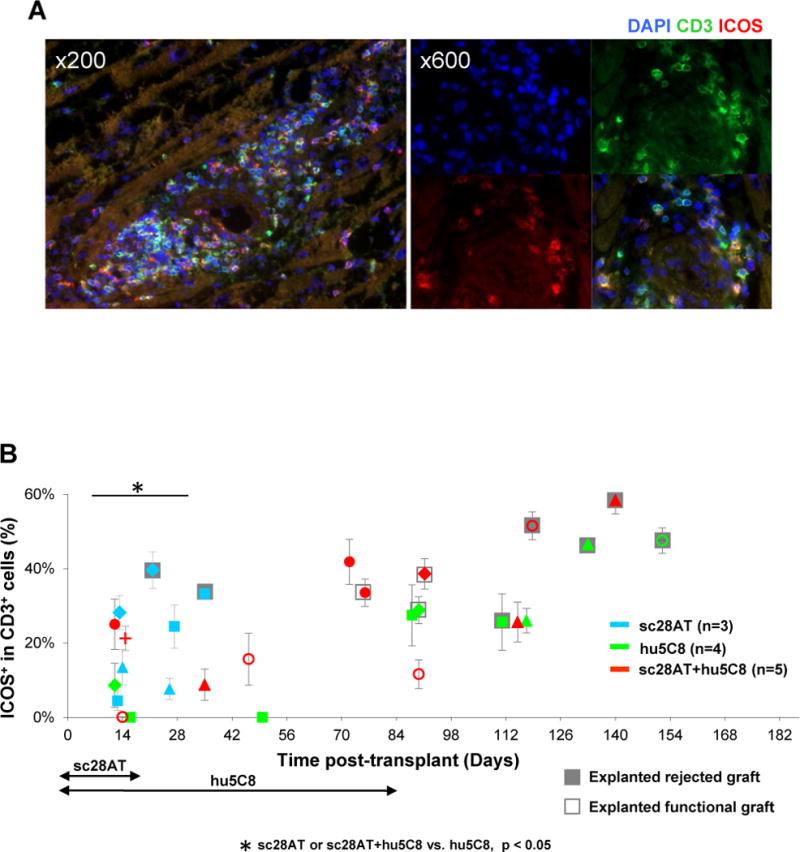
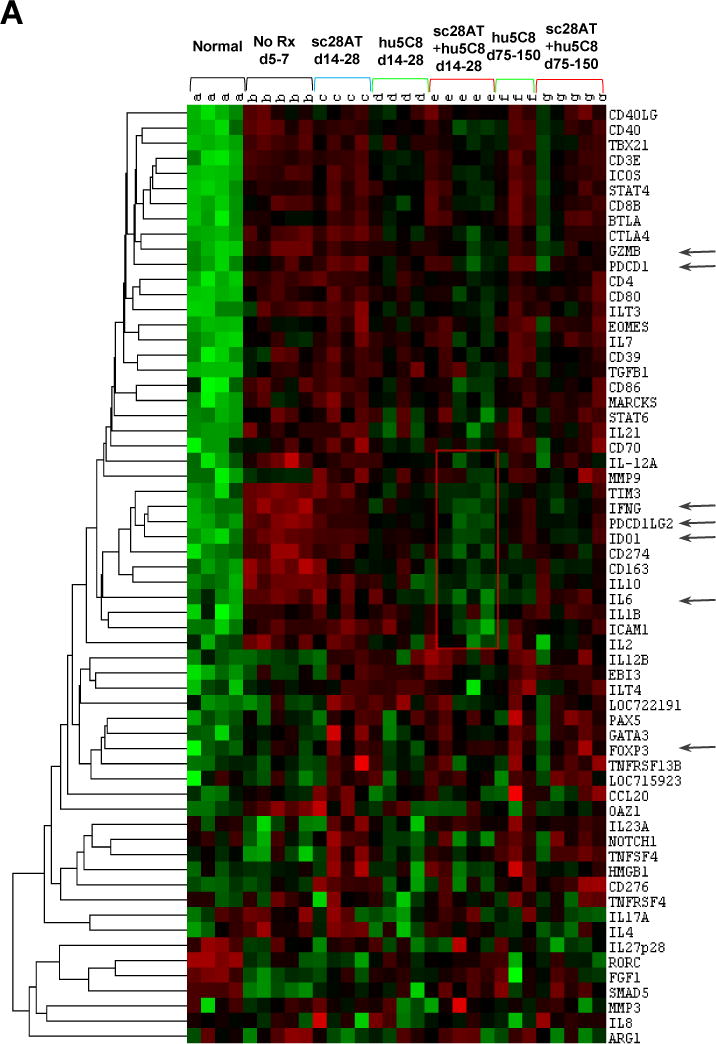
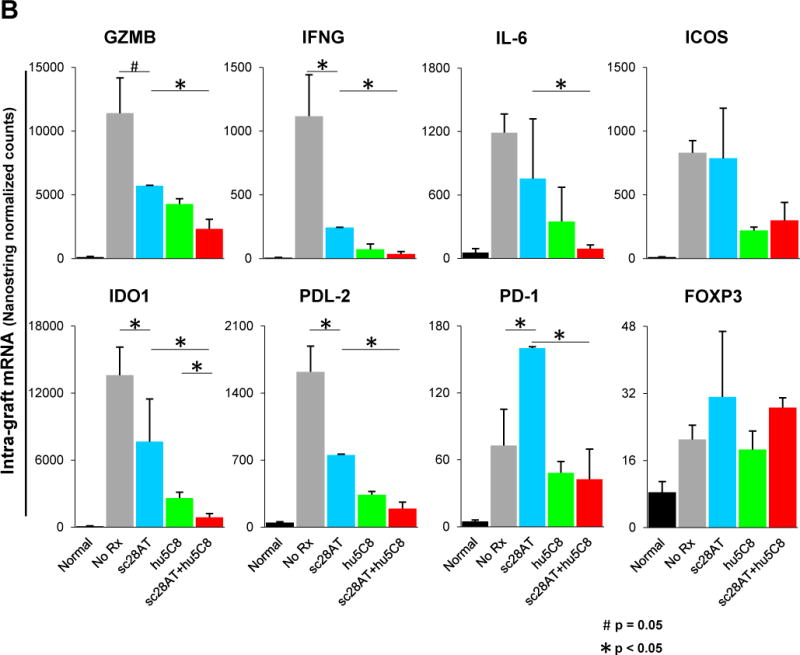
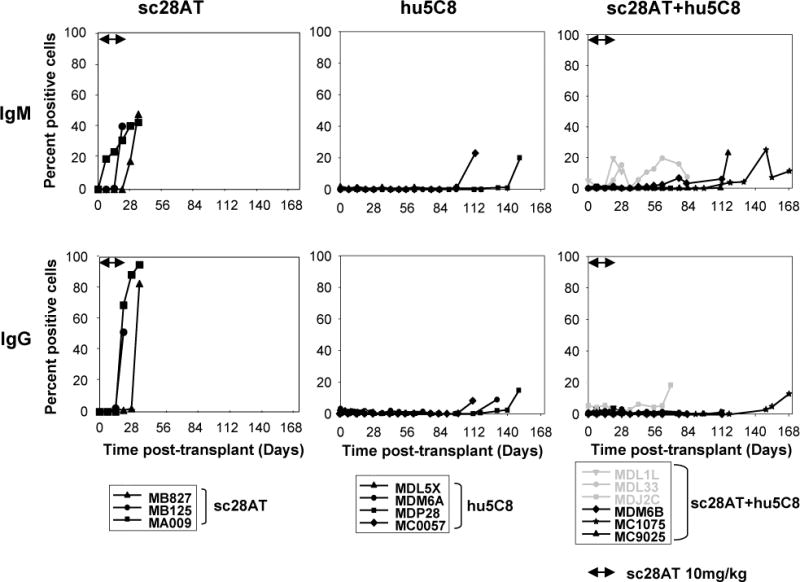
Methods: Cynomolgus monkey heterotopic cardiac allograft recipients received sc28AT (10 mg/kg, d0-20, n = 3), hu5C8 (10-30 mg/kg, d0-84, n = 4), or combination (n = 6). Graft survival was monitored by telemetry. Protocol biopsies and graft explants were analyzed for International Society of Heart and Lung Transplantation acute rejection grade and cardiac allograft vasculopathy score. Alloantibody, T-cell phenotype and regulatory T cells were analyzed by flow cytometry. Immunochemistry and gene expression (NanoString) characterized intra-graft cellular infiltration.

Results: Relative to modest prolongation of median graft survival time with sc28AT alone (34 days), hu5C8 (133 days), and sc28AT + hu5C8 (141 days) prolonged survival to a similar extent. CD28 blockade at induction, added to hu5C8, significantly attenuated the severity of acute rejection and cardiac allograft vasculopathy during the first 3 months after transplantation relative to hu5C8 alone. These findings were associated with decreased proportions of circulating CD8 and CD3CD28 T cells, and modulation of inflammatory gene expression within allografts.

Conclusions: Induction with sc28AT promotes early cardiac allograft protection in hu5C8-treated NHPs. These results support further investigation of prolonged selective CD28 inhibition with CD40/CD154 blockade in NHP transplants.


Conflict of interest statement

Disclosure : The authors declare no conflict of interest.

Figures

Figure 1
Figure 1. Individual graft survival time and histological analysis of monkey cardiac allografts
(A) sc28AT (blue) significantly prolonged allograft survival relative to no treatment (grey) (median survival time (MST), 34 vs. 6 days; P<0.05). There was no statistically significant difference in allograft survival comparing hu5C8-treated recipients (green, MST 133 days) with sc28AT+hu5C8-treated recipients (red, MST 141 days). Vertical hash marks represent animals that died or underwent euthanasia or elective explantation with functional allografts. (B) During the first 3 months after transplantation, ISHLT rejection scores of biopsy and functional (open boxes) or rejected (grey boxes) explanted cardiac allografts were significantly lower in sc28AT+hu5C8 group compared to sc28AT or hu5C8 monotherapy groups. Each dot represents the median of ISHLT scores for 1 tissue specimen. Multiple data points from individual animals over time are represented with a specific symbol, while symbol color identifies treatment group.
Figure 2
Figure 2. Cardiac allograft vasculopathy
(A) Representative vessel from a hu5C8-treated cardiac allograft (day 90, left panel) shows grade 2 cardiac allograft vasculopathy (CAV) with distinct neointimal thickening (10–50% luminal narrowing). In contrast, a representative artery from a sc28AT+hu5C8-treated graft (day 90, right panel) shows absence of neointimal proliferation (H&E staining, original magnification ×200). (B) CAV severity score for biopsy and functional (open boxes) or rejected (grey boxes) explanted cardiac allograft tissue specimens. CAV scores with sc28AT+hu5C8 (red) were significantly lower than with hu5C8 alone (green) during the first 3 months. Each data point represents the median of CAV scores for 1 tissue specimen. Multiple data points from individual animals over time are represented with a specific symbol, while symbol color identifies treatment group.
Figure 3
Figure 3. Peripheral blood T lymphocyte phenotype
The mean (±SEM) of proportions (%) of CD4+ (top), CD8+ (middle), and CD28 (bottom) among CD3+ lymphocytes are shown on the left panels, and absolute numbers in the right panels. Animals treated with sc28AT+hu5C8 (red) maintained lower proportion of CD8+ T cells (p=0.002) and CD28 CD3+ T cells (p=0.046) compared to hu5C8-treated animals (green) during the second month after transplant. Absolute numbers of these 3 T cell populations were similar between the 2 groups.
Figure 4
Figure 4. Quantification of circulating CD4+CD25+CD127lo Foxp3+ Tregs by flow cytometry
(A) Representative flow cytometry analysis of blood putative Tregs in a recipient treated with sc28AT+hu5C8 (MDM6B) at 4 weeks after transplantation when CD4+CD25+CD127loFoxP3+ subset representes 4.8% of total CD4+ cells. Dotted gray line represents the isotype control. (B) Treg absolute numbers (upper panel) and Treg proportion (CD25+CD127loFoxp3+ Tregs as a % among CD4+ cells) (lower panel) generally rose in most animals during the first weeks of treatment, but were similar (not significantly different) between hu5C8 and sc28AT+hu5C8 groups. Color coding (blue, sc28AT; green, hu5C8; red, sc28AT+hu5C8) and recipient-specific symbols are as in Figure 1.
Figure 5
Figure 5. Immunofluorescent staining of graft infiltrating CD4+Foxp3+ T cells
(A) Representative pictures of a cardiac allograft from sc28AT+hu5C8 group (MC9025, d118). Blue, DAPI nuclear staining; green, CD4; red, Foxp3. Several putative Tregs are identified by nuclear staining of Foxp3 surrounded by CD4 staining (white arrows). Original magnification, ×200 (left), × 600 (right). The right panel represents a magnification of the white rectangle indicated in the left panel. (B) Percentages of Foxp3+ cells among CD4+ lymphocytes in graft biopsies and functional (open boxes) or rejected (grey boxes) explanted cardiac allografts. Each dot represents the mean ± SEM of 2~7 fields from the same tissue specimen.
Figure 6
Figure 6. Immunofluorescent staining of intra-graft CD3+ICOS+ T cells
(A) Representative pictures of a cardiac allograft from sc28AT+hu5C8 group (MC9025, d118). Blue, DAPI nuclear staining; green, CD3; red, ICOS. A majority of CD3+ T cells express ICOS in this rejected allograft. (B) Percentages of ICOS+ cells among CD3+ cells in biopsies and explanted cardiac allografts. Each dot represents the mean±SEM of 2~7 fields from the same tissue specimen. *P<0.05 for the comparisons indicated.
Figure 7
Figure 7. Nanostring gene expression analysis
Intra-graft gene expression profiling in naive monkey heart (Normal, n=4), untreated allografts (No Rx, n=5), or allografts from recipients treated with sc28AT (blue, n=4), hu5C8 (green, n=4) or sc28AT+hu5C8 (red, n=5). (A) Heat-map analysis for the entire custom panel of 60 genes. Each column represents 1 allograft tissue specimen. Hu5C8±sc28AT-treated groups were analyzed both during therapy (d14–28 posttransplant) and around the time of hu5C8-therapy withdrawal (d75–150). The rectangular box with red contours in the centre delineates a cluster of genes that tend to be expressed at lower levels in protocol biopsies collected under combined drug treatment (d14–28) than in either monotherapy groups at the same time, and more similar to nontransplanted monkey heart tissue (Normal). Arrows denote 6 most differentially expressed or pathway relevant genes shown in more details in panel B. Results represent the mean ± SEM of normalized counts for each group. (B) During the first month after transplantation, sc28AT is associated with significantly increased expression of GZMB, IFNG, IL-6, IDO1, PDL-2, and PD-1, and MARCKS and CTLA-4 (not illustrated) compared to sc28AT+hu5C8. Expression of ICOS and Foxp3 was increased in rejecting (untreated and sc28AT-treated) allografts and in grafts protected by either hu5C8 alone or sc28AT+hu5C8. Asterisks denote p values < 0.05 between groups for the indicated comparisons, determined using the NanoString nSolver® Analysis Software.
Figure 8
Figure 8. Donor-specific alloantibodies from the day of transplant to graft explant
The presence of IgM (upper panel) and IgG (lower panel) anti-donor serum alloantibodies was measured by flow cytometry. In sc28AT+hu5C8 animals (right panels), weak IgM Abs were detected in recipients that suffered from malaria infection (MDL1L and MDL33, grey lines) and weak IgG Ab was detected in recipient (MDJ2C) on the day of euthanasia due to post biopsy intestinal complication (grey line). Significant (>20%) elaboration of donor-specific antibody was consistently prevented during treatment with either hu5C8 or sc28AT+hu5C8.

References

    1. Ford ML, Adams AB, Pearson TC. Targeting co-stimulatory pathways: transplantation and autoimmunity. Nat Rev Nephrol. 2014;10(1):14. - PMC - PubMed
    1. Adams AB, Ford ML, Larsen CP. Costimulation Blockade in Autoimmunity and Transplantation: The CD28 Pathway. J Immunol. 2016;197(6):2045. - PMC - PubMed
    1. Malvezzi P, Jouve T, Rostaing L. Costimulation Blockade in Kidney Transplantation: An Update. Transplantation. 2016;100(11):2315. - PMC - PubMed
    1. Oshima S, Karrer EE, Kawato Y, et al. The Effect of ASP2409, a Novel CD86-Selective Variant of CTLA4-Ig, on Renal Allograft Rejection in Nonhuman Primates. Transplantation. 2016;100(12):2611. - PubMed
    1. Vincenti F, Rostaing L, Grinyo J, et al. Belatacept and Long-Term Outcomes in Kidney Transplantation. N Engl J Med. 2016;374(4):333. - PubMed

Publication types