. 2018 May 1;163(1):26-34.
doi: 10.1093/toxsci/kfy006.

N-Acetyl-2-Aminofluorene (AAF) Processing in Adult Rat Hepatocytes in Primary Culture Occurs by High-Affinity Low-Velocity and Low-Affinity High-Velocity AAF Metabolite-Forming Systems

Affiliations

N-Acetyl-2-Aminofluorene (AAF) Processing in Adult Rat Hepatocytes in Primary Culture Occurs by High-Affinity Low-Velocity and Low-Affinity High-Velocity AAF Metabolite-Forming Systems

Katherine S Koch et al. Toxicol Sci. .

Abstract

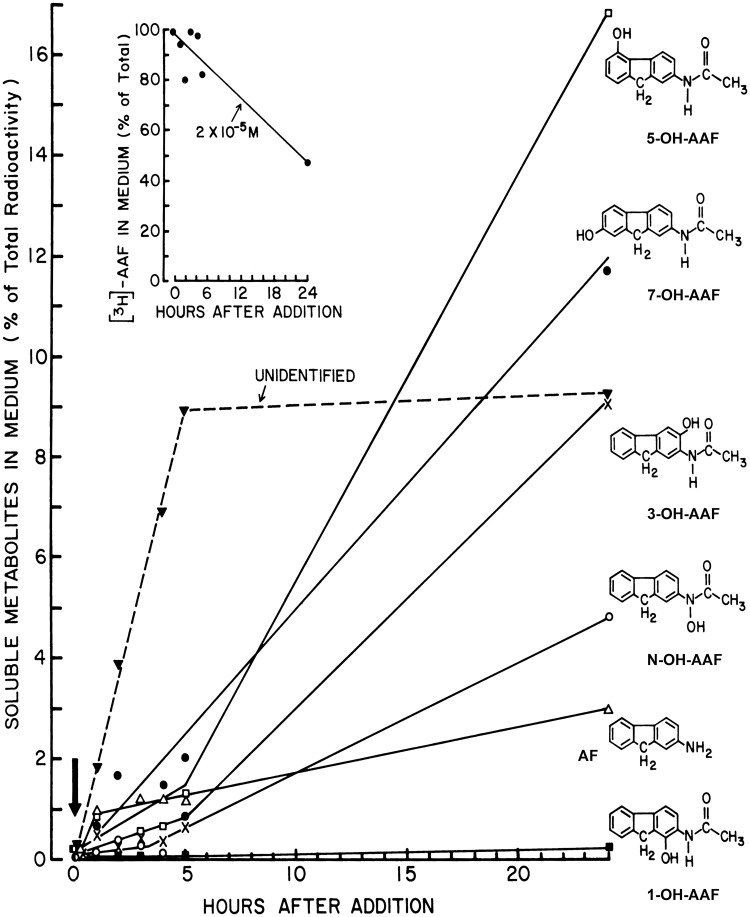
N-acetyl-2-aminofluorene (AAF) is a procarcinogen used widely in physiological investigations of chemical hepatocarcinogenesis. Its metabolic pathways have been described extensively, yet little is known about its biochemical processing, growth cycle expression, and pharmacological properties inside living hepatocytes-the principal cellular targets of this hepatocarcinogen. In this report, primary monolayer adult rat hepatocyte cultures and high specific-activity [ring G-3 H]-N-acetyl-2-aminofluorene were used to extend previous observations of metabolic activation of AAF by highly differentiated, proliferation-competent hepatocytes in long-term cultures. AAF metabolism proceeded by zero-order kinetics. Hepatocytes processed significant amounts of procarcinogen (≈12 μg AAF/106 cells/day). Five ring-hydroxylated and one deacetylated species of AAF were secreted into the culture media. Extracellular metabolite levels varied during the growth cycle (days 0-13), but their rank quantitative order was time invariant: 5-OH-AAF > 7-OH-AAF > 3-OH-AAF > N-OH-AAF > aminofluorene (AF) > 1-OH-AAF. Lineweaver-Burk analyses revealed two principal classes of metabolism: System I (high-affinity and low-velocity), Km[APPARENT] = 1.64 × 10⁻⁷ M and VMAX[APPARENT] = 0.1 nmol/106 cells/day and System II (low-affinity and high-velocity), Km[APPARENT] = 3.25 × 10⁻⁵ M and VMAX[APPARENT] = 1000 nmol/106 cells/day. A third system of metabolism of AAF to AF, with Km[APPARENT] and VMAX[APPARENT] constants of 9.6 × 10⁻⁵ M and 4.7 nmol/106 cells/day, was also observed. Evidence provided in this report and its companion paper suggests selective roles and intracellular locations for System I- and System II-mediated AAF metabolite formation during hepatocarcinogenesis, although some of the molecules and mechanisms responsible for multi-system processing remain to be fully defined.


Figures

Figure 1.
Figure 1.
Uptake of N-acetyl-2-aminofluorene (AAF) from culture media. Acid-soluble [14 C]-AAF was measured in days 3–4 cultures (N0 = 3.5 × 105 cells/dish) following a 24 h exposure to a range of extracellular AAF concentrations (6 × 10−8–2 × 10−5 M). Two independent platings were performed (•, ). The results are expressed as soluble fluorene residues (µM/106 cells/24 h) on the y-axis, as a function of the added AAF concentrations on the x-axis. The data were analyzed by linear regression: r = 0.98 (p < .0001).
Figure 2.
Figure 2.
Nature and rates of secretion of AAF metabolites. Three-day-old cultures (N0 = 4.0 × 105 cells/dish) were incubated with 40 nmol [3 H]-AAF (4000 dpm pmol−1) per 2 ml medium per dish (initial AAF concentration = 2 × 10−5 M). Culture fluids were sampled at the indicated times between zero (↓) at the start of incubation and 24 h (x-axis), and analyzed for AAF disappearance (inset), and H2O-soluble hydroxylated and deacetylated metabolites (y-axis), as described in the Materials and Methods section. Each curve is annotated with a contiguous diagram of the structure of each metabolite: , 5-OH-AAF; , 7-OH-AAF; , unidentified at solvent front; X, 3-OH-AAF; O, N-OH-AAF; Δ, AF; and, , 1-OH-AAF (top to bottom). Parameters obtained from linear regression analysis of the inset curve: r = 0.92 (p < .002).
Figure 3.
Figure 3.
Growth cycle dependence of AAF binding and AAF metabolite secretion. Hepatocytes were plated exactly as described in the Primary hepatocyte culture section. On days 4, 8, or 12 postplating (x-axis [Days After Plating]), the initial plating media were removed and replaced with 2 ml fresh plating media supplemented with 2 × 10−4 M [3 H]-AAF. These culture media were harvested 24 h later on days 5, 9, or 13 per time point (x-axis). A, Acid-insoluble fluorene residues (y-axis, top; picomoles/106 cells/24 h). B, Soluble metabolites in the medium (y-axis, bottom; picomoles/106 cells/24 h), isolated by thin layer chromatography as described in the Materials and Methods section (individual metabolites are annotated for each curve). The relative production capacity (%) over the 5- to 13-day period was determined for each metabolite at each time point from the equation: (100 – [{(% production)MEASUREMENT DAY – (% production)DAY 5}/{(% production)DAY 5}]) × (100).
Figure 4.
Figure 4.
AAF metabolite secretion as a function of the initial AAF concentration. Day 3 cultures (N0 = 3.5 × 105 cells/dish) were incubated for a 24 h period with [14 C]-AAF (6 × 10−8– 2 × 10−5 M), at which time the metabolites in the medium were measured. Symbols are the same as those annotated in Figure 5. [S], Concentration of soluble metabolites in the medium (y-axis; picomoles/106 cells/24 h). Initial molarity of extracellular [14 C]-AAF (x-axis).
Figure 5.
Figure 5.
Lineweaver-Burk analyses of AAF metabolite secretion. The 24 h data points were taken from 4-day-old cultures in Figure 4. These data were plotted as: 1/v (y-axis), with v = picomoles/106 cells/24 h; and 1/[S] (x-axis), with [S] = initial molarity of extracellular [14 C]-AAF. Metabolites are annotated for each curve in the figure.
Figure 6.
Figure 6.
In situ autoradiography of covalently bound metabolites of AAF in day 13 cultures. Hepatocytes were plated exactly as described in the Primary hepatocyte culture section. Twelve days postplating, the initial plating media were removed and the culture fluids were replaced with 2 ml fresh plating media supplemented with 70 µCi of [3 H]-AAF (2 × 10−5 M). Twenty-four hours later, the media were aspirated and the cultures were washed 6× with 2 ml Tris-HCl buffer, pH 7.4, and prepared for autoradiography by fixation with neutral buffered formalin, followed by an 80 days exposure at 4°C in darkness; and subsequent development (Koch and Leffert, 1974). A representative photomicrograph of an unstained culture is shown in the left-hand panel. The short thick arrow (upper left corner) points to a very sparsely labeled nonparenchymal cell. The INSET, enlarged in the right-hand panel, shows [3 H]-fluorene labeled metaphase (M) chromosomes (long arrows pointing to dark linear structures tilted 45° leftward inside hepatocytes); and G0 cells (long arrows pointing to hepatocytes with densely labeled cytoplasm, and to nuclei with reduced levels of centrally located grains). The horizontal bars at the top of each panel give the dimensions in microns along the surface of the monolayer. (Modified from Koch and Leffert, 1980, and used by permission of John Wiley and Sons.)

Similar articles

Cited by

References

    1. Allorge D., Chevalier D., Lo-Guidice J. M., Cauffiez C., Suard F., Baumann P., Eap C. B., Broly F. (2003). Identification of a novel splice-site mutation in the CYP1A2 gene. Br. J. Clin. Pharmacol. 56, 341–344. - PMC - PubMed
    1. American Cancer Society. (2018). Liver Cancer. http://www.cancer. org/acs/groups/cid/documents/webcontent/003114-pdf.pdf
    1. Annalora A. J., Marcus C. B., Iversen P. L. (2017). Alternative splicing in the cytochrome P450 superfamily expands protein diversity to augment gene function and redirect human drug metabolism. Drug Metab. Dispos. 45, 375–389.http://dx.doi.org/10.1124/dmd.116.073254 - DOI - PubMed
    1. Aström A., Birberg W., Pilotti A., DePierre J. W. (1986). Induction of different isozymes of cytochrome P-450 and of microsomal epoxide hydrolase in rat liver by 2-acetylaminofluorene and structurally related compounds. Eur. J. Biochem. 154, 125–134. - PubMed
    1. Bartsch H., Dworkin M., Miller J. A., Miller E. C. (1972). Electrophilic N-acetoxyaminoarenes derived from carcinogenic N-hydroxy-N-acetylaminoarenes by enzymatic deacetylation and transacetylation in liver. Biochim. Biophys. Acta 286, 272–298. - PubMed

Publication types