. 2018 Jan 10;18(1):175.
doi: 10.3390/s18010175.

The Feasibility and Usability of RunningCoach: A Remote Coaching System for Long-Distance Runners

Affiliations

The Feasibility and Usability of RunningCoach: A Remote Coaching System for Long-Distance Runners

Daniel Aranki et al. Sensors (Basel). .

Abstract

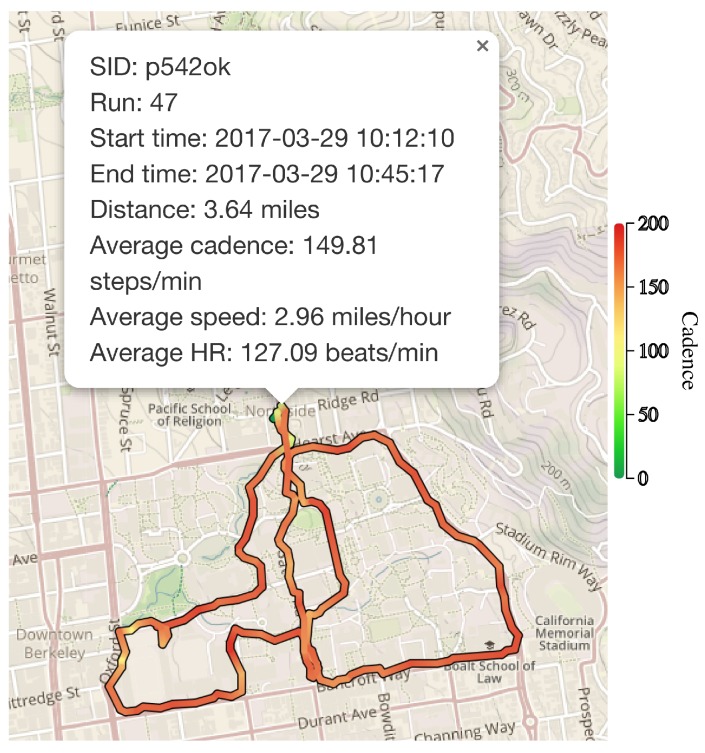
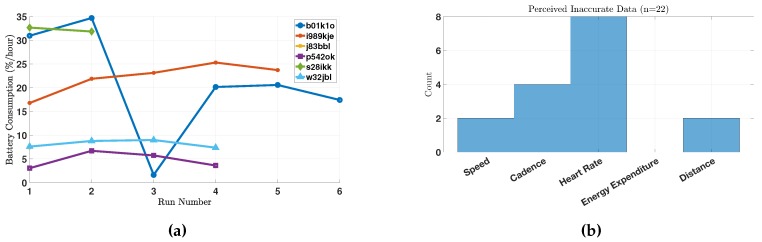
Studies have shown that about half of the injuries sustained during long-distance running involve the knee. Cadence (steps per minute) has been identified as a factor that is strongly associated with these running-related injuries, making it a worthwhile candidate for further study. As such, it is critical for long-distance runners to minimize their risk of injury by running at an appropriate running cadence. In this paper, we present the results of a study on the feasibility and usability of RunningCoach, a mobile health (mHealth) system that remotely monitors running cadence levels of runners in a continuous fashion, among other variables, and provides immediate feedback to runners in an effort to help them optimize their running cadence.

Keywords: cadence; elevation change analysis; marathon; remote coaching; telehealth; telemonitoring.


Conflict of interest statement

The authors declare no conflict of interest. The funding sponsors had no role in the design of the study; in the collection, analyses or interpretation of data; in the writing of the manuscript; nor in the decision to publish the results.

Figures

Figure 1
Figure 1
(a) A screenshot depicting the physique profile screen; (b) a screenshot depicting an exponential cadence training regimen; and (c) a screenshot depicting a linear training regimen [11].
Figure 2
Figure 2
(a) A screen showing some of the run-statistics after a run; and (b) an example of a question in the post-run survey [11].
Figure 3
Figure 3
(a) A screenshot of the home screen of RunningCoach, summarizing the past runs; (b) a screenshot from the app during a run showing the cadence significantly lower than its target value (outside the 10% range of the target cadence); and (c) a screenshot from the app during the run showing the speed within acceptable range of its target value (within 10% of the target speed) [11].
Figure 4
Figure 4
An example plot from the dashboard, depicting the estimated cadence during runs 11, 22 and 26 by subjects s28ikk, p542ok and i989kje, respectively [11].
Figure 5
Figure 5
An example plot of the path of run 47 by subject p542ok.
Figure 6
Figure 6
(a) The durations of the different runs as observed in each subject (N=22); and (b) the total distances of the different runs as observed in each subject (N=20).
Figure 7
Figure 7
(a) The deviation of the average cadence from the target cadence for each run, expressed in percentage points (N=22); and (b) subject-reported level of fatigue after each run. A value of three represents the level of fatigue reported after an average run; a value of one is least fatigued; and value five is most fatigued after an average run (N=22).
Figure 8
Figure 8
(a) The amount of battery consumption (in %) per hour during the different runs by the different subjects (N=22); and (b) the perceived accuracy of the collected data by the runners (N=22).
Figure 9
Figure 9
(a) The estimated speed (m/s) during run 54 by subject b01k1o; and (b) the estimated cadence (steps/min) during run 54 by subject b01k1o.
Figure 10
Figure 10
The results from the acceptability portion of the post-study questionnaire (N=6). SD = “strongly disagree”, D = “disagree”, N = “neutral”, A = “agree” and SA =“strongly agree” [47].
Figure 11
Figure 11
The responses to the privacy portion of the post-study questionnaire about the subjects’ comfort levels sharing different data variables with different parties (N=6) [47].
Figure 12
Figure 12
The relationship between elevation changes (ascending/descending), cadence and speed for runs 50 and 52 by subjects i989kje and b01k1o, respectively.

References

    1. Van Gent B.R., Siem D.D., van Middelkoop M., van Os T.A., Bierma-Zeinstra S.S., Koes B.B. Incidence and determinants of lower extremity running injuries in long distance runners: A systematic review. Br. J. Sports Med. 2007;41:469–480. doi: 10.1136/bjsm.2006.033548. - DOI - PMC - PubMed
    1. Heiderscheit B.C., Chumanov E.S., Michalski M.P., Wille C.M., Ryan M.B. Effects of step rate manipulation on joint mechanics during running. Med. Sci. Sports Exerc. 2011;43:296–302. doi: 10.1249/MSS.0b013e3181ebedf4. - DOI - PMC - PubMed
    1. Rowlands A.V., Eston R.G., Tilzey C. Effect of stride length manipulation on symptoms of exercise-induced muscle damage and the repeated bout effect. J. Sports Sci. 2001;19:333–340. doi: 10.1080/02640410152006108. - DOI - PubMed
    1. Hamill J., Derrick T.R., Holt K.G. Shock attenuation and stride frequency during running. Hum. Mov. Sci. 1995;14:45–60. doi: 10.1016/0167-9457(95)00004-C. - DOI
    1. Mapmyfitness. [(accessed on 1 December 2017)]; Available online: www.mapmyfitness.com.