. 2018 Jan 18;553(7688):347-350.
doi: 10.1038/nature25187. Epub 2018 Jan 10.

High response rate to PD-1 blockade in desmoplastic melanomas

Affiliations

High response rate to PD-1 blockade in desmoplastic melanomas

Zeynep Eroglu et al. Nature. .

Abstract

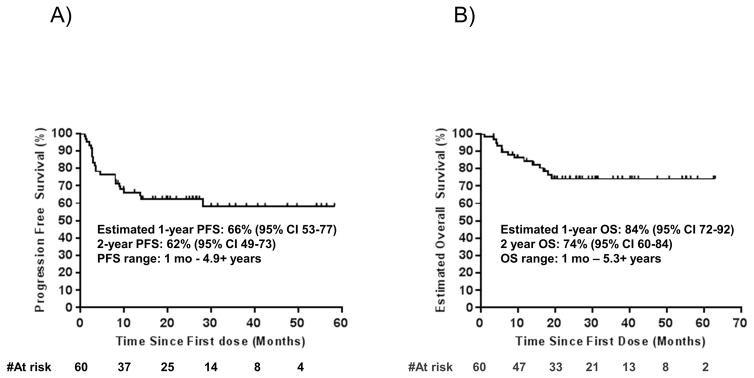
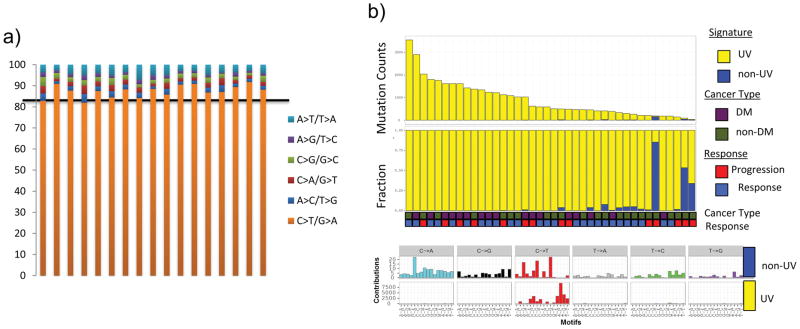
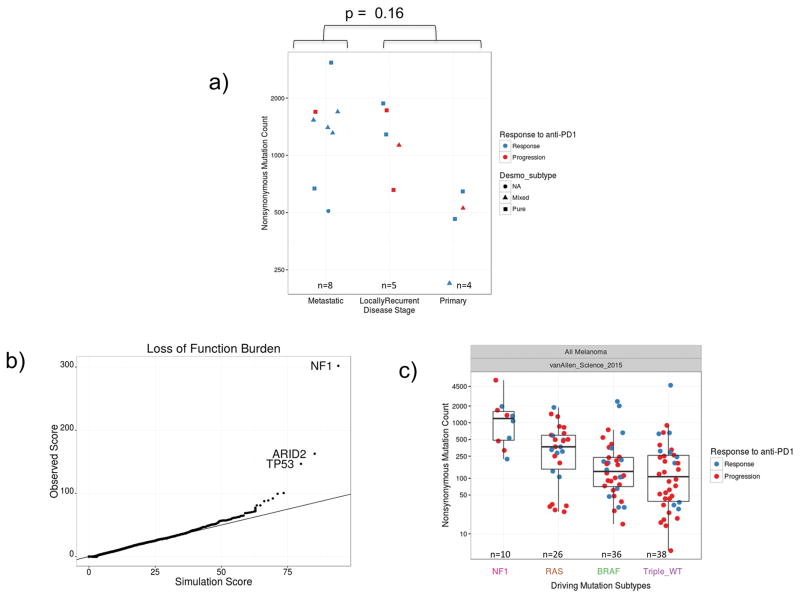
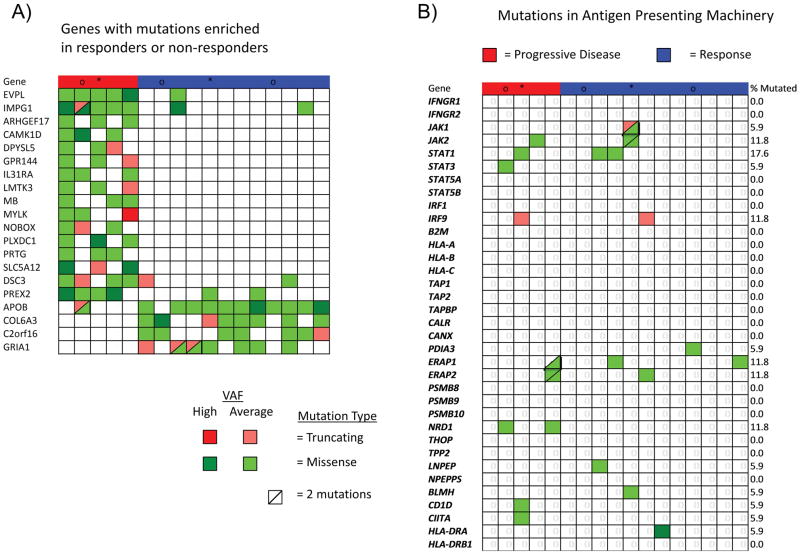
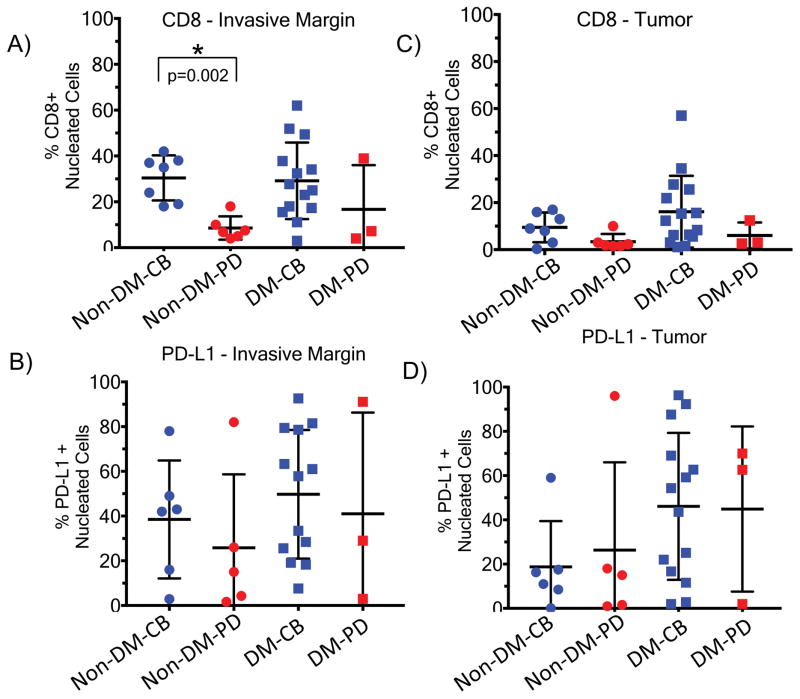
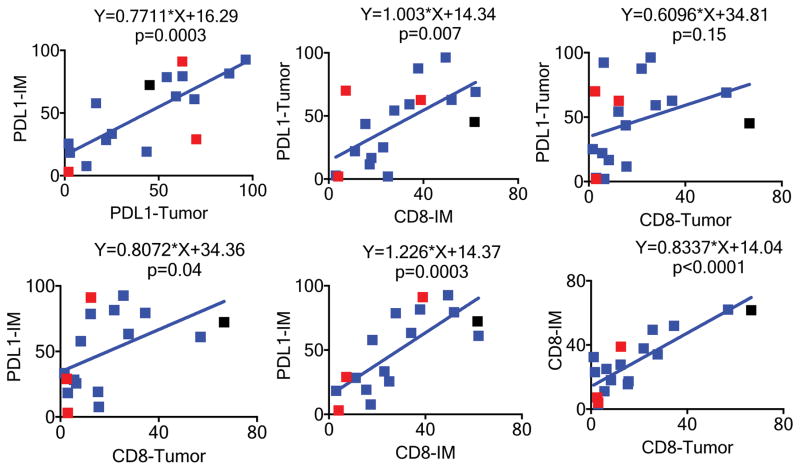
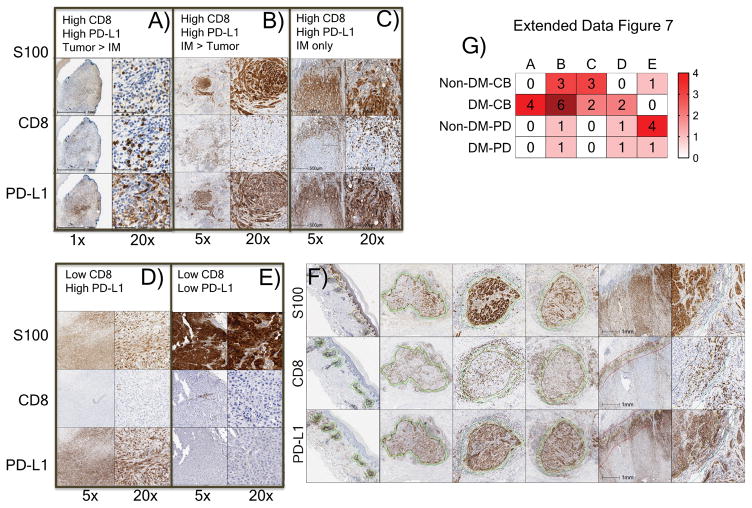
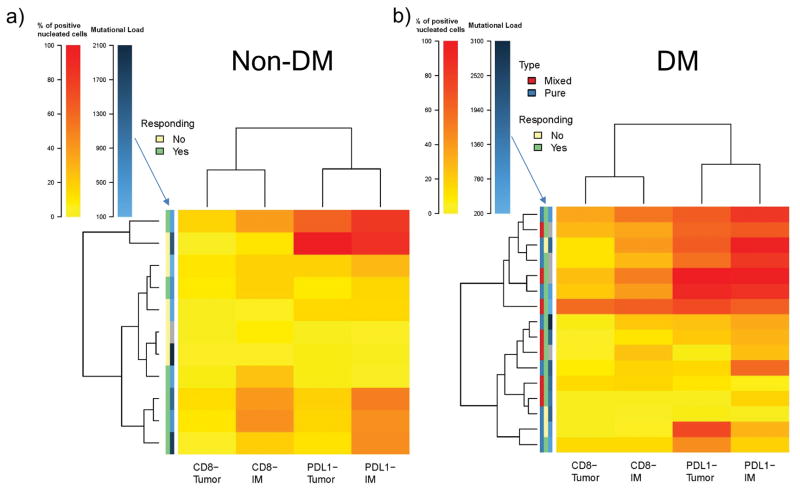
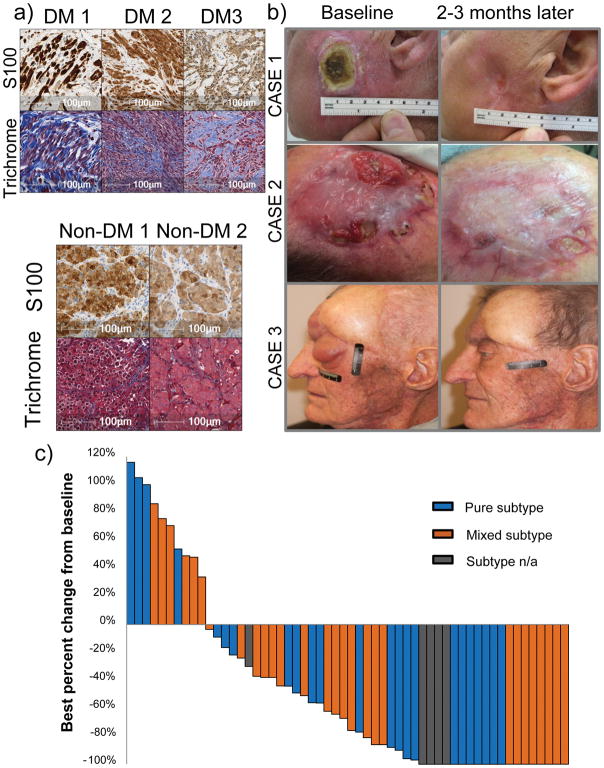
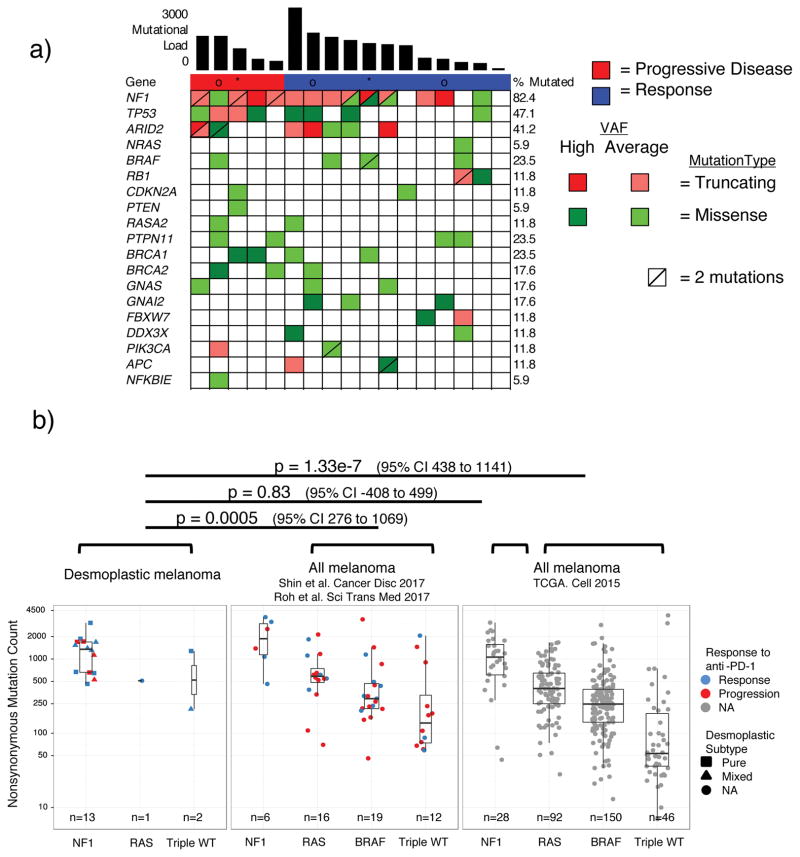
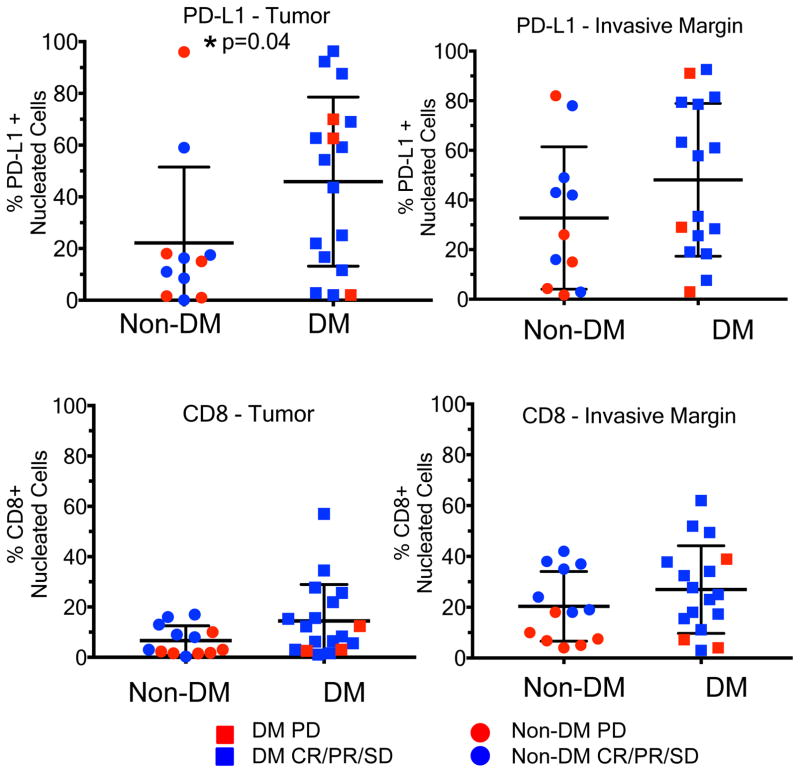
Desmoplastic melanoma is a rare subtype of melanoma characterized by dense fibrous stroma, resistance to chemotherapy and a lack of actionable driver mutations, and is highly associated with ultraviolet light-induced DNA damage. We analysed sixty patients with advanced desmoplastic melanoma who had been treated with antibodies to block programmed cell death 1 (PD-1) or PD-1 ligand (PD-L1). Objective tumour responses were observed in forty-two of the sixty patients (70%; 95% confidence interval 57-81%), including nineteen patients (32%) with a complete response. Whole-exome sequencing revealed a high mutational load and frequent NF1 mutations (fourteen out of seventeen cases) in these tumours. Immunohistochemistry analysis from nineteen desmoplastic melanomas and thirteen non-desmoplastic melanomas revealed a higher percentage of PD-L1-positive cells in the tumour parenchyma in desmoplastic melanomas (P = 0.04); these cells were highly associated with increased CD8 density and PD-L1 expression in the tumour invasive margin. Therefore, patients with advanced desmoplastic melanoma derive substantial clinical benefit from PD-1 or PD-L1 immune checkpoint blockade therapy, even though desmoplastic melanoma is defined by its dense desmoplastic fibrous stroma. The benefit is likely to result from the high mutational burden and a frequent pre-existing adaptive immune response limited by PD-L1 expression.


Conflict of interest statement

Authors declare no completing financial interests.

Figures

Extended Data Figure 1
Extended Data Figure 1. Survival data of the desmoplastic melanoma cohort
A) Progression free survival (PFS), n = 60, median not reached. B) Overall survival (OS), n=60, median not reached.
Extended Data Figure 2
Extended Data Figure 2. Ultraviolet light DNA damage signature in the desmoplastic melanoma cohort
A) Cumulative percentage per DM sample (n=17) of single nucleotide mutations by transition/transversion substitution. B) Mutation signature analysis on combined DM (n=17) and non-DM (n=23) cohort. All show the predominant C>T rich signature 7 characteristic of UV damage.
Extended Data Figure 3
Extended Data Figure 3. Mutational analysis in the desmoplastic melanoma cohort
A) Analysis of mutational load in samples obtained from primary locally advanced cases and metastatic lesions. Two sided Wilcoxon-Mann-Whitney rank sum test, p = 0.16 (95% CI −171 to 1175). B) Scores from the loss-of-function (LOF) SigRank algorithm show enrichment for LOF mutations (nonsense, frameshift, splice-site or damaging missense) compared to the expected number based on the rate of LOF mutations in the cohort. Solid line corresponds to observed/expected ratio of 1.0. C) Mutational load in the vanAllen anti-CTLA4 treated cohort separated by driver subtype and coloured by response. In the box plots, line = median, box = 25th/75th percentile, whiskers = highest/lowest value within 1.5*interquartile range.
Extended Data Figure 4
Extended Data Figure 4. Mutations in antigen presenting machinery or enriched by response in the desmoplastic melanoma cohort
A) Mutations in genes enriched in responders (n=12) (blue) or non-responders (n=5) (red). Shown are genes with p < 0.05 by unadjusted two-sided Fisher’s exact test of samples with or without a non-synonymous mutation between responders and non-responders. B) Mutations in antigen presenting machinery genes. P-values = Unadjusted Fisher exact test of number of samples with a non-synonymous mutation per gene, cutoffs 0.015 for and 0.05. Tiling plot shows mutations in a given gene (rows) per sample (columns). Colour indicates mutation type, with truncating mutations (frameshift, nonsense, splice-site) in red, missense in green, and synonymous in beige. Darker colour intensity indicates potentially homozygous mutations, with variant allele frequency >1.5 times the sample median.
Extended Data Figure 5
Extended Data Figure 5. CD8 density and PD-L1 expression in the tumour parenchyma and invasive margins in biopsies of patients with desmoplastic and non-desmoplastic melanoma
A) CD8 staining in the invasive margin. B) PD-L1 staining in the invasive margin. C) CD8 staining in the tumour centre. D) PD-L1 staining in the tumour centre. Percentage of positively stained cells in all nucleated cells are presented. CB: clinical benefit; PD: progressive disease; SD: stable disease; CR: complete response; PR: partial response. All calculations used two-sided Mann-Whitney rank sum test. See supplementary table for all statistical analyses. * Indicates statistical significance.
Extended Data Figure 6
Extended Data Figure 6. Correlation of CD8 and PD-L1 in the invasive margin or tumour parenchyma in desmoplastic melanoma
IM: Invasive margin; Centre: tumour centre. Black square: This sample was from a patient who had a great response in the lesion biopsied (analyzed) but was found to have brain metastasis shortly after treatment started. See supplementary table for further statistical analyses.
Extended Data Figure 7
Extended Data Figure 7. Patterns of CD8 infiltration and PD-L1 expression in biopsies of patients with desmoplastic melanoma (DM) and non-desmoplastic cutaneous melanoma (non-DM)
Using cut off of >10% for high CD8 density in either parenchyma or invasive margins and >15% for high PD-L1 expression, five different patterns were identified: A) High CD8 density, high PD-L1 tumour parenchyma > invasive margins. B) High CD8 density, high PD-L1 invasive margins > tumour parenchyma. C) High CD8 density, high PD-L1 in the invasive margins only. D) Low CD8 density, high PD-L1. E) Low CD8 density, low PD-L1 expression. F) Yellow lines delineated the edges of tumour regions determined by positive S100 staining. Green or red lines marked the invasive margins around the tumour edges. All analysis was done with the HALO software (Indica Labs). G) Heat map summary of patterns of CD8 and PD-L1 expression in biopsies of patients with DM and CM based on their response to therapy with anti-PD-1/L1; CB: clinical benefit; PD: progressive disease. Intensity of colour coding indicates number of cases in each category. All calculations were based on the scanned whole tumor images.
Extended Data Figure 8
Extended Data Figure 8. Hierarchical clustering of cases of desmoplastic melanoma and non-desmoplastic cutaneous melanoma based on CD8 and PD-L1 expression in the invasive margin and tumour parenchyma
A) Non-desmoplastic cutaneous melanomas (n=13), with the y axis colour coded for response and mutational load. B) Desmoplastic melanomas (n=19), with the additional information of differentiation between pure (red) and mixed (blue) histology in the y axis. For mutational load, darker squares correspond to higher mutational load. Gray squares are missing data points.
Figure 1
Figure 1. High response rate to PD-1 blockade in patients with desmoplastic melanoma (DM)
A) Histological examples of three cases of DM compared with two cases of non-desmoplastic cutaneous melanoma (non-DM) stained with Masson’s Trichrome stain to highlight the collagenous stroma characteristic of DM. Top panel: S100 stains (brown). Lower panel: Masson’s trichrome stain (blue collagenous stroma, red cytoplasm and brown nucleus). B) Images of three cases of DM with response to anti-PD-1/L1 therapy. Left: baseline images; right: images while on anti-PD-1 therapy. Of note, case #1 had already been depicted in reference. C) Waterfall plot of best response on therapy of 56 patients with DM treated with anti-PD-1 or anti-PD-L1 antibodies (data was not available for 4 patients, three who had progressive disease and one who had a partial response).
Figure 2
Figure 2. High mutational load and similarity to NF1 subtype in desmoplastic melanoma (DM)
A) Top bar graph represents mutational load. Tiling plot shows mutations in a given gene (rows) per sample (columns). In the tiling plot, top line represents response, as either primary resistance/progressive disease (red), n=5, or response (partial or complete response and stable disease > 12 months, dark blue), n=12. Colour indicates mutation type, with truncating mutations (frameshift, nonsense, splice-site) in red, missense in green, and synonymous in beige. Darker colour intensity indicates potentially homozygous mutations, with variant allele frequency >1.5 times the sample median. * = biopsy from responding lesion despite a mixed response and eventual progression. o = patient showed no evidence of disease for > 1year after surgical resection of a progressing lesion. B) Non-synonymous mutations determined by whole exome sequencing (WES) from the current DM cohort, two pooled studies of anti-PD1 treated cutaneous melanoma, and TCGA data. Each cohort is split by driver mutation subtype, colour indicates PD1 blockade therapy response (red = progression, blue = response), and shape represents desmoplastic pure vs mixed subtype. In the box plots, line = median, box = 25th/75th percentile, whiskers = highest/lowest value within 1.5*interquartile range. P values = two-sided Wilcoxon-Mann-Whitney rank sum test.
Figure 3
Figure 3. CD8 density and PD-L1 expression in the tumour parenchyma and invasive margins in biopsies of patients with desmoplastic (DM) and non-desmoplastic cutaneous melanoma (non-DM)
A) PD-L1 staining in the tumour centre (non-DM: 1CR/5PR/5PD; DM: 7CR/6PR/1SD/3PD). B) CD8 staining in the tumour centre (non-DM: 2CR/5PR/6PD; DM: 7CR/7PR/1SD/3PD). C) PD-L1 staining in the invasive margin (non-DM: 1CR/5PR/5PD; DM: 6CR/6PR/1SD/3PD). D) CD8 staining in the invasive margin (non-DM: 2CR/5PR/6PD; DM: 6CR/7PR/1SD/3PD). Percentage of positively stained cells in all nucleated cells are presented. PD: progressive disease; SD: stable disease; CR: complete response; PR: partial response. * Indicates statistical significance. See supplementary table for all statistical analyses.

Comment in

References

    1. Shain AH, et al. Exome sequencing of desmoplastic melanoma identifies recurrent NFKBIE promoter mutations and diverse activating mutations in the MAPK pathway. Nature genetics. 2015;47:1194–1199. doi: 10.1038/ng.3382. - DOI - PMC - PubMed
    1. Ribas A, et al. Association of Pembrolizumab With Tumor Response and Survival Among Patients With Advanced Melanoma. Jama. 2016;315:1600–1609. doi: 10.1001/jama.2016.4059. - DOI - PubMed
    1. Rizvi NA, et al. Cancer immunology. Mutational landscape determines sensitivity to PD-1 blockade in non-small cell lung cancer. Science (New York, NY) 2015;348:124–128. doi: 10.1126/science.aaa1348. - DOI - PMC - PubMed
    1. Le DT, et al. PD-1 Blockade in Tumors with Mismatch-Repair Deficiency. The New England journal of medicine. 2015;372:2509–2520. doi: 10.1056/NEJMoa1500596. - DOI - PMC - PubMed
    1. Hugo W, et al. Genomic and Transcriptomic Features of Response to Anti-PD-1 Therapy in Metastatic Melanoma. Cell. 2016;165:35–44. doi: 10.1016/j.cell.2016.02.065. - DOI - PMC - PubMed

Publication types

MeSH terms