. 2018 Jan 18;553(7688):351-355.
doi: 10.1038/nature25170. Epub 2018 Jan 10.

Pharmacological activation of REV-ERBs is lethal in cancer and oncogene-induced senescence

Affiliations

Pharmacological activation of REV-ERBs is lethal in cancer and oncogene-induced senescence

Gabriele Sulli et al. Nature. .

Abstract

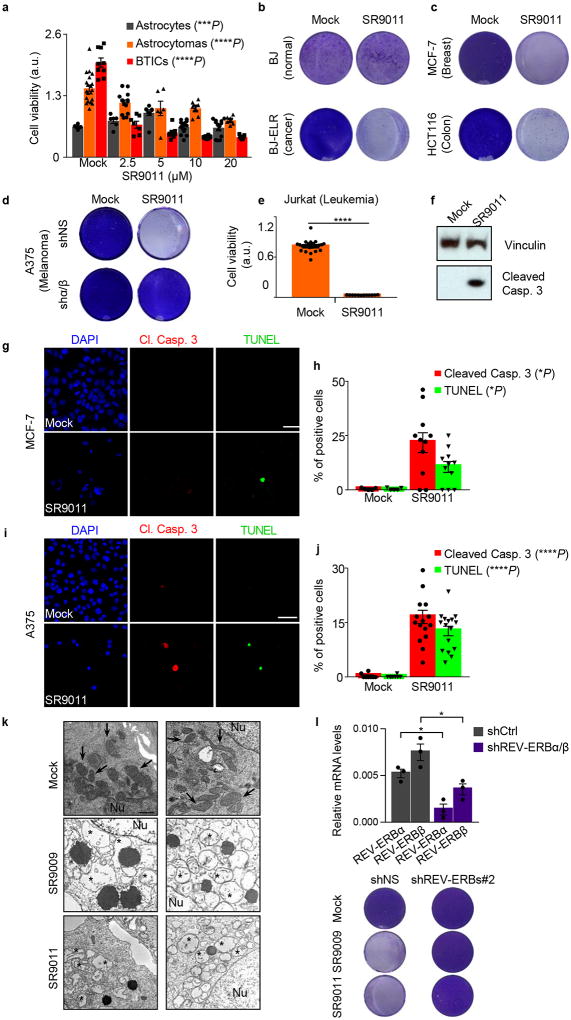
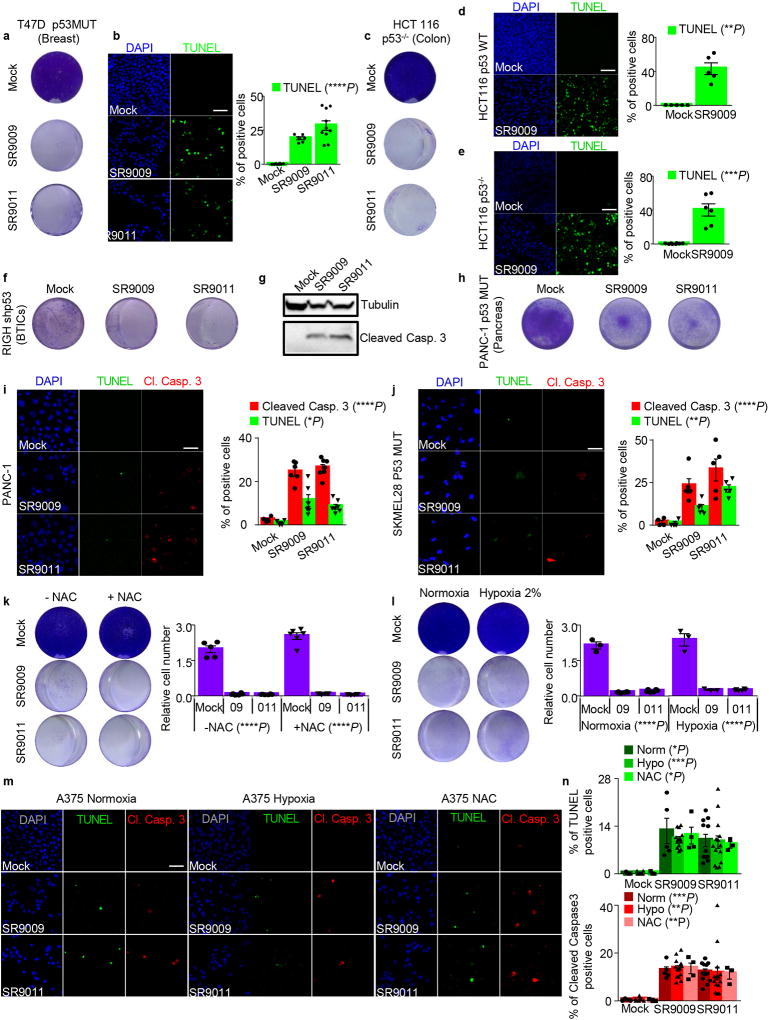
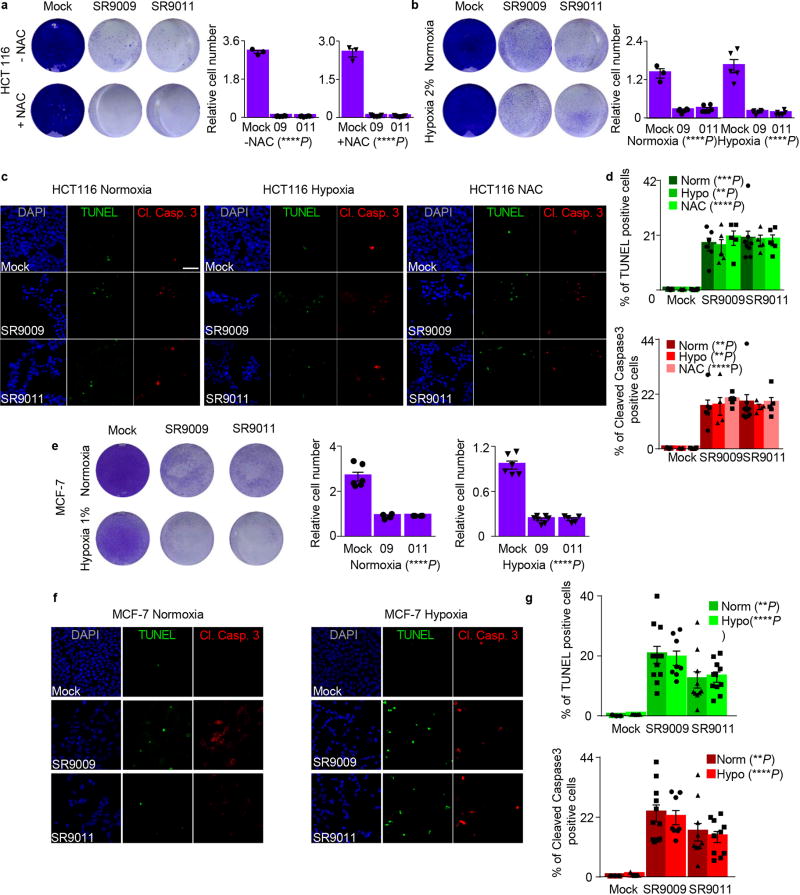
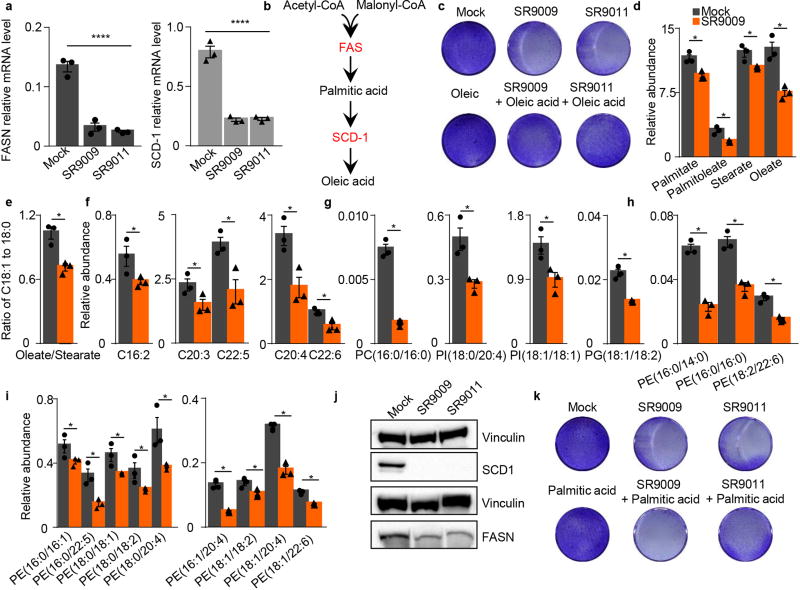
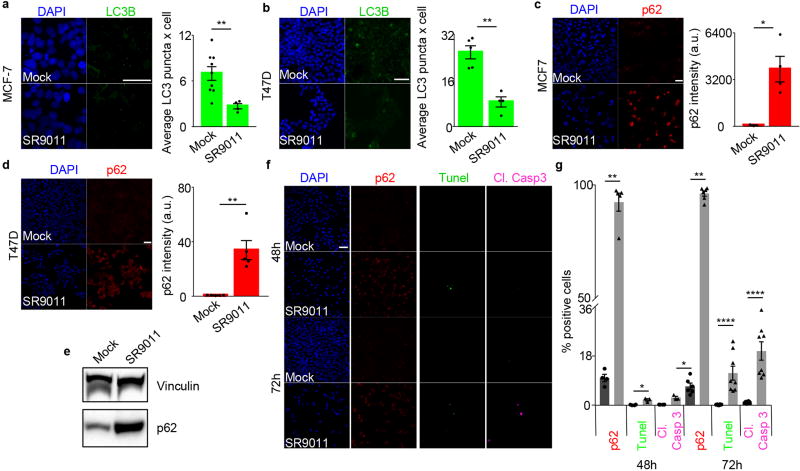
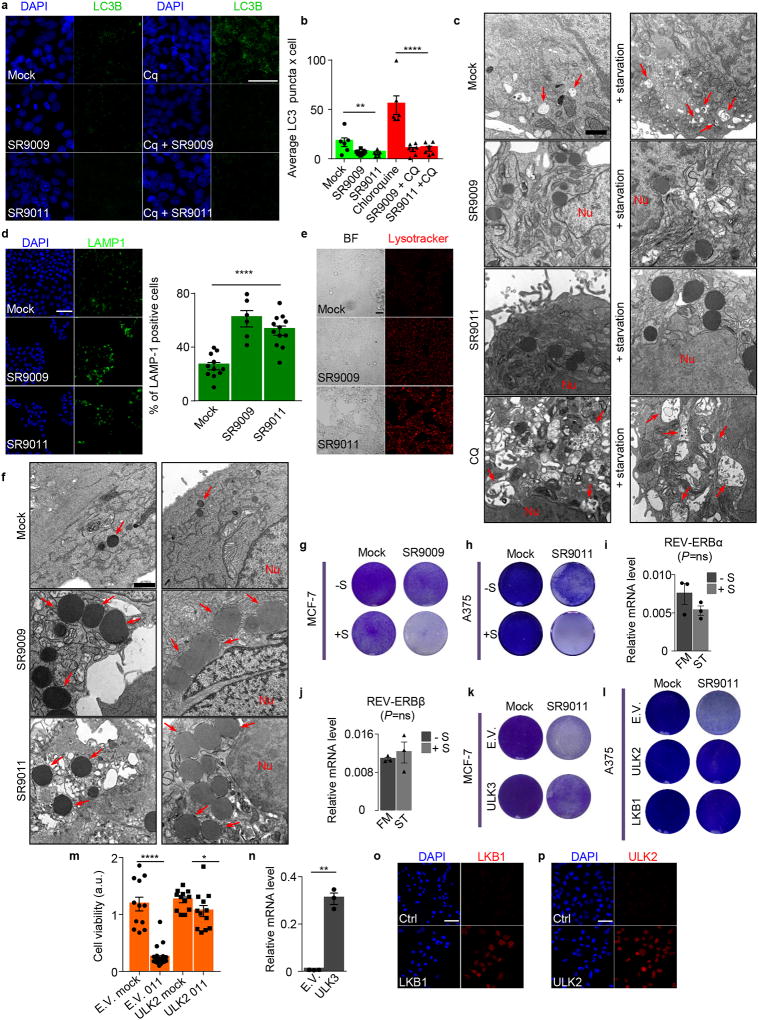
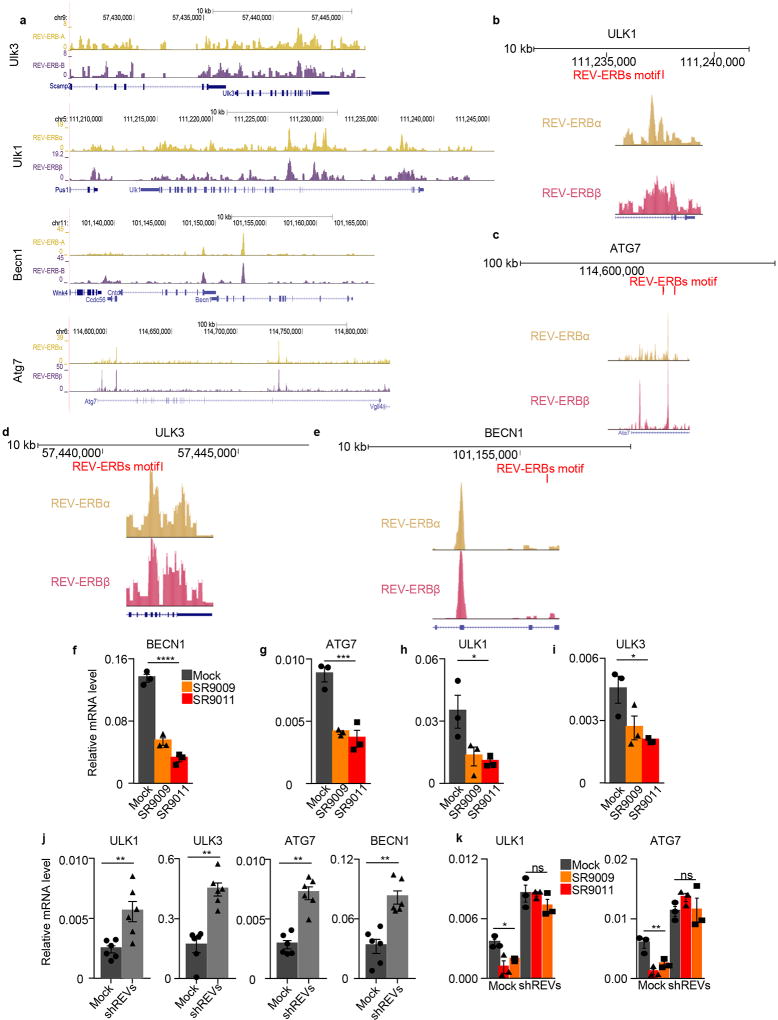
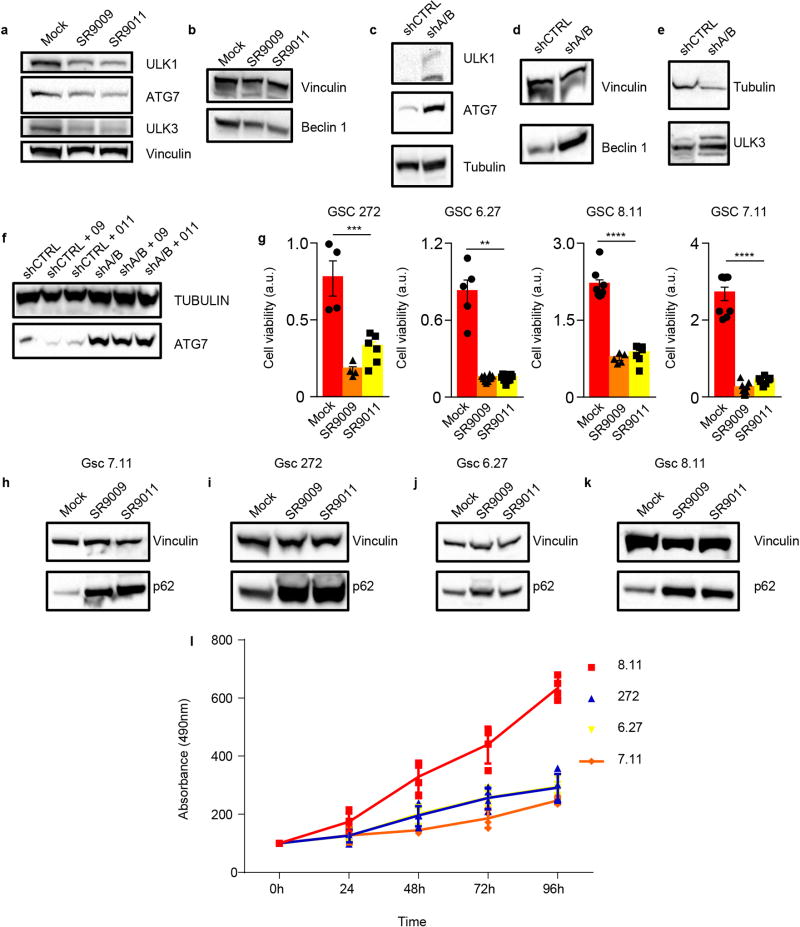
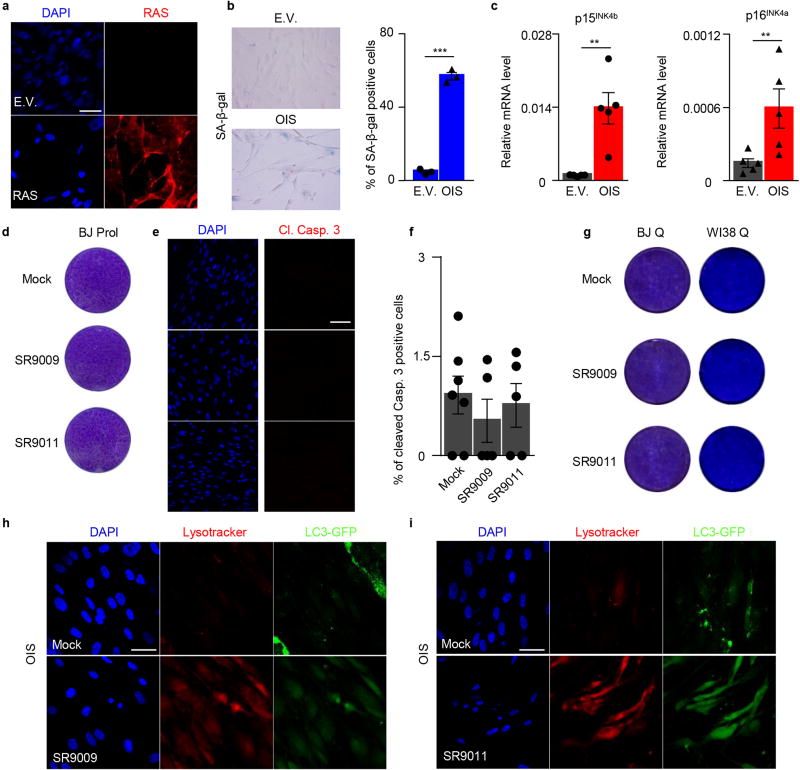
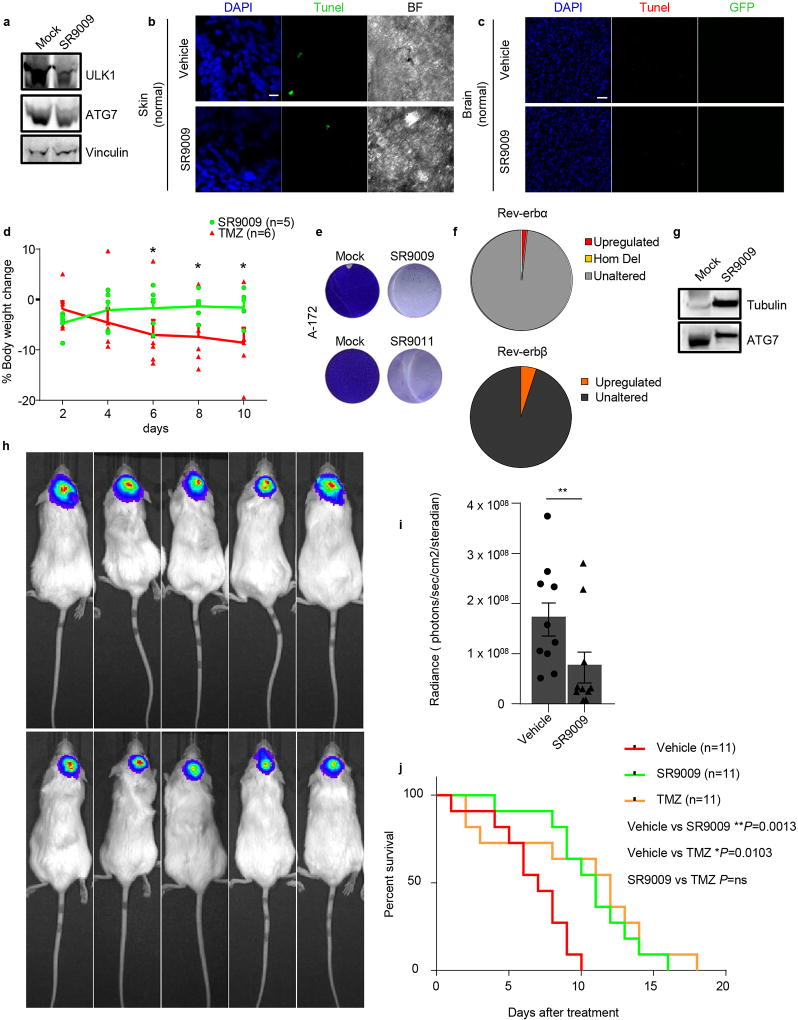
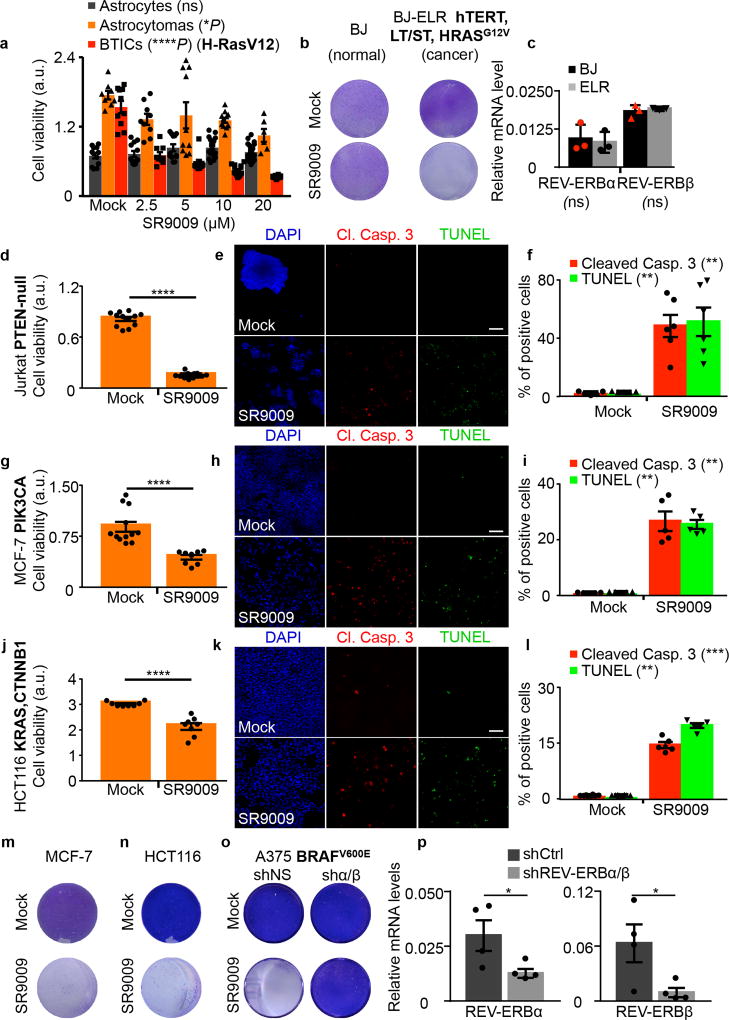
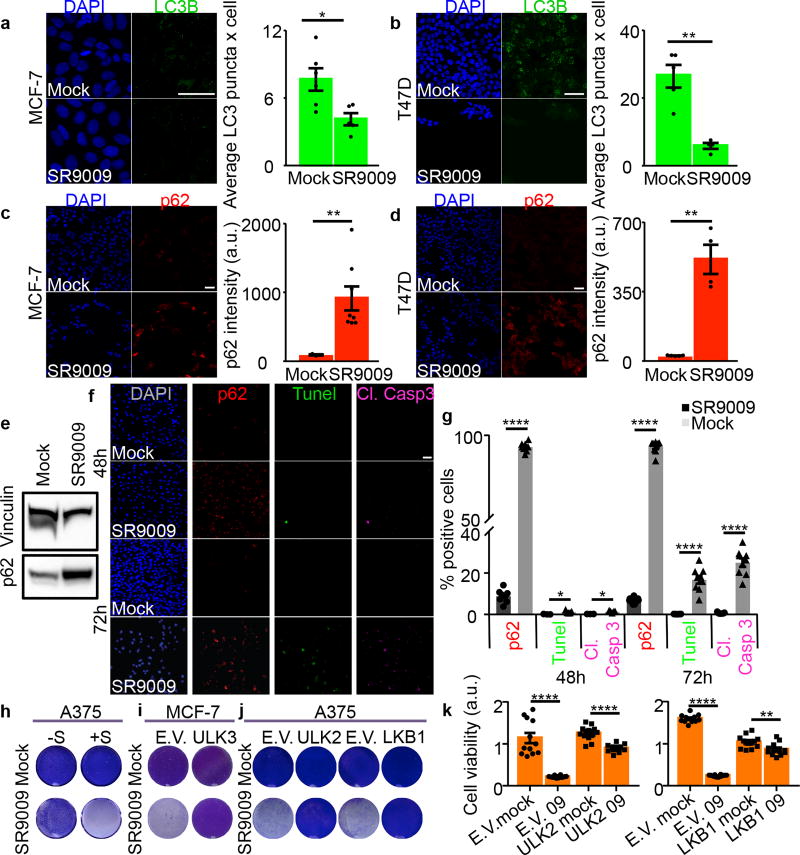
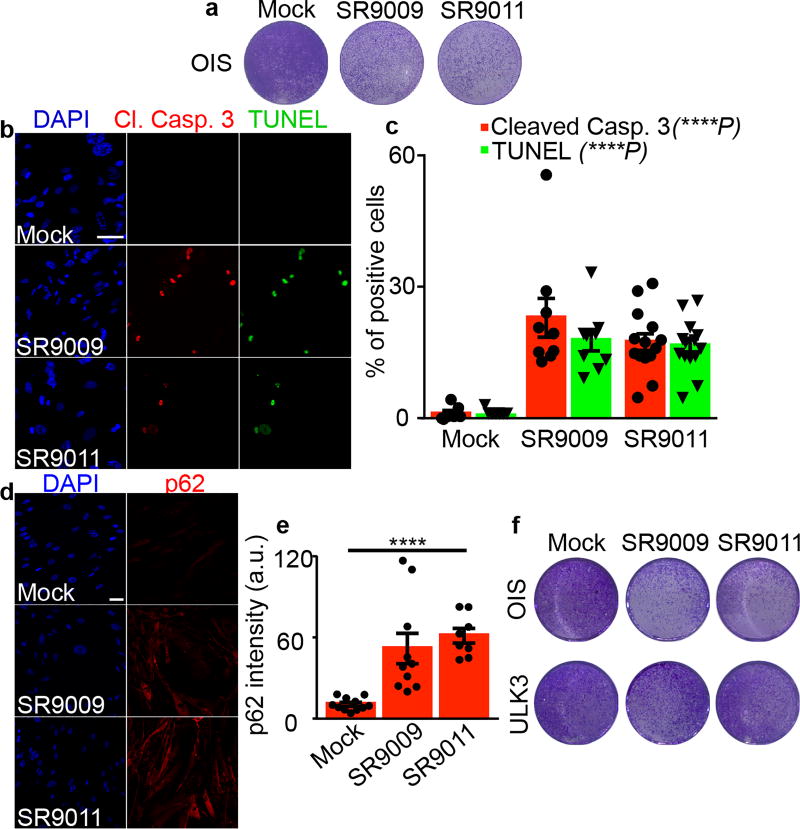
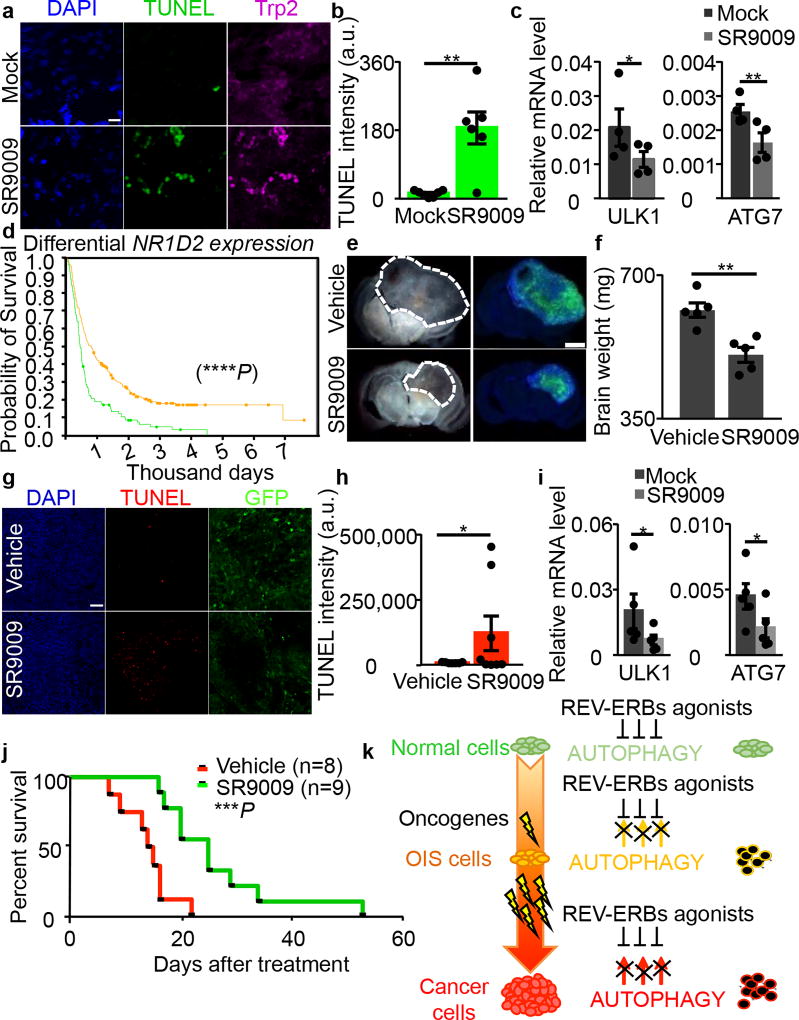
The circadian clock imposes daily rhythms in cell proliferation, metabolism, inflammation and DNA damage response. Perturbations of these processes are hallmarks of cancer and chronic circadian rhythm disruption predisposes individuals to tumour development. This raises the hypothesis that pharmacological modulation of the circadian machinery may be an effective therapeutic strategy for combating cancer. REV-ERBs, the nuclear hormone receptors REV-ERBα (also known as NR1D1) and REV-ERBβ (also known as NR1D2), are essential components of the circadian clock. Here we show that two agonists of REV-ERBs-SR9009 and SR9011-are specifically lethal to cancer cells and oncogene-induced senescent cells, including melanocytic naevi, and have no effect on the viability of normal cells or tissues. The anticancer activity of SR9009 and SR9011 affects a number of oncogenic drivers (such as HRAS, BRAF, PIK3CA and others) and persists in the absence of p53 and under hypoxic conditions. The regulation of autophagy and de novo lipogenesis by SR9009 and SR9011 has a critical role in evoking an apoptotic response in malignant cells. Notably, the selective anticancer properties of these REV-ERB agonists impair glioblastoma growth in vivo and improve survival without causing overt toxicity in mice. These results indicate that pharmacological modulation of circadian regulators is an effective antitumour strategy, identifying a class of anticancer agents with a wide therapeutic window. We propose that REV-ERB agonists are inhibitors of autophagy and de novo lipogenesis, with selective activity towards malignant and benign neoplasms.


Figures

Extended Data Figure 1
Extended Data Figure 1. SR9011 an additional REV-ERBs agonist, selectively kills cancer cell lines
a, Viability assay show that SR9011 is specifically cytotoxic in cancer cells 72h, one-way ANOVA astrocytes, n= biological replicates (n=7 mock), (n=7 2.5µM), (n=9 5µM), (n=13 10µM), (n=13 20µM) ***P=0.0004, astrocytoma (n=21 mock), (n=15 2.5µM), (n=7 5µM), (n=8 10µM), (n=7 20µM) ****P<0.0001, BTICs (n=10 mock), (n=8 2.5µM), (n=9 5µM), (n=13 10µM), (n=10 20µM) ****P<0.0001. b–d, Proliferation assay show that SR9011 treatment does not affect BJ normal cells while is deleterious for transformed BJ-ELR cells, cancer cell lines MCF-7, HCT116 (20µM, 7 days). Depletion of REV-ERBs by shRNA impairs apoptosis induction by REV-ERBs agonist SR9011; n=3 biological independent experiments). e, Human acute T cell leukemia cells are affected by REV-ERB agonist SR9011 (72h, Mann–Whitney test one-tailed ****P< 0.0001; n=24 mock, n=12 SR9011 biological replicates). f, Immunoblot analysis of cleaved Caspase 3 shows that REV-ERB agonist triggers apoptosis in A375 melanoma cell line (representative of n=2 biological independent experiments). g–j, Immunostaining for cleaved Caspase 3 and TUNEL assay confirm apoptosis induction by SR9011 in cancer cell lines MCF-7 and A375. h–j, Quantification of g,i (n= biological independent samples, MCF-7 n=5 mock, n=11 SR9011; A375 n=8 mock, n=16 SR9011).; Mann–Whitney test one-tailed MCF-7 cleaved Casp. 3 *P=0.0117; Tunel *P= 0.0231; A375 cleaved Casp. 3 ****P<0.0001; Tunel ****P<0.0001. Scale bars 50 µm. k, Electron microscopy confirms induction of apoptosis as indicated by extensive presence of swollen mitochondria (representative of n=3 biologically independent samples in two experiments). Arrows indicate normal mitochondria, asterisks swollen mitochondria. Nu= nucleus. Scale bar 1 µm. l, Downregulation of REV-ERBα and REV-ERBβ is confirmed by qRT-PCR (A375). n=3 biological independent samples; Mann–Whitney test one-tailed *P=0.05. All panels three biological independent experiments unless otherwise specified. All the data are plotted as mean ± s.e.m. For gel source data, see Supplementary Fig. 1.
Extended Data Figure 2
Extended Data Figure 2. Induction of apoptosis by REV-ERBs agonists is p53 and oxidative stress independent
a–j, REV-ERBs agonists treatment triggers apoptosis independently of p53 status as showed by proliferation assay (7 days 20 µM; a,c,f,h) and TUNEL assays (b,i,j 3 days, 20 µM) in cancer cell lines affected by different types of p53 alterations. N= biological independent samples T47D n=8 (mock), n=6 (SR9009), n=10 (SR9011) One-way ANOVA test ****P<0.0001, PANC-1 n=4 (mock), n=6 (SR9009), n=7 (SR9011) one-way ANOVA test TUNEL *P=0.0108, Cl. Caspase 3 ****P<0.0001; SKMEL28 n=4 (mock), n=5 (SR9009, SR9011) one-way ANOVA test TUNEL ****P<0.0001, Cl. Caspase 3 **P=0.0035,).; d–e, Apoptosis is induced in both WT and p53 null HCT116 cell (TUNEL assay 4 days, 20 µM mean ± s.e.m., n= biological independent samples Mann–Whitney test one-tailed HCT116 WT n=5 (mock, SR9009) **P=0.004; HCT116 p53 KO n=8 (mock), n=6 (SR9009) ***P=0.0003); f, Immunoblot analysis of cleaved Caspase 3 shows that REV-ERBs agonist triggers apoptosis in RIGH cell line (one experiment). k, Co-treatment with the reducing agent N-acetyl-L-cysteine (NAC 10mM) does not rescue A375 viability (20 µM 7 days, n= biological replicates n=5 (mock -NAC), n=6 (all others dot plots) one-way ANOVA test ****P<0.0001). l Similar results are obtained also under hypoxic condition (20 µM, 6 days, n= biological replicates n=3 (mock -NAC, mock hypoxia, 09 hypoxia), n=6 (09 normoxia, 011 normoxia and hypoxia) one-way ANOVA test ****P<0.0001). m–n, Hypoxia or co-treatment with NAC does not alter REV-ERBs agonists ability to induce apoptosis in A375 (one-way ANOVA test, n= biological independent samples, n=3 mock, n=5 SR9009, n=11 SR9011 TUNEL normoxia, *P=0.0432, Cl. Caspase 3 ***P=0.0004; n=6 mock, n=13 SR9009, n=14 SR9011 hypoxia TUNEL ***P=0.0005, Cl. Caspase 3 *P=0.0028; n=3 mock, n=4 SR9009, n=3 SR9011 NAC TUNEL *P=0.0104, NAC Cl. Caspase 3 **P=0.0042; All scale bars 50 µm. All panels three biological independent experiments with similar results, except otherwise specified. All the data are plotted as mean ± s.e.m. Norm= Normoxia; Hypo= Hypoxia. For gel source data, see Supplementary Fig. 1.
Extended Data Figure 3
Extended Data Figure 3. Attenuation of oxidative stress does not affect REV-ERBs agonists’ cytotoxic activity
a–b, REV-ERBs agonists treatment induce apoptosis also upon co-treatment with NAC and under hypoxic condition as showed by proliferation assay of HCT-116; n= biological replicates n=3 (mock ± NAC), n=6 (09–011 ± NAC), n=9 (09 + NAC), n=11 (011 + NAC) 20 µM, n=3 (mock normoxia), n=6 (09–011 normoxia/hypoxia), n=5 (mock hypoxia) 6 days, one-way ANOVA test ****P<0.0001). c–d HCT116 apoptosis induction remained unchanged under hypoxia or upon co-treatment with NAC; 20 µM 6 days, one-way ANOVA test, n=biological independent samples n=5 (mock), n=6 (SR9009), n=8 (SR9011) normoxia TUNEL ***P=0.0003; normoxia Cl. Caspase 3 **P=0.0021; n=3 (mock), n=5 (SR9009), n=4 (SR9011) hypoxia TUNEL, **P=0.0015; hypoxia Cl. Caspase 3 **P=0.0046; NAC TUNEL, ****P<0.0001; NAC Cl. Caspase 3 ****P<0.0001) e, also in MCF-7 apoptosis triggered by REV-ERBs agonists is oxidative state independent, as showed by proliferation assay (20 µM n= biological replicates n=6 (mock normoxia/hypoxia), n=4 (09–011 normoxia), n=7 (09 hypoxia), n=5 (011 hypoxia) one-way ANOVA test ****P<0.0001; f–g TUNEL assay and immunofluorescence analysis of Cleaved Caspase 3 confirm previous results; n= biological independent samples n=3 (mock normoxia), n=5 (mock hypoxia), n=11 (09 normoxia), n=8 (09 hypoxia), n=10 (011 normoxia/hypoxia), One-way ANOVA test TUNEL normoxia **P=0.0049; Cl. Casp. 3 normoxia **P=0.0054; TUNEL hypoxia ****P<0.0001; Cl. Casp. 3 hypoxia ****P<0.0001; all panels three biological independent experiments with similar results. All the data are plotted as mean ± s.e.m. Norm= Normoxia; Hypo= Hypoxia.
Extended Data Figure 4
Extended Data Figure 4. REV-ERB agonists inhibit de novo lipogenesis
a–b, REV-ERBs induces downregulation of FASN and SCD-1 mRNA as assayed by qRT-PCR (A172 glioblastoma cell line 48h, 20µM, FASN and SCD-1 (n= 3 biological independent samples ****P<0.0001); Also, FASN and SCD-1 protein levels (b) are reduced upon treatment. c–i REV-ERB agonists reduce free fatty acid (FFA) concentrations as quantified by LC-MS. c, Relative levels of FFAs that are the primary products of FASN (C16:0, C18:0) and SCD-1 (C16:1, C18:1) are lower in the SR9009 treated samples. d, the unsaturation index, the ratio oleate-to-stearate changes is decreased in the SR9009 treated sample, due to a larger decrease in monounsaturated oleate concentrations; e–f, Analysis of polyunsaturated fatty acids shows a consistent trend with lower levels of these fatty acids; g–i, decreases in FFA levels can affect the concentrations of phospholipids that contain those fatty acids. REV-ERB agonists treatment leads to a reduction of palmitate-containing phosphatidylcholine, arachidonic acid- and oleic acid-containing phosphatidylinositols, mono- and di-unsaturated phosphatidylglycerol, and h–i phosphatidylethanolamines; (A172 glioblastoma cell line 48h, 20µM, *P=0.05. j, Scheme illustrating metabolic products of FASN and SCD-1; k, Supplementation of oleic acid partially ameliorate REV-ERBs agonists’ cytotoxicity (20 µM, A172 4 days); l, Supplementation of palmitic acid does not impair REV-ERBs agonists’ cytotoxicity (20 µM, A172 4 days). All the data are plotted as mean ± s.e.m. P-value is calculated with one-way ANOVA in panel a, and with Mann–Whitney test one-tailed in the remaining panels. d–i n=3 biological independent samples. For gel source data, see Supplementary Fig. 1.
Extended Data Figure 5
Extended Data Figure 5. REV-ERB agonist SR9011 inhibit autophagy
a–b, SR90011 treatment reduces the number of autophagosomes both in MCF7 and T47D, n= biological independent samples MCF7 20µM 24h n=9 (mock), n=4 (SR9011) **P=0.0056, T47D 48h 20µM n=5 (mock), n=4 (SR9011) **P=0.0079; c–d, SR9011 induces accumulation of p62 as shown by immunofluorescence both in MCF7 and T47D n= biological independent samples 48h MCF7 p62 n=3 (mock), n=4 (SR9011) *P=0.0286; 48h T47D n=5 (mock, SR9011) **P=0.004; e, Accumulation of p62 is confirmed by immunoblot (48h, 20µM A375); f–g, Inhibition of autophagy precedes apoptosis induction as shown by immunofluorescence of p62, cleaved Caspase 3 and TUNEL assay (n= biological independent samples n=4 mock 48h, n=5 SR9011 p62, n=3 48h SR9011; n=6 (mock, SR9011 72h p62), n=10 (mock 72h), n=8 (SR9011 72h) A375 20µM, Cl. Casp. 3 48h *P=0.0286; Cl. Casp. 3 72h ****P<0.0001; Tunel 48h *P=0.0286; Tunel 72h ****P<0.0001; p62 48h **P=0.0079; p62 72h **P=0.0011). All panels three biological independent experiments with similar results. All the data are plotted as mean ± s.e.m. P-value is calculated with Mann–Whitney test one-tailed in all the panels. For gel source data, see Supplementary Fig. 1.
Extended Data Figure 6
Extended Data Figure 6. REV-ERB agonists SR9009 and SR9011 block autophagy
a, REV-ERBs agonists blockage of autophagy results in a reduced autophagic flux; b, Quantification of LC3 puncta; n=biological independent samples n=6 (mock, CQ ± SR9011), n=11 (SR9009) n=5 (SR9011), n=7 (CQ+ SR9009) one-way ANOVA mock vs SR9009/011 **P=0.0049; one-way ANOVA CQ vs CQ+SR9009/011 ****P<0.0001. c, Upon SR9009 and SR9011 treatment autophagy blockage is also observed by electron microscopy and even under starvation. Arrows indicate representative autophagosomes. Nu= nucleus. Scale bars 1uM (n=3 biologically independent samples of two independent experiments with similar results (mock ± SR9009 and SR9011) one experiment (mock, SR9009 and SR9011 ± starvation). d, REV-ERB agonists induce lysosomes accumulation as showed by immunofluorescence assay for lysosome marker LAMP1 (n= biological independent samples, n=11 mock, n=6 SR9009, n= SR9011 T47D, 72h 20µM, one-way ANOVA ****P<0.0001. e, Lysosomes accumulation is also confirmed by lysotracker (MCF-7, 72h 20µM; Scale bars 50 µm. f, Drastic lysosomal turnover defects are also evident on electron microscopy (n=3 biologically independent samples of two independent experiments with similar results). Arrows indicate lysosomes. CQ= chloroquine; Nu= nucleus. Scale bars 1uM. g–h, Starvation synergizes with REV-ERBs agonist SR9009 treatment (MCF-7 48h, 20µM; A375, 3 days 20µM). i–j, Starvation has no effect on REV-ERBs expression as shown by qRT-PCR; Mann–Whitney test two-tailed P=ns; k–l, Overexpression of ULK3, ULK2 and LKB1 impairs SR9011 induction of apoptosis (MCF-7, A375 6 days 20µM); m, WST-1 viability assay shows abrogation of apoptosis in ULK2 overexpressing cells; n= biological replicates, n=12 (E.V. mock, ULK2 mock, ULK2 SR9011), n= 27 (E.V. SR9011) A375, 6 days 20µM; Mann–Whitney test one-tailed E.V. Mock vs E.V. 011 ****P< 0.0001; ULK2 Mock vs ULK2 011 *P=0.0225). n. qRT-PCR shows overexpression of ULK3 (Student's t-test one-tailed **P=0.0031); o–p, immunofluorescence assay confirms overexpression of LKB1 and ULK2. i–j,n n=3 biological independent samples. Scale bars 50 µm. E.V.= empty vector; CQ= chloroquine. BF= bright field. Ns= not significant. All panels three biological independent experiments with similar results, except otherwise specified. All the data are plotted as mean ± s.e.m.
Extended Data Figure 7
Extended Data Figure 7. Core autophagy genes are novel REV-ERBs targets
a, Analyses of available ChIP-seq data indicate that REV-ERBs peaks are present in ULK3, ULK1, BECN1, and ATG7 (P<1e-05 calculated by MACS using Poisson distribution, FDR≤0.05); b–e, Analysis of REV-ERBs binding motif performed using HOMER indicate the presence of REV-ERBs binding sites in Ulk3, Ulk1, Beclin1 and Atg7 genes; f–i, REV-ERBs agonists’ treatment leads to downregulation of autophagy central regulators (MCF-7 72h 20µM; one-way ANOVA ****P<0.0001); j Autophagy genes are upregulated upon REV-ERBs shRNA (A375, n=6 biological independent samples, Mann–Whitney test one-tailed ULK3 **P=0.0011; ATG7, and BECN1 **P=0.0011, ULK1 **P=0.0043). k, SR9009 and SR9011 repression of autophagy genes is abrogated in A375 shREV-ERBs cells; shCTRL +/− SR9009-SR9011 one-way ANOVA ULK1 *P=0.0162, ATG7 **P=0.0036; shREV-ERBs one-way ANOVA ULK1 and ATG7 P=ns. f–I,k n=3 biological independent samples. All the data are plotted as mean ± s.e.m. shREVs= shREV-ERBα/β.
Extended Data Figure 8
Extended Data Figure 8. REV-ERBs regulates autophagy core genes and blocks autophagy in slowly proliferating cancer stem cells
a–b, Immunoblot analyses show reduction of ULK1, ATG7, ULK3 and Beclin1 protein levels upon treatment with REV-ERBs agonists (MCF-7 72h 20µM). c–e, REV-ERBs shRNA results in increased protein levels of autophagy regulators (A375). f, SR9009 and SR9011 reduction of ATG7 is abrogated upon shREV-ERBs cells. g, WST-1 viability assay show that REV-ERB agonists SR9009 and SR9011 treatment is specifically cytotoxic in patient-derived glioblastoma stem cells; mean ± s.e.m., 5 days, one-way ANOVA; n= biological replicates GSC 272 n=4 (mock, SR9009), n=6 (SR9011), ***P=0.0002; GSC 6.27 n=5 (mock), n=10 (SR9009) **P=0.003; GSC 8.11 n=8 (mock), n=5 (SR9009), n=7 (SR9011) ****P<0.0001; GSC 7.11 n=9 (mock, SR9009), n=7 (SR9011)****P<0.0001. b–e, Immunoblot analyses show accumulation of p62 in patient-derived glioblastoma stem cells (one independent experiment). f, Mts assay show that GSC 6.27, 7.11, and 272 are characterized by slow proliferation rate (n=4 biological independent samples, four experiments, mean ± standard deviation). All panels three biological independent experiments with similar results, except otherwise specified. For gel source data, see Supplementary Fig. 1.
Extended Data Figure 9
Extended Data Figure 9. REV-ERBs agonists do not affect viability of normal proliferating and quiescent cells OIS
a, Immunofluorescence assay for RAS confirms RAS overexpression in OIS cells. b, SA-β-Gal assay shows induction of senescence (n=3 biological independent samples Student's t-test one-tailed ****P<0.0001). c, Induction of cell cycle inhibitors p15INK4b, p16INK4a is assayed by qRT-PCR; n=5 independent biological samples; Mann–Whitney test one-tailed p15INK4b **P =0.004, p16INK4a **P=0.0079. d–e, REV-ERBs agonists’ do not induce apoptosis in proliferating and quiescent normal diploid fibroblasts BJ (d–g), as shown by proliferation assay (d, 7 days, 20µM) and immunofluorescence for cleaved Caspase 3 (e–f, 7 days 20µM, one-way ANOVA; n=biological independent samples, n=7 (mock) n=5 (SR9009, SR9011) P=ns. Cell viability is also not affected in an additional normal diploid cell line WI38 (g, 10 days 20µM). h–I, SR9009 and SR9011 inhibit autophagy in OIS cells as shown by massive accumulation of lysosomes (lysotracker) and absence of LC3 puncta (3 days 20µM). All scale bars 50 µm. Data in a–i are representative of three independent experiments with similar results unless otherwise specified. All the data are plotted as mean ± s.e.m.
Extended Data Figure 10
Extended Data Figure 10. SR9009 impair tumor growth and improve survival of glioblastoma patient derived xenografts
a, Protein levels of autophagy genes are reduced upon SR9009 treatment in NRAS naevi as assayed by immunoblot (n=4 mice, one experiment). b, TUNEL assays shows that apoptosis induction is absent in normal skin upon treatment with SR9009 (n=4 mice, one experiement, 12 days SR9009 20 µM). Scale bar 10 µm. (BF= brightfield) c, TUNEL assays shows that apoptosis induction is absent in normal brain tissues upon treatment with SR9009 (6 days, 200mg/kg b.i.d. n=5 mice, one experiment). d, Treatment with SR9009 (100mg/kg b.i.d) is better tolerated than TMZ administration (82.5 mg/kg q.d. for 5 days) as shown by measurement of % body weight change. Mann–Whitney test one-tailed (day 2, 4 P=ns; day 6,8,10 *P=0.0411, mean ± s.e.m, SR9009 n=5, TMZ n=6 mice. Ns= not significant. e, Glioblstoma cell line A172 are sensitive to SR9009 and SR9011 treatment, (20 µM 6 days, three biologically independent experiments with similar results). f, Analyses of the TCGA data presented in Brennan et al (Cell 2013) show the lack of genetic alteration affecting REV-ERBα (NR1D1) and REV-ERBβ (NR1D2). Furthermore, gene expression analysis shows that no cases are present with REV-ERBs downregulation and only a small fraction with upregulation. n= 574 biological independent samples. NR1D1: upregulation 1,56%; Homozygous deletion (Hom Del) 0.17%; unaltered 98.27%. NR1D2: upregulation 4.54%; unaltered 95.46%. g, In vivo treatment with SR9009 results in decrease of ATG7 protein levels (6 days, 200mg/kg b.i.d., n=5 mice, one experiment). h, SR9009 treatment impairs in vivo growth of glioblastoma patient derived xenografts (6 days, 200mg/kg b.i.d n=5 mice). i, Quantification of tumor size by in vivo luciferase assays (mean ± s.e.m n=10 mice, Mann-Whitney test one tailed **P=0.0057). j, SR9009 improves survival in mice bearing glioblastoma patient-derived xenografts. SR9009 200mg/kg, Vehicle n=11, SR9009 n=11, TMZ (82.5 mg/kg q.d. for 5 days) n=11 mice; log-rank analyses two-tailed performed. For gel source data, see Supplementary Fig. 1.
Figure 1
Figure 1. SR9009 is selectively lethal in cancer cell lines driven by different oncogenic signaling
a, SR9009 treatment is specifically cytotoxic in cancer cells (72h, one-way ANOVA, n=biological replicates, astrocytes (n=12 mock), (12 2.5µM),(12 5µM), (15 10µM), (18 20µM), P=ns, astrocytoma (n=8 mock), (n=9 2.5µM), (n=10 5µM), (n=11 10µM), (n=6 20µM), *P=0.037, BTICs (n=10 mock), (n=9 2.5µM), (n=9 5µM), (n=15 10µM), (n=18 20µM), ****P<0.0001. b, SR9009 treatment impairs viability of BJ-ELR, but not BJ cells (20µM, 7 days); c REV-ERBs expression levels in BJ and BJ-ELR; (qRT-PCR n=3 biological independent samples, two-tailed Mann–Whitney test P=ns). d, Jurkat cells are affected by SR9009 (n=12 biological replicates 72h 20µM, Mann–Whitney test, one-tailed ****P< 0.0001). e–f, Immunostaining for cleaved caspase 3/TUNEL (72h, 20uM); Quantification in f; n=5 (mock) n=6 (SR9009) biological independent samples, Mann–Whitney test, one-tailed cleaved Caspase 3 **P=0.0022; Tunel **P=0.0022. g, MCF-7 viability is affected by SR9009 (n=12 mock, n=8 SR9009 biological replicates 72h 20µM, Mann–Whitney test one-tailed ****P<0.0001). h–i, Immunostaining for cleaved caspase 3/TUNEL (72h, 20uM). Quantification in i (n=5 biological independent samples Mann–Whitney test one-tailed, cleaved Caspase 3 **P=0.004; Tunel **P=0.004). j HCT116 viability is affected by SR9009 (n=8 biological replicates, WST-1 assay, 72h, Mann–Whitney test, one-tailed ****P< 0.0001. k–l, Induction of apoptosis is showed by cleaved Caspase 3/TUNEL staining (72h, 20µM); Quantification on panel l; n=8 (mock) n=5 (SR9009) biological independent samples, Mann–Whitney test one-tailed cleaved Caspase 3 ***P=0.0008; TUNEL assay **P=0.0021. m–o Prolonged SR9009 treatment eradicates cancer cells (7 days, 20µM), while does not affect REV-ERBα/β shRNA expressing cells; p, REV-ERBα and REV-ERBβ qRT-PCR; n=4 biological independent samples; Mann–Whitney test one-tailed *P=0.0286. NS= not significant. a.u= arbitrary unit. Scale bars 50 µm. All panels three biological independent experiments, mean ± s.e.m. except c (mean ± s.d.).
Figure 2
Figure 2. REV-ERBs agonist SR9009 inhibits autophagy
a–b, SR9009 treatment reduces the number of autophagosomes, as shown by immunofluorescence of LC3B, (n=biological independent samples MCF7 (n=6 mock), (n=5 SR9009) and T47D (n=5 mock) (n=4 SR9009) Mann–Whitney test one-tailed MCF7 20µM 24h *P=0.0152, T47D 20µM 48h **P=0.0079; c–d SR9009 induces accumulation of p62 as shown by immunofluorescence; n= biological independent samples MCF7 (n=3 mock), (n=8 SR9009) and T47D (n=5 mock), (n=4 SR9009) Mann–Whitney test one-tailed 48h MCF7 p62 **P=0.0061; 48h T47D **P=0.0079; e, Inhibition of autophagy is confirmed by the immunoblot for p62 (20µM 48h, A375); f–g, Inhibition of autophagy precedes apoptosis induction as shown by immunofluorescence of p62, cleaved Caspase 3 and TUNEL assay; n=biological independent samples, Mann–Whitney test one-tailed, A375 20µM Cl. Casp. 3 48h (n=3) *P=0.0179; Cl. Casp. 3 72h (n=7) ****P<0.0001; Tunel 48h (n=3) *P=0.0179; Tunel 72h (n=7) ****P<0.0001; p62 48h ****P<0.0001 (n=8); p62 72h (n=9) ****P<0.0001; h, Starvation dramatically accelerate the cytotoxic effect of REV-ERB agonist SR9009 (A375, 3 days 20µM, starvation time 24h; i, Overexpression of ULK3 impairs SR9009 induction of apoptosis (MCF-7, 6 days 20µM); j, Overexpression of ULK2 and LKB1 impairs SR9009 induction of apoptosis (A375, 6 days 20µM). k, WST-1 viability assay shows abrogation of apoptosis in ULK2 and LKB1 overexpressing cells (n=biological replicates A375, 6 days 20µM; Mann–Whitney test one-tailed n=12, E.V. Mock vs E.V. 09 ****P<0.0001; ULK2 Mock (n=12) vs ULK2 09 (n=10) ****P<0.0001; n=12 E.V. Mock vs E.V. 09 ****P<0.0001 and LKB1 Mock vs LKB1 09 **P=0.0028. All scale bars 50 µm. All panels three biological independent experiments with similar results. All the data are plotted as mean ± s.e.m. For gel source data, see Supplementary Fig. 1.
Figure 3
Figure 3. SR9009 and SR9011 treatment evokes an apoptotic response and induces inhibition of autophagy in OIS cells
a, Proliferation assay shows that REV-ERBs agonists impair viability of OIS cells (6 days, 20µM). b–c, Immunofluorescence assay for cleaved Caspase 3 and TUNEL assay shows apoptosis induction specifically in OIS (n=biological independent samples, n=7 mock, n=9 SR9009, n=14 SR9011, 72h, 20µM; one-way ANOVA, Cl. Casp 3 ****P<0.0001, TUNEL ****P<0.0001, mean ± s.e.m). d–e, p62 accumulates upon REV-ERBs agonists treatment as assayed by immunofluorescence for p62 (n=biological independent samples, n=11 mock, n=10 SR9009, n=8 SR9011 one-way ANOVA, 72h days 20µM, ****P<0.0001; mean ± s.e.m.). f, ULK3 overexpression protects OIS cells from cytotoxicity induced by REV-ERBs agonists (6 days 20µM, mean ± s.e.m.). All scale bars 50 µm. All panels three biological independent experiments with similar results.
Figure 4
Figure 4. SR9009 impairs viability of NRAS-driven naevi, glioblastoma growth and extends survival
a–b, SR9009 treatment induces apoptosis in vivo in NRAS naevi as assayed by immunofluorescence analysis (representative images of two independent experiments with similar results, Trp2 melanocytic marker and TUNEL, Mann–Whitney test one-tailed **P=0.0058, n=biologically independent samples, n=7 mock, n=6 SR9009, 12 days SR9009 20 µM, four mice). Scale bar 10 µm. c, Autophagy genes are downregulated upon treatment of NRAS naevi n=4 mice; Mann–Whitney one-tailed ULK1 *P=0.0249, ATG7 **P=0.007. d, REV-ERBβ expression correlates with survival in brain cancer patients (n= biologically independent samples, yellow line intermediate expression n=224, green line downregulated n=119 NIH Rembrandt database; Log-rank two-sided ****P<0.0001;). e–f, SR9009 treatment impairs in vivo growth of glioblastoma (representative images of one experiment n=5 mice, 6 days, 200mg/kg b.i.d.; Mann-Whitney test one-tailed **P=0.004). g–h, SR9009 induces apoptosis in glioblastoma as shown by TUNEL assay; tumor cells are GFP-positive (representative images of one independent experiment, 6 days 200mg/kg b.i.d., Mann–Whitney test one-tailed *P=0.02; n=biologically independent samples, n=7 mock, n=8 SR9009, five mice). i, In vivo treatment with SR9009 results in downregulation of main autophagy genes (6 days, 200mg/kg b.i.d., n=5 mice, Mann-Whitney test one-tailed *P=0.0476). j, SR9009 improves survival of mice affected by glioblastoma. SR9009 100mg/kg, Vehicle n=8 SR9009 n=9 mice; log-rank two-tailed ***P=0.0009. k, Scheme illustrating how REV-ERB agonists selectively affect OIS and cancer cells. All panels mean ± s.e.m.

Comment in

References

    1. Fu L, Lee CC. The circadian clock: pacemaker and tumour suppressor. Nature reviews. Cancer. 2003;3:350–361. - PubMed
    1. Scheiermann C, Kunisaki Y, Frenette PS. Circadian control of the immune system. Nature reviews. Immunology. 2013;13:190–198. doi: 10.1038/nri3386. - DOI - PMC - PubMed
    1. Hanahan D, Weinberg RA. Hallmarks of cancer: the next generation. Cell. 2011;144:646–674. - PubMed
    1. Straif K, et al. Carcinogenicity of shift-work, painting, and fire-fighting. The Lancet. Oncology. 2007;8:1065–1066. - PubMed
    1. Cho H, et al. Regulation of circadian behaviour and metabolism by REV-ERB-alpha and REV-ERB-beta. Nature. 2012;485:123–127. doi:nature11048 [pii]10.1038/nature11048. - PMC - PubMed

Publication types

MeSH terms