

CD8+ T cell infiltration in breast and colon cancer: A histologic and statistical analysis
- PMID: 29320521
- PMCID: PMC5761898
- DOI: 10.1371/journal.pone.0190158
CD8+ T cell infiltration in breast and colon cancer: A histologic and statistical analysis
Abstract
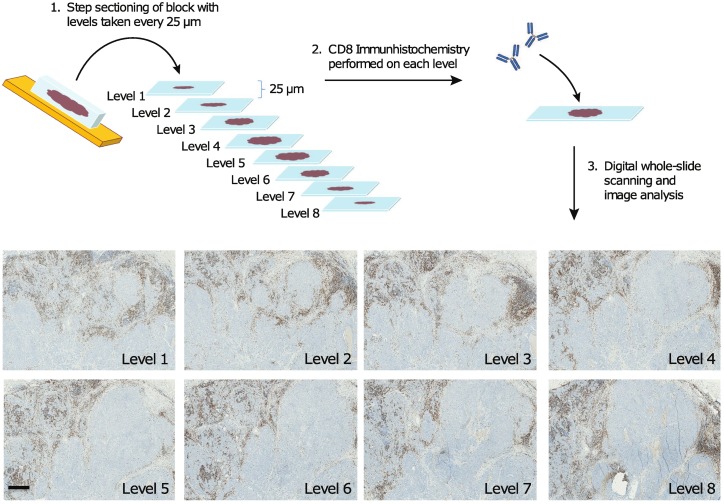
The prevalence of cytotoxic tumor infiltrating lymphocytes (TILs) has demonstrated prognostic value in multiple tumor types. In particular, CD8 counts (in combination with CD3 and CD45RO) have been shown to be superior to traditional UICC staging in colon cancer patients and higher total CD8 counts have been associated with better survival in breast cancer patients. However, immune infiltrate heterogeneity can lead to potentially significant misrepresentations of marker prevalence in routine histologic sections. We examined step sections of breast and colorectal cancer samples for CD8+ T cell prevalence by standard chromogenic immunohistochemistry to determine marker variability and inform practice of T cell biomarker assessment in formalin-fixed, paraffin-embedded (FFPE) tissue samples. Stained sections were digitally imaged and CD8+ lymphocytes within defined regions of interest (ROI) including the tumor and surrounding stroma were enumerated. Statistical analyses of CD8+ cell count variability using a linear model/ANOVA framework between patients as well as between levels within a patient sample were performed. Our results show that CD8+ T-cell distribution is highly homogeneous within a standard tissue sample in both colorectal and breast carcinomas. As such, cytotoxic T cell prevalence by immunohistochemistry on a single level or even from a subsample of biopsy fragments taken from that level can be considered representative of cytotoxic T cell infiltration for the entire tumor section within the block. These findings support the technical validity of biomarker strategies relying on CD8 immunohistochemistry.
Conflict of interest statement
Figures


Similar articles
-
CD3+, CD4+ & CD8+ tumour infiltrating lymphocytes (TILs) are predictors of favourable survival outcome in infiltrating ductal carcinoma of breast.Indian J Med Res. 2014 Sep;140(3):361-9. Indian J Med Res. 2014. PMID: 25366203 Free PMC article.
-
Morphological Evaluation of Tumor-Infiltrating Lymphocytes (TILs) to Investigate Invasive Breast Cancer Immunogenicity, Reveal Lymphocytic Networks and Help Relapse Prediction: A Retrospective Study.Int J Mol Sci. 2017 Sep 8;18(9):1936. doi: 10.3390/ijms18091936. Int J Mol Sci. 2017. PMID: 28885584 Free PMC article.
-
PD-1(+) immune cell infiltration inversely correlates with survival of operable breast cancer patients.Cancer Immunol Immunother. 2014 Apr;63(4):395-406. doi: 10.1007/s00262-014-1519-x. Epub 2014 Feb 11. Cancer Immunol Immunother. 2014. PMID: 24514954 Free PMC article.
-
Immune infiltrates in the breast cancer microenvironment: detection, characterization and clinical implication.Breast Cancer. 2017 Jan;24(1):3-15. doi: 10.1007/s12282-016-0698-z. Epub 2016 May 2. Breast Cancer. 2017. PMID: 27138387 Review.
-
Tumour-infiltrating T-cell subsets, molecular changes in colorectal cancer, and prognosis: cohort study and literature review.J Pathol. 2010 Dec;222(4):350-66. doi: 10.1002/path.2774. J Pathol. 2010. PMID: 20927778 Free PMC article. Review.
Cited by
-
A comparative analysis of factors influencing colorectal cancer's age standardized mortality ratio among Korean women in the hot and cold spots.PLoS One. 2022 Sep 9;17(9):e0273995. doi: 10.1371/journal.pone.0273995. eCollection 2022. PLoS One. 2022. PMID: 36083985 Free PMC article.
-
Angiotensinogen, a promising gene signature for rectum and stomach adenocarcinoma patients.Am J Transl Res. 2022 Dec 15;14(12):8879-8892. eCollection 2022. Am J Transl Res. 2022. PMID: 36628228 Free PMC article.
-
Biomarker predictors for immunotherapy benefit in breast: beyond PD-L1.Curr Breast Cancer Rep. 2019 Dec;11(4):217-227. doi: 10.1007/s12609-019-00331-5. Epub 2019 Nov 11. Curr Breast Cancer Rep. 2019. PMID: 33312343 Free PMC article.
-
Targeting Cbl-b in cancer immunotherapy.J Immunother Cancer. 2023 Feb;11(2):e006007. doi: 10.1136/jitc-2022-006007. J Immunother Cancer. 2023. PMID: 36750253 Free PMC article. Review.
-
Comprehensive analysis based on DNA methylation and RNA-seq reveals hypermethylation of the up-regulated WT1 gene with potential mechanisms in PAM50 subtypes of breast cancer.PeerJ. 2021 May 4;9:e11377. doi: 10.7717/peerj.11377. eCollection 2021. PeerJ. 2021. PMID: 33987034 Free PMC article.
References
-
- Ferlay J, Soerjomataram I, Ervik M, Dikshit R, Eser S, Mathers C, et al. GLOBOCAN 2012 v1.0, Cancer Incidence and Mortality Worldwide: IARC CancerBase No. 11
-
- Ruffel B, Au A, Rugo HS, Esserman LJ, Hwang ES, Coussens LM. Leukocyte composition of human breast cancer. Proc. Natl Acad. Sci. USA 2012. February 12; 109(8):2796–2801 doi: 10.1073/pnas.1104303108 - DOI - PMC - PubMed
-
- Halama N, Michel S, Kloor M, Zoernig I, Benner A, Spille A, et al. Localization and density of immune cells in the invasive margin of human colorectal cancer liver metastases are prognostic for response to chemotherapy. Cancer Res. 2011;71:5670–5677 doi: 10.1158/0008-5472.CAN-11-0268 - DOI - PubMed
-
- Mahmoud S, Lee A, Ellis IGreen A. CD8+ T lymphocytes infiltrating breast cancer: A promising new prognostic marker? Oncoimmunology. 2012. May 1; 1(3):364–365 doi: 10.4161/onci.18614 - DOI - PMC - PubMed
Publication types
MeSH terms
LinkOut - more resources
Full Text Sources
Other Literature Sources
Medical
Research Materials
