. 2018 Jan 10;13(1):e0189916.
doi: 10.1371/journal.pone.0189916. eCollection 2018.

Detection of fast oscillating magnetic fields using dynamic multiple TR imaging and Fourier analysis

Affiliations

Detection of fast oscillating magnetic fields using dynamic multiple TR imaging and Fourier analysis

Ki Hwan Kim et al. PLoS One. .

Abstract

Neuronal oscillations produce oscillating magnetic fields. There have been trials to detect neuronal oscillations using MRI, but the detectability in in vivo is still in debate. Major obstacles to detecting neuronal oscillations are (i) weak amplitudes, (ii) fast oscillations, which are faster than MRI temporal resolution, and (iii) random frequencies and on/off intervals. In this study, we proposed a new approach for direct detection of weak and fast oscillating magnetic fields. The approach consists of (i) dynamic acquisitions using multiple times to repeats (TRs) and (ii) an expanded frequency spectral analysis. Gradient echo echo-planar imaging was used to test the feasibility of the proposed approach with a phantom generating oscillating magnetic fields with various frequencies and amplitudes and random on/off intervals. The results showed that the proposed approach could precisely detect the weak and fast oscillating magnetic fields with random frequencies and on/off intervals. Complex and phase spectra showed reliable signals, while no meaningful signals were observed in magnitude spectra. A two-TR approach provided an absolute frequency spectrum above Nyquist sampling frequency pixel by pixel with no a priori target frequency information. The proposed dynamic multiple-TR imaging and Fourier analysis are promising for direct detection of neuronal oscillations and potentially applicable to any pulse sequences.


Conflict of interest statement

Competing Interests: The authors have declared that no competing interests exist.

Figures

Fig 1
Fig 1. Diagrams explaining the proposed approach.
a: Dynamic MR acquisition with one TR value. Even when the sampling rate is lower than twice the frequency of oscillating magnetic field, oscillating signals can be captured at different phases (θ = θ1, θ2, θ3 ···) between the oscillating magnetic field and the MR sequence. As the MR phase signals (ΔΦ = ΔΦ1, ΔΦ 2, ΔΦ 3 ···) depend on the relative phase (θ), the oscillating magnetic field can be encoded as oscillating phase signals (ΔΦ) in the dynamic MR acquisition. b: Two−TR approach. The oscillating magnetic field was captured with two different sampling periods (ΔT1 and ΔT2) in two TR datasets (TR1 and TR2). Two frequency spectra were derived by applying 1D Fourier transform to two TR datasets. In order to match number of points and the frequency range of the two frequency spectra, linear interpolation was applied to the frequency spectrum from the smaller sampling period (data 2 in this figure). Next, the target frequency components (dotted circle) in two frequency spectra were multiplied and then the response at the target frequency was selected. The residual time ΔT, which is determined from TR and T, acts as a sampling period in the oscillating phase signals (ΔΦ). T: period of the neuronal oscillation, TR: repetition time, TE: echo time, and n: the closest integer multiple of T to TR.
Fig 2
Fig 2. Simulation results for sensitivity of the proposed approach to high-frequency oscillating magnetic field.
a: Effects of the number of dynamic scans (200, 500, and 1000). Oscillating magnetic fields ΔB(t) with strength and frequency of 1nT and 25 Hz were used. Frequency range of the spectra was adjusted to the sampling period of 10 ms, which was derived from TR of 10 ms and the target frequency of 25 Hz. Mean SNR spectra were derived by ROI averaging. b: Comparison of constant (left) and random ON/OFF (right) oscillating magnetic fields with a frequency of 25 Hz. In random ON/OFF oscillation, ΔB(t) was alternatingly turned on and off and the off-state was about 36% of the total states.
Fig 3
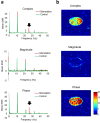
Fig 3. Representative frequency spectra acquired with GE-EPI.
The stimulation frequency was 25 Hz. Displayed are frequency spectra with the range adjusted to the residual time ΔT of 10 ms (a) and SNR maps at the target frequency of 25 Hz (b) for complex (top), magnitude (middle), and phase (bottom) datasets. Each frequency spectrum was acquired in the existence (stimulation) and absence (control) of stimulation (5 nT). The vertical scale of the spectra represents mean SNR of pixels in ROI. Black arrows indicate the peak produced by the stimulation.
Fig 4
Fig 4. Changes in sensitivity with stimulation strength and scan parameters.
Mean SNR of the peak produced by 25-Hz stimulation was evaluated at varying strengths (ΔB(t) = 0.5, 1, 5, 10 nT) (a) and at varying numbers of dynamic images from 1000 to 5000 with ΔB(t) = 1 nT (b). c: Multi-TE experiment. Various stimulation frequencies (= 25, 30, and 35 Hz) were tested at TE values ranging from 20 to 55 ms with a step of 5 ms.
Fig 5
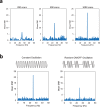
Fig 5. Effects of changes in stimulation frequency and on/off intervals.
Frequency range of the spectra were adjusted to the residual time ΔT of 10 ms, which was derived from TR of 90 ms and the target frequency of 25 Hz. a: Spectrum acquired with a constant 25-Hz stimulation. b: Spectrum acquired with random ON/OFF stimulation. The 25-Hz stimulation was randomly turned on and off. Total lengths of the ON- and OFF-states were about the same. c: Spectrum acquired with changes in stimulation frequency. The stimulation frequency was alternated between 15 Hz and 25 Hz repetitively. Black and purple arrows indicate the peaks produced by 25 Hz and 15 Hz. In this single-TR experiment, the peak at 15 Hz was misplaced at 35 Hz on the spectrum when target frequency was set to 25 Hz, which could be resolved in the two-TR experiment.
Fig 6
Fig 6. Detection of stimulations with two−TR experiments.
a−b: Detection of stimulation with one frequency component (25 Hz) using two alternating TRs (TR = 90 and 91 ms). The peak produced by the stimulation (arrow) was shifted in an amount of the stimulation frequency (25 Hz) in the spectrum (a) displayed with the sample number in the horizontal direction (a). In the absolute frequency spectrum derived from the two-TR experiment (b), the peak (arrow) was detected at 25 Hz and systematic noises were suppressed. c−d: Detection of multi-frequency stimulation (10 and 15 Hz) using two alternating TRs (TR = 90 and 91 ms). Two peaks (arrows) generated by stimulations were detected in spectrum from one of the two TRs (TR = 90 ms) (c). In the absolute frequency spectrum derived from the two-TR experiment, both of the two peaks generated by the stimulation were detected at the right positions (10 and 15 Hz) with no a priori target frequency information, while systematic noises were suppressed.

References

    1. Ogawa S, Lee TM, Kay AR, Tank DW. Brain magnetic resonance imaging with contrast dependent on blood oxygenation. Proc Natl Acad Sci U S A. 1990;87(24):9868–72. ; PubMed Central PMCID: PMCPMC55275. - PMC - PubMed
    1. Kwong KK, Belliveau JW, Chesler DA, Goldberg IE, Weisskoff RM, Poncelet BP, et al. Dynamic magnetic resonance imaging of human brain activity during primary sensory stimulation. Proc Natl Acad Sci U S A. 1992;89(12):5675–9. ; PubMed Central PMCID: PMCPMC49355. - PMC - PubMed
    1. Ogawa S, Menon RS, Tank DW, Kim SG, Merkle H, Ellermann JM, et al. Functional brain mapping by blood oxygenation level-dependent contrast magnetic resonance imaging. A comparison of signal characteristics with a biophysical model. Biophys J. 1993;64(3):803–12. doi: 10.1016/S0006-3495(93)81441-3 ; PubMed Central PMCID: PMCPMC1262394. - DOI - PMC - PubMed
    1. Gusnard DA, Raichle ME, Raichle ME. Searching for a baseline: functional imaging and the resting human brain. Nat Rev Neurosci. 2001;2(10):685–94. doi: 10.1038/35094500 . - DOI - PubMed
    1. Biswal B, Yetkin FZ, Haughton VM, Hyde JS. Functional Connectivity in the Motor Cortex of Resting Human Brain Using Echo-Planar Mri. Magnet Reson Med. 1995;34(4):537–41. doi: 10.1002/mrm.1910340409 PubMed PMID: WOS:A1995RX75100008. - DOI - PubMed

Publication types

LinkOut - more resources